Ōrākei Airbnb Market Analysis 2026: Short Term Rental Data & Vacation Rental Statistics in Auckland, New Zealand
Is Airbnb profitable in Ōrākei in 2026? Explore comprehensive Airbnb analytics for Ōrākei, Auckland, New Zealand to uncover income potential. This 2026 STR market report for Ōrākei, based on AirROI data from February 2025 to January 2026, reveals key trends in the market of 326 active listings.
Whether you're considering an Airbnb investment in Ōrākei, optimizing your existing vacation rental, or exploring rental arbitrage opportunities, understanding the Ōrākei Airbnb data is crucial. Leveraging the low regulation environment is key to maximizing your short term rental income potential. Let's dive into the specifics.
Key Ōrākei Airbnb Performance Metrics Overview
Monthly Airbnb Revenue Variations & Income Potential in Ōrākei (2026)
Understanding the monthly revenue variations for Airbnb listings in Ōrākei is key to maximizing your short term rental income potential. Seasonality significantly impacts earnings. Our analysis, based on data from the past 12 months, shows that the peak revenue month for STRs in Ōrākei is typically December, while June often presents the lowest earnings, highlighting opportunities for strategic pricing adjustments during shoulder and low seasons. Explore the typical Airbnb income in Ōrākei across different performance tiers:
- Best-in-class properties (Top 10%) achieve $4,574+ monthly, often utilizing dynamic pricing and superior guest experiences.
- Strong performing properties (Top 25%) earn $2,855 or more, indicating effective management and desirable locations/amenities.
- Typical properties (Median) generate around $1,538 per month, representing the average market performance.
- Entry-level properties (Bottom 25%) see earnings around $698, often with potential for optimization.
Average Monthly Airbnb Earnings Trend in Ōrākei
Ōrākei Airbnb Occupancy Rate Trends (2026)
Maximize your bookings by understanding the Ōrākei STR occupancy trends. Seasonal demand shifts significantly influence how often properties are booked. Typically, Februarysees the highest demand (peak season occupancy), while June experiences the lowest (low season). Effective strategies, like adjusting minimum stays or offering promotions, can boost occupancy during slower periods. Here's how different property tiers perform in Ōrākei:
- Best-in-class properties (Top 10%) achieve 85%+ occupancy, indicating high desirability and potentially optimized availability.
- Strong performing properties (Top 25%) maintain 69% or higher occupancy, suggesting good market fit and guest satisfaction.
- Typical properties (Median) have an occupancy rate around 45%.
- Entry-level properties (Bottom 25%) average 21% occupancy, potentially facing higher vacancy.
Average Monthly Occupancy Rate Trend in Ōrākei
Average Daily Rate (ADR) Airbnb Trends in Ōrākei (2026)
Effective short term rental pricing strategy in Ōrākei involves understanding monthly ADR fluctuations. The Average Daily Rate (ADR) for Airbnb in Ōrākei typically peaks in December and dips lowest during April. Leveraging Airbnb dynamic pricing tools or strategies based on this seasonality can significantly boost revenue. Here's a look at the typical nightly rates achieved:
- Best-in-class properties (Top 10%) command rates of $324+ per night, often due to premium features or locations.
- Strong performing properties (Top 25%) achieve nightly rates of $203 or more.
- Typical properties (Median) charge around $128 per night.
- Entry-level properties (Bottom 25%) earn around $75 per night.
Average Daily Rate (ADR) Trend by Month in Ōrākei
Get Live Ōrākei Market Intelligence 👇

Explore Real-time Analytics
Airbnb Seasonality Analysis & Trends in Ōrākei (2026)
Peak Season (December, February, March)
- Revenue averages $2,458 per month
- Occupancy rates average 53.5%
- Daily rates average $180
Shoulder Season
- Revenue averages $2,087 per month
- Occupancy maintains around 45.7%
- Daily rates hold near $178
Low Season (May, June, September)
- Revenue drops to average $1,739 per month
- Occupancy decreases to average 40.4%
- Daily rates adjust to average $172
Seasonality Insights for Ōrākei
- The Airbnb seasonality in Ōrākei shows moderate seasonality with distinct peak and low periods. While the sections above show seasonal averages, it's also insightful to look at the extremes:
- During the high season, the absolute peak month showcases Ōrākei's highest earning potential, with monthly revenues capable of climbing to $2,530, occupancy reaching a high of 58.2%, and ADRs peaking at $187.
- Conversely, the slowest single month of the year, typically falling within the low season, marks the market's lowest point. In this month, revenue might dip to $1,651, occupancy could drop to 37.0%, and ADRs may adjust down to $169.
- Understanding both the seasonal averages and these monthly peaks and troughs in revenue, occupancy, and ADR is crucial for maximizing your Airbnb profit potential in Ōrākei.
Seasonal Strategies for Maximizing Profit
- Peak Season: Maximize revenue through premium pricing and potentially longer minimum stays. Ensure high availability.
- Low Season: Offer competitive pricing, special promotions (e.g., extended stay discounts), and flexible cancellation policies. Target off-season travelers like remote workers or budget-conscious guests.
- Shoulder Seasons: Implement dynamic pricing that balances peak and low rates. Target weekend travelers or specific events. Offer slightly more flexible terms than peak season.
- Regularly analyze your own performance against these Ōrākei seasonality benchmarks and adjust your pricing and availability strategy accordingly.
Best Areas for Airbnb Investment in Ōrākei (2026)
Exploring the top neighborhoods for short-term rentals in Ōrākei? This section highlights key areas, outlining why they are attractive for hosts and guests, along with notable local attractions. Consider these locations based on your target guest profile and investment strategy.
| Neighborhood / Area | Why Host Here? (Target Guests & Appeal) | Key Attractions & Landmarks |
|---|---|---|
| St Heliers | A picturesque coastal suburb known for its beautiful beach, cafes, and stunning views of the Hauraki Gulf. Ideal for families and tourists looking for a relaxing getaway. | St Heliers Beach, St Heliers Bay Village, Tahuna Torea Nature Reserve, Michael Joseph Savage Memorial, Sandy Bay Beach, Kayak Tours |
| Mission Bay | A vibrant seaside suburb that boasts a popular beach, a range of restaurants, and a lively atmosphere. Great for attracting both locals and tourists alike. | Mission Bay Beach, Melanesia Market, MV R. Tucker Thompson, Mission Bay Waterfront Promenade, Domain Park |
| Orakei | A leafy urban suburb with a mix of residential and waterfront properties. Attractive for those looking to experience Auckland's lifestyle, featuring parks and waterfront views. | Orakei Bay Village, Takaparawha Reserve, Okahu Bay, Auckland War Memorial Museum, Nearby fishing spots |
| Kohimarama | Known for its stunning beach and recreational activities, this suburb is perfect for those looking for a beachside retreat with great amenities and accessibility. | Kohimarama Beach, Kohimarama Park, Murmur Research, Beachfront cafes, Flat White Coffee |
| Balmain | A unique suburb characterized by its historical architecture and friendly community. It attracts visitors with its charm and proximity to the waterfront. | Balmain Public School, Lilies on the Bay, Balmain Markets, Balmain Beach, Historic Buildings |
| Glendowie | An affluent residential area known for its excellent schools and family-friendly parks. Ideal for longer-term Airbnb stays with a homely atmosphere. | Glendowie College, Leicester Crescent, Rangitoto Island views, Huntly Downs Park, Glendowie Boating Club |
| Ellerslie | A vibrant suburb with a blend of local culture and modern amenities. Popular due to its proximity to the central business district and sporting events. | Ellerslie Racecourse, Ellerslie Village, Cornwall Park, Nearby shopping and dining, Transport accessibility |
| Auckland Waterfront | Direct access to the stunning waterfront views and attractions in Auckland, making it extremely desirable for tourists seeking urban adventures and relaxation. | Auckland Sky Tower, Auckland Viaduct, Wynyard Quarter, Ferry Terminal, Auckland War Memorial Museum |
Understanding Airbnb License Requirements & STR Laws in Ōrākei (2026)
While Ōrākei, Auckland, New Zealand currently shows low STR regulations, specific Airbnb license requirements might still exist or change. Always verify the latest short term rental regulations and Airbnb license requirements directly with local government authorities for Ōrākei to ensure full compliance before hosting.
(Source: AirROI data, 2026, based on 0% licensed listings)
Top Performing Airbnb Properties in Ōrākei (2026)
Benchmark your potential! Explore examples of top-performing Airbnb properties in Ōrākeibased on Trailing Twelve Month (TTM) revenue. Analyze their characteristics, revenue, occupancy rate, and ADR to understand what drives success in this market.
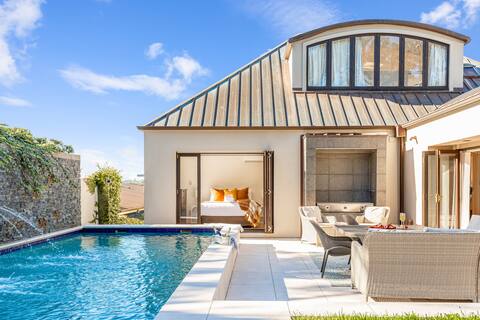
Leafy Remuera Paradise - Pool & 4 Bedroom Home
Entire Place • 4 bedrooms

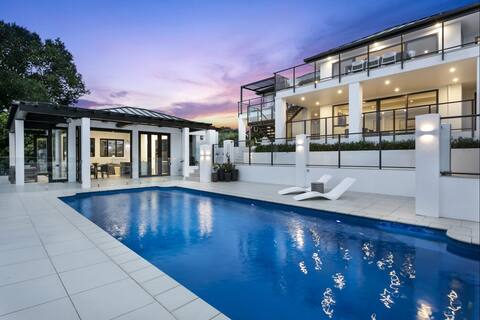
Designer Dream Home
Entire Place • 5 bedrooms
Luxury Mission Bay Oasis with Heated Pool
Entire Place • 7 bedrooms

The Millionaire Dream | Luxe | Pool & Sea Views
Entire Place • 4 bedrooms

Luxury 3 Bedroom Balinese Beauty
Entire Place • 3 bedrooms

WATERFRONT RETREAT
Entire Place • 3 bedrooms
Note: Performance varies based on location, size, amenities, seasonality, and management quality. Data reflects the past 12 months.
Top Performing Airbnb Hosts in Ōrākei (2026)
Learn from the best! This table showcases top-performing Airbnb hosts in Ōrākei based on the number of properties managed and estimated total revenue over the past year. Analyze their scale and performance metrics.
| Host Name | Properties | Grossing Revenue | Stay Reviews | Avg Rating |
|---|---|---|---|---|
| Team EJ | 10 | $249,652 | 437 | 4.46/5.0 |
| Amy | 11 | $238,000 | 182 | 4.77/5.0 |
| Stefan | 5 | $184,906 | 143 | 4.72/5.0 |
| Sandy | 3 | $108,431 | 130 | 4.81/5.0 |
| Tyler | 1 | $107,422 | 58 | 4.79/5.0 |
| Chris | 1 | $103,589 | 166 | 4.89/5.0 |
| Toodle | 3 | $102,388 | 108 | 4.77/5.0 |
| Sky | 3 | $99,294 | 91 | 4.66/5.0 |
| Lisa | 2 | $92,577 | 59 | 4.43/5.0 |
| Rochelle | 1 | $91,215 | 15 | 5.00/5.0 |
Analyzing the strategies of top hosts, such as their property selection, pricing, and guest communication, can offer valuable lessons for optimizing your own Airbnb operations in Ōrākei.
Dive Deeper: Advanced Ōrākei STR Market Data (2026)
Ready to unlock more insights? AirROI provides access to advanced metrics and comprehensive Airbnb data for Ōrākei. Explore detailed analytics beyond this report to refine your investment strategy, optimize pricing, and maximize your vacation rental profits.
Explore Advanced MetricsŌrākei Short-Term Rental Market Composition (2026): Property & Room Types
Room Type Distribution
Property Type Distribution
Market Composition Insights for Ōrākei
- The Ōrākei Airbnb market composition is heavily skewed towards Entire Home/Apt listings, which make up 73% of the 326 active rentals. This indicates strong guest preference for privacy and space.
- Looking at the property type distribution in Ōrākei, House properties are the most common (60.4%), reflecting the local real estate landscape.
- Houses represent a significant 60.4% portion, catering likely to families or larger groups.
- The presence of 8.9% Hotel/Boutique listings indicates integration with traditional hospitality.
- Smaller segments like outdoor/unique (combined 0.6%) offer potential for unique stay experiences.
Ōrākei Airbnb Room Capacity Analysis (2026): Bedroom Distribution
Distribution of Listings by Number of Bedrooms
Room Capacity Insights for Ōrākei
- The dominant room capacity in Ōrākei is 1 bedroom listings, making up 30.1% of the market. This suggests a strong demand for properties suitable for couples or solo travelers.
- Together, 1 bedroom and 3 bedrooms properties represent 49.7% of the active Airbnb listings in Ōrākei, indicating a high concentration in these sizes.
- A significant 31.0% of listings offer 3+ bedrooms, catering to larger groups and families seeking more space in Ōrākei.
Ōrākei Vacation Rental Guest Capacity Trends (2026)
Distribution of Listings by Guest Capacity
Guest Capacity Insights for Ōrākei
- The most common guest capacity trend in Ōrākei vacation rentals is listings accommodating 2 guests (23.3%). This suggests the primary traveler segment is likely couples or solo travelers.
- Properties designed for 2 guests and 4 guests dominate the Ōrākei STR market, accounting for 40.5% of listings.
- 25.5% of properties accommodate 6+ guests, serving the market segment for larger families or group travel in Ōrākei.
- On average, properties in Ōrākei are equipped to host 3.4 guests.
Ōrākei Airbnb Booking Patterns (2026): Available vs. Booked Days
Available Days Distribution
Booked Days Distribution
Booking Pattern Insights for Ōrākei
- The most common availability pattern in Ōrākei falls within the 271-366 days range, representing 43.3% of listings. This suggests many properties have significant open periods on their calendars.
- Approximately 72.7% of listings show high availability (181+ days open annually), indicating potential for increased bookings or specific owner usage patterns.
- For booked days, the 91-180 days range is most frequent in Ōrākei (28.5%), reflecting common guest stay durations or potential owner blocking patterns.
- A notable 29.1% of properties secure long booking periods (181+ days booked per year), highlighting successful long-term rental strategies or significant owner usage.
Ōrākei Airbnb Minimum Stay Requirements Analysis
Distribution of Listings by Minimum Night Requirement
1 Night
86 listings
26.4% of total
2 Nights
70 listings
21.5% of total
3 Nights
21 listings
6.4% of total
4-6 Nights
29 listings
8.9% of total
7-29 Nights
15 listings
4.6% of total
30+ Nights
105 listings
32.2% of total
Key Insights
- The most prevalent minimum stay requirement in Ōrākei is 30+ Nights, adopted by 32.2% of listings. This highlights the market's preference for longer commitments.
- A significant segment (32.2%) caters to monthly stays (30+ nights) in Ōrākei, pointing to opportunities in the extended-stay market.
Recommendations
- Align with the market by considering a 30+ Nights minimum stay, as 32.2% of Ōrākei hosts use this setting.
- If feasible, allowing 1-night stays, especially midweek or during low season, could capture last-minute bookings, as only 26.4% currently do.
- Explore offering discounts for stays of 30+ nights to attract the 32.2% of the market seeking extended stays.
- Adjust minimum nights based on seasonality – potentially shorter during low season and longer during peak demand periods in Ōrākei.
Ōrākei Airbnb Cancellation Policy Trends Analysis (2026)
Super Strict 30 Days
11 listings
3.4% of total
Super Strict 60 Days
2 listings
0.6% of total
Limited
6 listings
1.8% of total
Flexible
78 listings
23.9% of total
Moderate
109 listings
33.4% of total
Firm
102 listings
31.3% of total
Strict
18 listings
5.5% of total
Cancellation Policy Insights for Ōrākei
- The prevailing Airbnb cancellation policy trend in Ōrākei is Moderate, used by 33.4% of listings.
- There's a relatively balanced mix between guest-friendly (57.3%) and stricter (36.8%) policies, offering choices for different guest needs.
- Strict cancellation policies are quite rare (5.5%), potentially making listings with this policy less competitive unless justified by high demand or property type.
Recommendations for Hosts
- Consider adopting a Moderate policy to align with the 33.4% market standard in Ōrākei.
- Using a Strict policy might deter some guests, as only 5.5% of listings use it. Evaluate if potential revenue protection outweighs possible lower booking rates.
- Regularly review your cancellation policy against competitors and market demand shifts in Ōrākei.
Ōrākei STR Booking Lead Time Analysis (2026)
Average Booking Lead Time by Month
Booking Lead Time Insights for Ōrākei
- The overall average booking lead time for vacation rentals in Ōrākei is 47 days.
- Guests book furthest in advance for stays during January (average 72 days), likely coinciding with peak travel demand or local events.
- The shortest booking windows occur for stays in June (average 27 days), indicating more last-minute travel plans during this time.
- Seasonally, Winter (60 days avg.) sees the longest lead times, while Summer (39 days avg.) has the shortest, reflecting typical travel planning cycles.
Recommendations for Hosts
- Use the overall average lead time (47 days) as a baseline for your pricing and availability strategy in Ōrākei.
- For January stays, consider implementing length-of-stay discounts or slightly higher rates for bookings made less than 72 days out to capitalize on advance planning.
- Target marketing efforts for the Winter season well in advance (at least 60 days) to capture early planners.
- Monitor your own booking lead times against these Ōrākei averages to identify opportunities for dynamic pricing adjustments.
Popular & Essential Airbnb Amenities in Ōrākei (2026)
Amenity Prevalence
Amenity Insights for Ōrākei
- Essential amenities in Ōrākei that guests expect include: Wifi, Smoke alarm. Lacking these (any) could significantly impact bookings.
- Popular amenities like Heating, Hot water, Dishes and silverware are common but not universal. Offering these can provide a competitive edge.
Recommendations for Hosts
- Ensure your listing includes all essential amenities for Ōrākei: Wifi, Smoke alarm.
- Prioritize adding missing essentials: Wifi, Smoke alarm.
- Consider adding popular differentiators like Heating or Hot water to increase appeal.
- Highlight unique or less common amenities you offer (e.g., hot tub, dedicated workspace, EV charger) in your listing description and photos.
- Regularly check competitor amenities in Ōrākei to stay competitive.
Ōrākei Airbnb Guest Demographics & Profile Analysis (2026)
Guest Profile Summary for Ōrākei
- The typical guest profile for Airbnb in Ōrākei consists of a mix of domestic (56%) and international guests, often arriving from nearby Auckland, typically belonging to the Post-2000s (Gen Z/Alpha) group (50%), primarily speaking English or French.
- Domestic travelers account for 56.1% of guests.
- Key international markets include New Zealand (56.1%) and Australia (12.3%).
- Top languages spoken are English (63.3%) followed by French (6%).
- A significant demographic segment is the Post-2000s (Gen Z/Alpha) group, representing 50% of guests.
Recommendations for Hosts
- Balance marketing efforts between domestic and international channels based on the guest mix.
- Tailor amenities and listing descriptions to appeal to the dominant Post-2000s (Gen Z/Alpha) demographic (e.g., highlight fast WiFi, smart home features, local guides).
- Highlight unique local experiences or amenities relevant to the primary guest profile.
- Consider seasonal promotions aligned with peak travel times for key origin markets.
Nearby Short-Term Rental Market Comparison
How does the Ōrākei Airbnb market stack up against its neighbors? Compare key performance metrics like average monthly revenue, ADR, and occupancy rates in surrounding areas to understand the broader regional STR landscape.
| Market | Active Properties | Monthly Revenue | Daily Rate | Avg. Occupancy |
|---|---|---|---|---|
| Hot Water Beach | 27 | $2,949 | $257.55 | 50% |
| Whananaki | 14 | $2,368 | $364.38 | 36% |
| Waiheke | 580 | $2,274 | $338.47 | 32% |
| Hahei | 104 | $2,241 | $260.25 | 39% |
| Opito Bay | 16 | $1,911 | $294.47 | 29% |
| Karapiro | 40 | $1,865 | $206.22 | 37% |
| Waitematā | 1,525 | $1,702 | $146.61 | 50% |
| Rukuhia | 10 | $1,675 | $216.31 | 33% |
| Tamahere | 76 | $1,665 | $198.77 | 39% |
| Tutukaka | 44 | $1,659 | $203.24 | 36% |