Whau Airbnb Market Analysis 2026: Short Term Rental Data & Vacation Rental Statistics in Auckland, New Zealand
Is Airbnb profitable in Whau in 2026? Explore comprehensive Airbnb analytics for Whau, Auckland, New Zealand to uncover income potential. This 2026 STR market report for Whau, based on AirROI data from February 2025 to January 2026, reveals key trends in the niche market of 126 active listings.
Whether you're considering an Airbnb investment in Whau, optimizing your existing vacation rental, or exploring rental arbitrage opportunities, understanding the Whau Airbnb data is crucial. Leveraging the low regulation environment is key to maximizing your short term rental income potential. Let's dive into the specifics.
Key Whau Airbnb Performance Metrics Overview
Monthly Airbnb Revenue Variations & Income Potential in Whau (2026)
Understanding the monthly revenue variations for Airbnb listings in Whau is key to maximizing your short term rental income potential. Seasonality significantly impacts earnings. Our analysis, based on data from the past 12 months, shows that the peak revenue month for STRs in Whau is typically December, while June often presents the lowest earnings, highlighting opportunities for strategic pricing adjustments during shoulder and low seasons. Explore the typical Airbnb income in Whau across different performance tiers:
- Best-in-class properties (Top 10%) achieve $2,692+ monthly, often utilizing dynamic pricing and superior guest experiences.
- Strong performing properties (Top 25%) earn $1,603 or more, indicating effective management and desirable locations/amenities.
- Typical properties (Median) generate around $754 per month, representing the average market performance.
- Entry-level properties (Bottom 25%) see earnings around $355, often with potential for optimization.
Average Monthly Airbnb Earnings Trend in Whau
Whau Airbnb Occupancy Rate Trends (2026)
Maximize your bookings by understanding the Whau STR occupancy trends. Seasonal demand shifts significantly influence how often properties are booked. Typically, Marchsees the highest demand (peak season occupancy), while June experiences the lowest (low season). Effective strategies, like adjusting minimum stays or offering promotions, can boost occupancy during slower periods. Here's how different property tiers perform in Whau:
- Best-in-class properties (Top 10%) achieve 83%+ occupancy, indicating high desirability and potentially optimized availability.
- Strong performing properties (Top 25%) maintain 65% or higher occupancy, suggesting good market fit and guest satisfaction.
- Typical properties (Median) have an occupancy rate around 38%.
- Entry-level properties (Bottom 25%) average 16% occupancy, potentially facing higher vacancy.
Average Monthly Occupancy Rate Trend in Whau
Average Daily Rate (ADR) Airbnb Trends in Whau (2026)
Effective short term rental pricing strategy in Whau involves understanding monthly ADR fluctuations. The Average Daily Rate (ADR) for Airbnb in Whau typically peaks in January and dips lowest during April. Leveraging Airbnb dynamic pricing tools or strategies based on this seasonality can significantly boost revenue. Here's a look at the typical nightly rates achieved:
- Best-in-class properties (Top 10%) command rates of $200+ per night, often due to premium features or locations.
- Strong performing properties (Top 25%) achieve nightly rates of $130 or more.
- Typical properties (Median) charge around $74 per night.
- Entry-level properties (Bottom 25%) earn around $43 per night.
Average Daily Rate (ADR) Trend by Month in Whau
Get Live Whau Market Intelligence 👇

Explore Real-time Analytics
Airbnb Seasonality Analysis & Trends in Whau (2026)
Peak Season (December, March, January)
- Revenue averages $1,424 per month
- Occupancy rates average 45.6%
- Daily rates average $108
Shoulder Season
- Revenue averages $1,217 per month
- Occupancy maintains around 43.7%
- Daily rates hold near $104
Low Season (May, June, September)
- Revenue drops to average $930 per month
- Occupancy decreases to average 34.9%
- Daily rates adjust to average $102
Seasonality Insights for Whau
- The Airbnb seasonality in Whau shows moderate seasonality with distinct peak and low periods. While the sections above show seasonal averages, it's also insightful to look at the extremes:
- During the high season, the absolute peak month showcases Whau's highest earning potential, with monthly revenues capable of climbing to $1,546, occupancy reaching a high of 50.4%, and ADRs peaking at $114.
- Conversely, the slowest single month of the year, typically falling within the low season, marks the market's lowest point. In this month, revenue might dip to $791, occupancy could drop to 33.0%, and ADRs may adjust down to $96.
- Understanding both the seasonal averages and these monthly peaks and troughs in revenue, occupancy, and ADR is crucial for maximizing your Airbnb profit potential in Whau.
Seasonal Strategies for Maximizing Profit
- Peak Season: Maximize revenue through premium pricing and potentially longer minimum stays. Ensure high availability.
- Low Season: Offer competitive pricing, special promotions (e.g., extended stay discounts), and flexible cancellation policies. Target off-season travelers like remote workers or budget-conscious guests.
- Shoulder Seasons: Implement dynamic pricing that balances peak and low rates. Target weekend travelers or specific events. Offer slightly more flexible terms than peak season.
- Regularly analyze your own performance against these Whau seasonality benchmarks and adjust your pricing and availability strategy accordingly.
Best Areas for Airbnb Investment in Whau (2026)
Exploring the top neighborhoods for short-term rentals in Whau? This section highlights key areas, outlining why they are attractive for hosts and guests, along with notable local attractions. Consider these locations based on your target guest profile and investment strategy.
| Neighborhood / Area | Why Host Here? (Target Guests & Appeal) | Key Attractions & Landmarks |
|---|---|---|
| New Lynn | A rapidly growing suburb with excellent transport links and a thriving shopping area, making it ideal for both business travelers and vacationers. | LynnMall Shopping Centre, Entertainment Complex, New Lynn Train Station, Pukematekeo Park, Avondale Racecourse |
| Blockhouse Bay | A family-friendly suburb with scenic views of the Waitematā Harbour and easy access to parks and beaches. Great for those seeking a quiet stay close to nature. | Blockhouse Bay Beach, Harbourview – Orangihina Park, Blockhouse Bay Village, Lynfield Cove, Duchess Avenue Reserve |
| Green Bay | Known for its picturesque beaches and lush reserves, Green Bay attracts travelers looking for relaxation and outdoor activities over the weekend. | Green Bay Beach, Kowhai Reserve, Green Bay Walkway, Glen Innes – Auckland Central, Titirangi Golf Club |
| Kelston | A suburban area that provides affordable accommodation options, attracting budget-conscious travelers and families with easy access to local amenities. | Kelston Shopping Centre, Local Parks, Nearby beaches, Easy access to public transport, Arts and crafts markets |
| Glendene | This suburb is becoming increasingly popular due to its affordability and proximity to central Auckland, drawing in a mix of tourists and locals. | Glendene Community Hall, Nearby parks, Local shops, Public transport facilities, Proximity to Westfield LynnMall |
| Westgate | A fast-developing area with major shopping complexes and recreational spaces, making it suitable for tourists wanting to explore West Auckland. | Westgate Shopping Centre, The Trusts Arena, Local parks, Adventure cycle track, West Auckland's wineries |
| Henderson | A vibrant area with a mix of cultures and community events, suitable for travelers seeking an authentic local experience. | West City Shopping Centre, Henderson Creek, Local markets, Henderson Park, Nearby vineyards |
| Sunnyvale | A quieter suburb with a laid-back atmosphere, appealing to those who prefer a peaceful stay while remaining close to the city. | Sunnyvale Train Station, Local parks, Community Art Center, Nearby amenities, Access to bush walks |
Understanding Airbnb License Requirements & STR Laws in Whau (2026)
While Whau, Auckland, New Zealand currently shows low STR regulations, specific Airbnb license requirements might still exist or change. Always verify the latest short term rental regulations and Airbnb license requirements directly with local government authorities for Whau to ensure full compliance before hosting.
(Source: AirROI data, 2026, finding no licensed listings among those analyzed)
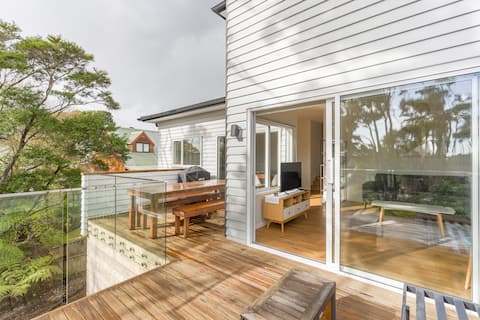
Top Performing Airbnb Properties in Whau (2026)
Benchmark your potential! Explore examples of top-performing Airbnb properties in Whaubased on Trailing Twelve Month (TTM) revenue. Analyze their characteristics, revenue, occupancy rate, and ADR to understand what drives success in this market.
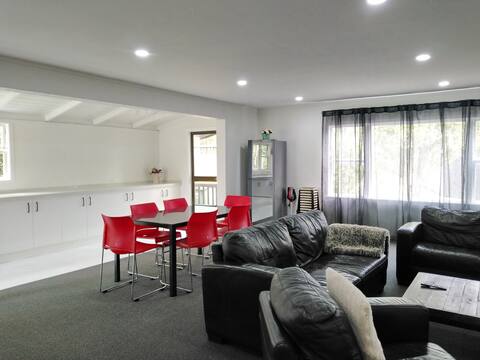
Large Family House New Lynn
Entire Place • 7 bedrooms

Private Oasis
Entire Place • 5 bedrooms

Big Family Holiday Home at Tiverton No 4
Entire Place • 5 bedrooms

New Windsor Family Home
Entire Place • 4 bedrooms
Peaceful New House with Bush View
Entire Place • 4 bedrooms
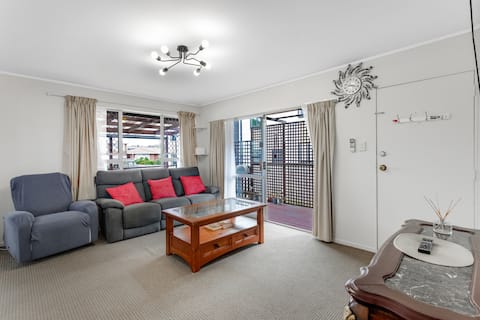
Homespun Unit with deck, air-con and parking
Entire Place • 2 bedrooms
Note: Performance varies based on location, size, amenities, seasonality, and management quality. Data reflects the past 12 months.
Top Performing Airbnb Hosts in Whau (2026)
Learn from the best! This table showcases top-performing Airbnb hosts in Whau based on the number of properties managed and estimated total revenue over the past year. Analyze their scale and performance metrics.
| Host Name | Properties | Grossing Revenue | Stay Reviews | Avg Rating |
|---|---|---|---|---|
| Hostech Limited | 1 | $75,292 | 62 | 4.58/5.0 |
| WorX Holidays | 2 | $70,857 | 22 | 4.39/5.0 |
| Team EJ | 2 | $58,978 | 78 | 4.61/5.0 |
| Aaron | 1 | $43,433 | 237 | 4.79/5.0 |
| Aaron | 1 | $40,158 | 118 | 4.92/5.0 |
| Vreni | 1 | $39,355 | 84 | 4.94/5.0 |
| Barbara | 1 | $30,561 | 88 | 4.97/5.0 |
| Roomie | 9 | $30,092 | 228 | 4.85/5.0 |
| Terry | 1 | $28,672 | 21 | 4.90/5.0 |
| Bachcare | 7 | $27,786 | 14 | 4.65/5.0 |
Analyzing the strategies of top hosts, such as their property selection, pricing, and guest communication, can offer valuable lessons for optimizing your own Airbnb operations in Whau.
Dive Deeper: Advanced Whau STR Market Data (2026)
Ready to unlock more insights? AirROI provides access to advanced metrics and comprehensive Airbnb data for Whau. Explore detailed analytics beyond this report to refine your investment strategy, optimize pricing, and maximize your vacation rental profits.
Explore Advanced MetricsWhau Short-Term Rental Market Composition (2026): Property & Room Types
Room Type Distribution
Property Type Distribution
Market Composition Insights for Whau
- The Whau Airbnb market composition is heavily skewed towards Entire Home/Apt listings, which make up 61.1% of the 126 active rentals. This indicates strong guest preference for privacy and space.
- However, a notable 38.9% share for Private Rooms suggests opportunities for budget-conscious travelers or hosts renting out spare rooms.
- Looking at the property type distribution in Whau, House properties are the most common (69%), reflecting the local real estate landscape.
- Houses represent a significant 69% portion, catering likely to families or larger groups.
- The presence of 9.5% Hotel/Boutique listings indicates integration with traditional hospitality.
- Smaller segments like outdoor/unique (combined 0.8%) offer potential for unique stay experiences.
Whau Airbnb Room Capacity Analysis (2026): Bedroom Distribution
Distribution of Listings by Number of Bedrooms
Room Capacity Insights for Whau
- The dominant room capacity in Whau is 1 bedroom listings, making up 23.8% of the market. This suggests a strong demand for properties suitable for couples or solo travelers.
- Together, 1 bedroom and 2 bedrooms properties represent 42.1% of the active Airbnb listings in Whau, indicating a high concentration in these sizes.
Whau Vacation Rental Guest Capacity Trends (2026)
Distribution of Listings by Guest Capacity
Guest Capacity Insights for Whau
- The most common guest capacity trend in Whau vacation rentals is listings accommodating 2 guests (20.6%). This suggests the primary traveler segment is likely couples or solo travelers.
- Properties designed for 2 guests and 4 guests dominate the Whau STR market, accounting for 39.6% of listings.
- 15.8% of properties accommodate 6+ guests, serving the market segment for larger families or group travel in Whau.
- On average, properties in Whau are equipped to host 2.6 guests.
Whau Airbnb Booking Patterns (2026): Available vs. Booked Days
Available Days Distribution
Booked Days Distribution
Booking Pattern Insights for Whau
- The most common availability pattern in Whau falls within the 271-366 days range, representing 59.5% of listings. This suggests many properties have significant open periods on their calendars.
- Approximately 82.5% of listings show high availability (181+ days open annually), indicating potential for increased bookings or specific owner usage patterns.
- For booked days, the 31-90 days range is most frequent in Whau (33.3%), reflecting common guest stay durations or potential owner blocking patterns.
- A notable 18.2% of properties secure long booking periods (181+ days booked per year), highlighting successful long-term rental strategies or significant owner usage.
Whau Airbnb Minimum Stay Requirements Analysis
Distribution of Listings by Minimum Night Requirement
1 Night
40 listings
31.7% of total
2 Nights
35 listings
27.8% of total
3 Nights
10 listings
7.9% of total
4-6 Nights
10 listings
7.9% of total
7-29 Nights
5 listings
4% of total
30+ Nights
26 listings
20.6% of total
Key Insights
- The most prevalent minimum stay requirement in Whau is 1 Night, adopted by 31.7% of listings. This highlights the market's preference for shorter, flexible bookings.
- A significant segment (20.6%) caters to monthly stays (30+ nights) in Whau, pointing to opportunities in the extended-stay market.
Recommendations
- Align with the market by considering a 1 Night minimum stay, as 31.7% of Whau hosts use this setting.
- Explore offering discounts for stays of 30+ nights to attract the 20.6% of the market seeking extended stays.
- Adjust minimum nights based on seasonality – potentially shorter during low season and longer during peak demand periods in Whau.
Whau Airbnb Cancellation Policy Trends Analysis (2026)
Flexible
27 listings
21.4% of total
Moderate
53 listings
42.1% of total
Firm
32 listings
25.4% of total
Strict
14 listings
11.1% of total
Cancellation Policy Insights for Whau
- The prevailing Airbnb cancellation policy trend in Whau is Moderate, used by 42.1% of listings.
- There's a relatively balanced mix between guest-friendly (63.5%) and stricter (36.5%) policies, offering choices for different guest needs.
Recommendations for Hosts
- Consider adopting a Moderate policy to align with the 42.1% market standard in Whau.
- Using a Strict policy might deter some guests, as only 11.1% of listings use it. Evaluate if potential revenue protection outweighs possible lower booking rates.
- Regularly review your cancellation policy against competitors and market demand shifts in Whau.
Whau STR Booking Lead Time Analysis (2026)
Average Booking Lead Time by Month
Booking Lead Time Insights for Whau
- The overall average booking lead time for vacation rentals in Whau is 42 days.
- Guests book furthest in advance for stays during January (average 95 days), likely coinciding with peak travel demand or local events.
- The shortest booking windows occur for stays in May (average 24 days), indicating more last-minute travel plans during this time.
- Seasonally, Winter (60 days avg.) sees the longest lead times, while Spring (26 days avg.) has the shortest, reflecting typical travel planning cycles.
Recommendations for Hosts
- Use the overall average lead time (42 days) as a baseline for your pricing and availability strategy in Whau.
- For January stays, consider implementing length-of-stay discounts or slightly higher rates for bookings made less than 95 days out to capitalize on advance planning.
- Target marketing efforts for the Winter season well in advance (at least 60 days) to capture early planners.
- Monitor your own booking lead times against these Whau averages to identify opportunities for dynamic pricing adjustments.
Popular & Essential Airbnb Amenities in Whau (2026)
Amenity Prevalence
Amenity Insights for Whau
- Essential amenities in Whau that guests expect include: Wifi, Smoke alarm, Hot water. Lacking these (any) could significantly impact bookings.
- Popular amenities like Dishes and silverware, Kitchen, Refrigerator are common but not universal. Offering these can provide a competitive edge.
Recommendations for Hosts
- Ensure your listing includes all essential amenities for Whau: Wifi, Smoke alarm, Hot water.
- Prioritize adding missing essentials: Wifi, Smoke alarm, Hot water.
- Consider adding popular differentiators like Dishes and silverware or Kitchen to increase appeal.
- Highlight unique or less common amenities you offer (e.g., hot tub, dedicated workspace, EV charger) in your listing description and photos.
- Regularly check competitor amenities in Whau to stay competitive.
Whau Airbnb Guest Demographics & Profile Analysis (2026)
Guest Profile Summary for Whau
- The typical guest profile for Airbnb in Whau consists of a mix of domestic (55%) and international guests, often arriving from nearby Auckland, typically belonging to the Post-2000s (Gen Z/Alpha) group (50%), primarily speaking English or Spanish.
- Domestic travelers account for 54.8% of guests.
- Key international markets include New Zealand (54.8%) and Australia (9.7%).
- Top languages spoken are English (53.4%) followed by Spanish (6.8%).
- A significant demographic segment is the Post-2000s (Gen Z/Alpha) group, representing 50% of guests.
Recommendations for Hosts
- Balance marketing efforts between domestic and international channels based on the guest mix.
- Tailor amenities and listing descriptions to appeal to the dominant Post-2000s (Gen Z/Alpha) demographic (e.g., highlight fast WiFi, smart home features, local guides).
- Highlight unique local experiences or amenities relevant to the primary guest profile.
- Consider seasonal promotions aligned with peak travel times for key origin markets.
Nearby Short-Term Rental Market Comparison
How does the Whau Airbnb market stack up against its neighbors? Compare key performance metrics like average monthly revenue, ADR, and occupancy rates in surrounding areas to understand the broader regional STR landscape.
| Market | Active Properties | Monthly Revenue | Daily Rate | Avg. Occupancy |
|---|---|---|---|---|
| Hot Water Beach | 27 | $2,949 | $257.55 | 50% |
| Whananaki | 14 | $2,368 | $364.38 | 36% |
| Waiheke | 580 | $2,274 | $338.47 | 32% |
| Hahei | 104 | $2,241 | $260.25 | 39% |
| Opito Bay | 16 | $1,911 | $294.47 | 29% |
| Karapiro | 40 | $1,865 | $206.22 | 37% |
| Waitematā | 1,525 | $1,702 | $146.61 | 50% |
| Rukuhia | 10 | $1,675 | $216.31 | 33% |
| Tamahere | 76 | $1,665 | $198.77 | 39% |
| Tutukaka | 44 | $1,659 | $203.24 | 36% |