Rodney Airbnb Market Analysis 2026: Short Term Rental Data & Vacation Rental Statistics in Auckland, New Zealand
Is Airbnb profitable in Rodney in 2026? Explore comprehensive Airbnb analytics for Rodney, Auckland, New Zealand to uncover income potential. This 2026 STR market report for Rodney, based on AirROI data from February 2025 to January 2026, reveals key trends in the market of 565 active listings.
Whether you're considering an Airbnb investment in Rodney, optimizing your existing vacation rental, or exploring rental arbitrage opportunities, understanding the Rodney Airbnb data is crucial. Leveraging the low regulation environment is key to maximizing your short term rental income potential. Let's dive into the specifics.
Key Rodney Airbnb Performance Metrics Overview
Monthly Airbnb Revenue Variations & Income Potential in Rodney (2026)
Understanding the monthly revenue variations for Airbnb listings in Rodney is key to maximizing your short term rental income potential. Seasonality significantly impacts earnings. Our analysis, based on data from the past 12 months, shows that the peak revenue month for STRs in Rodney is typically December, while September often presents the lowest earnings, highlighting opportunities for strategic pricing adjustments during shoulder and low seasons. Explore the typical Airbnb income in Rodney across different performance tiers:
- Best-in-class properties (Top 10%) achieve $4,424+ monthly, often utilizing dynamic pricing and superior guest experiences.
- Strong performing properties (Top 25%) earn $2,551 or more, indicating effective management and desirable locations/amenities.
- Typical properties (Median) generate around $1,344 per month, representing the average market performance.
- Entry-level properties (Bottom 25%) see earnings around $656, often with potential for optimization.
Average Monthly Airbnb Earnings Trend in Rodney
Rodney Airbnb Occupancy Rate Trends (2026)
Maximize your bookings by understanding the Rodney STR occupancy trends. Seasonal demand shifts significantly influence how often properties are booked. Typically, Februarysees the highest demand (peak season occupancy), while June experiences the lowest (low season). Effective strategies, like adjusting minimum stays or offering promotions, can boost occupancy during slower periods. Here's how different property tiers perform in Rodney:
- Best-in-class properties (Top 10%) achieve 71%+ occupancy, indicating high desirability and potentially optimized availability.
- Strong performing properties (Top 25%) maintain 50% or higher occupancy, suggesting good market fit and guest satisfaction.
- Typical properties (Median) have an occupancy rate around 29%.
- Entry-level properties (Bottom 25%) average 14% occupancy, potentially facing higher vacancy.
Average Monthly Occupancy Rate Trend in Rodney
Average Daily Rate (ADR) Airbnb Trends in Rodney (2026)
Effective short term rental pricing strategy in Rodney involves understanding monthly ADR fluctuations. The Average Daily Rate (ADR) for Airbnb in Rodney typically peaks in January and dips lowest during April. Leveraging Airbnb dynamic pricing tools or strategies based on this seasonality can significantly boost revenue. Here's a look at the typical nightly rates achieved:
- Best-in-class properties (Top 10%) command rates of $443+ per night, often due to premium features or locations.
- Strong performing properties (Top 25%) achieve nightly rates of $279 or more.
- Typical properties (Median) charge around $156 per night.
- Entry-level properties (Bottom 25%) earn around $100 per night.
Average Daily Rate (ADR) Trend by Month in Rodney
Get Live Rodney Market Intelligence 👇

Explore Real-time Analytics
Airbnb Seasonality Analysis & Trends in Rodney (2026)
Peak Season (December, February, January)
- Revenue averages $2,566 per month
- Occupancy rates average 40.6%
- Daily rates average $230
Shoulder Season
- Revenue averages $1,949 per month
- Occupancy maintains around 33.7%
- Daily rates hold near $219
Low Season (July, August, September)
- Revenue drops to average $1,577 per month
- Occupancy decreases to average 28.7%
- Daily rates adjust to average $220
Seasonality Insights for Rodney
- The Airbnb seasonality in Rodney shows moderate seasonality with distinct peak and low periods. While the sections above show seasonal averages, it's also insightful to look at the extremes:
- During the high season, the absolute peak month showcases Rodney's highest earning potential, with monthly revenues capable of climbing to $2,628, occupancy reaching a high of 45.0%, and ADRs peaking at $236.
- Conversely, the slowest single month of the year, typically falling within the low season, marks the market's lowest point. In this month, revenue might dip to $1,536, occupancy could drop to 26.7%, and ADRs may adjust down to $215.
- Understanding both the seasonal averages and these monthly peaks and troughs in revenue, occupancy, and ADR is crucial for maximizing your Airbnb profit potential in Rodney.
Seasonal Strategies for Maximizing Profit
- Peak Season: Maximize revenue through premium pricing and potentially longer minimum stays. Ensure high availability.
- Low Season: Offer competitive pricing, special promotions (e.g., extended stay discounts), and flexible cancellation policies. Target off-season travelers like remote workers or budget-conscious guests.
- Shoulder Seasons: Implement dynamic pricing that balances peak and low rates. Target weekend travelers or specific events. Offer slightly more flexible terms than peak season.
- Regularly analyze your own performance against these Rodney seasonality benchmarks and adjust your pricing and availability strategy accordingly.
Best Areas for Airbnb Investment in Rodney (2026)
Exploring the top neighborhoods for short-term rentals in Rodney? This section highlights key areas, outlining why they are attractive for hosts and guests, along with notable local attractions. Consider these locations based on your target guest profile and investment strategy.
| Neighborhood / Area | Why Host Here? (Target Guests & Appeal) | Key Attractions & Landmarks |
|---|---|---|
| Rodney | Rodney is a booming region just north of Auckland known for its stunning natural beauty, outdoor activities, and charming small towns. Its mix of coastal suburbs and rural landscapes offers a unique blend for tourists looking to escape the city while still being close to Auckland. | Matakana Village, Pakiri Beach, Tawharanui Regional Park, Snells Beach, Mahurangi Regional Park, Point Wells |
| Matakana | Matakana is a picturesque village famous for its Saturday farmers' market, boutique shops, and vineyards. It's a popular destination for weekend getaways, making it ideal for short-term rentals. | Matakana Village Farmers' Market, Brick Bay Sculpture Trail, Tawharanui Beach, Matakana Cinemas, Local wineries, Paradise Kitchen |
| Snells Beach | Snells Beach is a family-friendly coastal suburb known for its sandy beaches and calm waters. It's perfect for beach lovers and families looking for a relaxing escape just outside of Auckland. | Leigh Marine Reserve, Goat Island Marine Reserve |
| Warkworth | Warkworth is a charming town located near the Mahurangi River and is often seen as a gateway to the local regional parks and beaches. It's ideal for exploring the wider Rodney area and offers various dining and shopping options. | Mahurangi Regional Park, Warkworth Castle, The Snout, Woodhill Forest, Omaha Beach |
| Omaha Beach | Omaha Beach is a popular upscale beach destination known for its beautiful white sands and beach houses. Attracts affluent tourists and families seeking a luxurious beach experience. | Omaha Beach, Omaha Golf Club, Riverside Drive, Local cafes, Lockwood Reserve |
| Pakiri | Pakiri is famous for its stunning beach and is a popular spot for surfers and nature lovers. It's a quieter option for those wanting to experience the raw beauty of New Zealand's coastline. | Pakiri Beach, Pakiri Regional Park, Surf School, Horse riding on the beach, Wildlife spotting |
| Mangawhai Heads | Mangawhai Heads offers beautiful beaches and a laid-back lifestyle, making it a perfect location for holidaymakers. It's a favorite for Aucklanders wanting a weekend retreat. | Mangawhai Heads Beach, Mangawhai Scenic Walk, Mangawhai Estuary, Local markets, Dining spots at Mangawhai |
| Ti Point | Ti Point is a lesser-known coastal area that provides secluded beaches and stunning views. It's a great option for visitors looking for tranquility and natural beauty. | Ti Point Beach, Ti Point Marine Reserve, Local hiking trails, Scenic lookouts |
Understanding Airbnb License Requirements & STR Laws in Rodney (2026)
While Rodney, Auckland, New Zealand currently shows low STR regulations, specific Airbnb license requirements might still exist or change. Always verify the latest short term rental regulations and Airbnb license requirements directly with local government authorities for Rodney to ensure full compliance before hosting.
(Source: AirROI data, 2026, based on 0% licensed listings)
Top Performing Airbnb Properties in Rodney (2026)
Benchmark your potential! Explore examples of top-performing Airbnb properties in Rodneybased on Trailing Twelve Month (TTM) revenue. Analyze their characteristics, revenue, occupancy rate, and ADR to understand what drives success in this market.
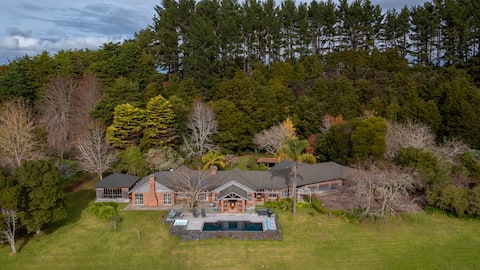
A place of serene beauty and luxurious comfort
Entire Place • 7 bedrooms

Omaha Beachfront
Entire Place • 4 bedrooms

Rata House Muriwai
Entire Place • 4 bedrooms

Matua Villa
Entire Place • 5 bedrooms
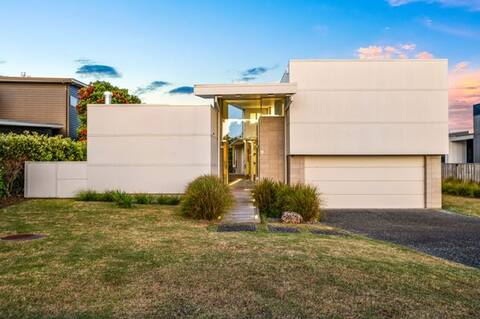
Architectural masterpiece, private beach access.
Entire Place • 6 bedrooms

Omaha Tropical Oasis-Beach & Boatramp
Entire Place • 3 bedrooms
Note: Performance varies based on location, size, amenities, seasonality, and management quality. Data reflects the past 12 months.
Top Performing Airbnb Hosts in Rodney (2026)
Learn from the best! This table showcases top-performing Airbnb hosts in Rodney based on the number of properties managed and estimated total revenue over the past year. Analyze their scale and performance metrics.
| Host Name | Properties | Grossing Revenue | Stay Reviews | Avg Rating |
|---|---|---|---|---|
| Jeanette | 8 | $167,982 | 194 | 4.85/5.0 |
| Alistair | 1 | $138,037 | 25 | 5.00/5.0 |
| Natalie & Bruce | 2 | $126,747 | 226 | 4.94/5.0 |
| Angus | 3 | $122,531 | 622 | 4.85/5.0 |
| Diane | 1 | $118,586 | 7 | 5.00/5.0 |
| Nick | 2 | $117,730 | 192 | 5.00/5.0 |
| Laurence | 5 | $114,668 | 206 | 4.86/5.0 |
| Richard | 2 | $113,850 | 15 | 5.00/5.0 |
| Bachcare | 21 | $110,644 | 201 | 4.59/5.0 |
| Penelope | 2 | $100,351 | 84 | 4.95/5.0 |
Analyzing the strategies of top hosts, such as their property selection, pricing, and guest communication, can offer valuable lessons for optimizing your own Airbnb operations in Rodney.
Dive Deeper: Advanced Rodney STR Market Data (2026)
Ready to unlock more insights? AirROI provides access to advanced metrics and comprehensive Airbnb data for Rodney. Explore detailed analytics beyond this report to refine your investment strategy, optimize pricing, and maximize your vacation rental profits.
Explore Advanced MetricsRodney Short-Term Rental Market Composition (2026): Property & Room Types
Room Type Distribution
Property Type Distribution
Market Composition Insights for Rodney
- The Rodney Airbnb market composition is heavily skewed towards Entire Home/Apt listings, which make up 89.2% of the 565 active rentals. This indicates strong guest preference for privacy and space.
- Looking at the property type distribution in Rodney, House properties are the most common (60.4%), reflecting the local real estate landscape.
- Houses represent a significant 60.4% portion, catering likely to families or larger groups.
- The presence of 13.6% Hotel/Boutique listings indicates integration with traditional hospitality.
- Smaller segments like unique stays (combined 2.1%) offer potential for unique stay experiences.
Rodney Airbnb Room Capacity Analysis (2026): Bedroom Distribution
Distribution of Listings by Number of Bedrooms
Room Capacity Insights for Rodney
- The dominant room capacity in Rodney is 1 bedroom listings, making up 32.4% of the market. This suggests a strong demand for properties suitable for couples or solo travelers.
- Together, 1 bedroom and 2 bedrooms properties represent 51.0% of the active Airbnb listings in Rodney, indicating a high concentration in these sizes.
- A significant 38.7% of listings offer 3+ bedrooms, catering to larger groups and families seeking more space in Rodney.
Rodney Vacation Rental Guest Capacity Trends (2026)
Distribution of Listings by Guest Capacity
Guest Capacity Insights for Rodney
- The most common guest capacity trend in Rodney vacation rentals is listings accommodating 2 guests (27.8%). This suggests the primary traveler segment is likely couples or solo travelers.
- Properties designed for 2 guests and 8+ guests dominate the Rodney STR market, accounting for 49.6% of listings.
- 37.2% of properties accommodate 6+ guests, serving the market segment for larger families or group travel in Rodney.
- On average, properties in Rodney are equipped to host 4.4 guests.
Rodney Airbnb Booking Patterns (2026): Available vs. Booked Days
Available Days Distribution
Booked Days Distribution
Booking Pattern Insights for Rodney
- The most common availability pattern in Rodney falls within the 271-366 days range, representing 59.1% of listings. This suggests many properties have significant open periods on their calendars.
- Approximately 87.1% of listings show high availability (181+ days open annually), indicating potential for increased bookings or specific owner usage patterns.
- For booked days, the 31-90 days range is most frequent in Rodney (35%), reflecting common guest stay durations or potential owner blocking patterns.
- A notable 13.3% of properties secure long booking periods (181+ days booked per year), highlighting successful long-term rental strategies or significant owner usage.
Rodney Airbnb Minimum Stay Requirements Analysis
Distribution of Listings by Minimum Night Requirement
1 Night
208 listings
36.8% of total
2 Nights
178 listings
31.5% of total
3 Nights
16 listings
2.8% of total
4-6 Nights
13 listings
2.3% of total
7-29 Nights
7 listings
1.2% of total
30+ Nights
143 listings
25.3% of total
Key Insights
- The most prevalent minimum stay requirement in Rodney is 1 Night, adopted by 36.8% of listings. This highlights the market's preference for shorter, flexible bookings.
- A strong majority (68.3%) of the Rodney Airbnb data shows acceptance of very short stays (1-2 nights), indicating a dynamic, high-turnover market.
- A significant segment (25.3%) caters to monthly stays (30+ nights) in Rodney, pointing to opportunities in the extended-stay market.
Recommendations
- Align with the market by considering a 1 Night minimum stay, as 36.8% of Rodney hosts use this setting.
- Explore offering discounts for stays of 30+ nights to attract the 25.3% of the market seeking extended stays.
- Adjust minimum nights based on seasonality – potentially shorter during low season and longer during peak demand periods in Rodney.
Rodney Airbnb Cancellation Policy Trends Analysis (2026)
Limited
18 listings
3.2% of total
Super Strict 60 Days
3 listings
0.5% of total
Flexible
144 listings
25.5% of total
Moderate
161 listings
28.5% of total
Firm
201 listings
35.6% of total
Strict
38 listings
6.7% of total
Cancellation Policy Insights for Rodney
- The prevailing Airbnb cancellation policy trend in Rodney is Firm, used by 35.6% of listings.
- There's a relatively balanced mix between guest-friendly (54.0%) and stricter (42.3%) policies, offering choices for different guest needs.
- Strict cancellation policies are quite rare (6.7%), potentially making listings with this policy less competitive unless justified by high demand or property type.
Recommendations for Hosts
- Consider adopting a Firm policy to align with the 35.6% market standard in Rodney.
- Using a Strict policy might deter some guests, as only 6.7% of listings use it. Evaluate if potential revenue protection outweighs possible lower booking rates.
- Regularly review your cancellation policy against competitors and market demand shifts in Rodney.
Rodney STR Booking Lead Time Analysis (2026)
Average Booking Lead Time by Month
Booking Lead Time Insights for Rodney
- The overall average booking lead time for vacation rentals in Rodney is 53 days.
- Guests book furthest in advance for stays during December (average 88 days), likely coinciding with peak travel demand or local events.
- The shortest booking windows occur for stays in June (average 27 days), indicating more last-minute travel plans during this time.
- Seasonally, Winter (74 days avg.) sees the longest lead times, while Summer (32 days avg.) has the shortest, reflecting typical travel planning cycles.
Recommendations for Hosts
- Use the overall average lead time (53 days) as a baseline for your pricing and availability strategy in Rodney.
- For December stays, consider implementing length-of-stay discounts or slightly higher rates for bookings made less than 88 days out to capitalize on advance planning.
- Target marketing efforts for the Winter season well in advance (at least 74 days) to capture early planners.
- Monitor your own booking lead times against these Rodney averages to identify opportunities for dynamic pricing adjustments.
Popular & Essential Airbnb Amenities in Rodney (2026)
Amenity Prevalence
Amenity Insights for Rodney
- Essential amenities in Rodney that guests expect include: Free parking on premises. Lacking these (this) could significantly impact bookings.
- Popular amenities like Wifi, Smoke alarm, Hot water are common but not universal. Offering these can provide a competitive edge.
- Warning: Wifi is not universally provided but is considered essential globally. Ensure reliable Wifi is offered.
Recommendations for Hosts
- Ensure your listing includes all essential amenities for Rodney: Free parking on premises.
- Prioritize adding missing essentials: Free parking on premises.
- Consider adding popular differentiators like Wifi or Smoke alarm to increase appeal.
- Highlight unique or less common amenities you offer (e.g., hot tub, dedicated workspace, EV charger) in your listing description and photos.
- Regularly check competitor amenities in Rodney to stay competitive.
Rodney Airbnb Guest Demographics & Profile Analysis (2026)
Guest Profile Summary for Rodney
- The typical guest profile for Airbnb in Rodney consists of primarily domestic travelers (74%), often arriving from nearby Auckland, typically belonging to the Post-2000s (Gen Z/Alpha) group (50%), primarily speaking English or French.
- Domestic travelers account for 73.9% of guests.
- Key international markets include New Zealand (73.9%) and Australia (7.1%).
- Top languages spoken are English (69%) followed by French (5.8%).
- A significant demographic segment is the Post-2000s (Gen Z/Alpha) group, representing 50% of guests.
Recommendations for Hosts
- Target domestic marketing efforts towards travelers from Auckland and Wellington.
- Tailor amenities and listing descriptions to appeal to the dominant Post-2000s (Gen Z/Alpha) demographic (e.g., highlight fast WiFi, smart home features, local guides).
- Highlight unique local experiences or amenities relevant to the primary guest profile.
- Consider seasonal promotions aligned with peak travel times for key origin markets.
Nearby Short-Term Rental Market Comparison
How does the Rodney Airbnb market stack up against its neighbors? Compare key performance metrics like average monthly revenue, ADR, and occupancy rates in surrounding areas to understand the broader regional STR landscape.
| Market | Active Properties | Monthly Revenue | Daily Rate | Avg. Occupancy |
|---|---|---|---|---|
| Hot Water Beach | 27 | $2,949 | $257.55 | 50% |
| Whananaki | 14 | $2,368 | $364.38 | 36% |
| Waiheke | 580 | $2,274 | $338.47 | 32% |
| Hahei | 104 | $2,241 | $260.25 | 39% |
| Opito Bay | 16 | $1,911 | $294.47 | 29% |
| Karapiro | 40 | $1,865 | $206.22 | 37% |
| Waitematā | 1,525 | $1,702 | $146.61 | 50% |
| Rukuhia | 10 | $1,675 | $216.31 | 33% |
| Tamahere | 76 | $1,665 | $198.77 | 39% |
| Tutukaka | 44 | $1,659 | $203.24 | 36% |