Maungakiekie-Tāmaki Airbnb Market Analysis 2026: Short Term Rental Data & Vacation Rental Statistics in Auckland, New Zealand
Is Airbnb profitable in Maungakiekie-Tāmaki in 2026? Explore comprehensive Airbnb analytics for Maungakiekie-Tāmaki, Auckland, New Zealand to uncover income potential. This 2026 STR market report for Maungakiekie-Tāmaki, based on AirROI data from February 2025 to January 2026, reveals key trends in the niche market of 156 active listings.
Whether you're considering an Airbnb investment in Maungakiekie-Tāmaki, optimizing your existing vacation rental, or exploring rental arbitrage opportunities, understanding the Maungakiekie-Tāmaki Airbnb data is crucial. Leveraging the low regulation environment is key to maximizing your short term rental income potential. Let's dive into the specifics.
Key Maungakiekie-Tāmaki Airbnb Performance Metrics Overview
Monthly Airbnb Revenue Variations & Income Potential in Maungakiekie-Tāmaki (2026)
Understanding the monthly revenue variations for Airbnb listings in Maungakiekie-Tāmaki is key to maximizing your short term rental income potential. Seasonality significantly impacts earnings. Our analysis, based on data from the past 12 months, shows that the peak revenue month for STRs in Maungakiekie-Tāmaki is typically December, while June often presents the lowest earnings, highlighting opportunities for strategic pricing adjustments during shoulder and low seasons. Explore the typical Airbnb income in Maungakiekie-Tāmaki across different performance tiers:
- Best-in-class properties (Top 10%) achieve $3,492+ monthly, often utilizing dynamic pricing and superior guest experiences.
- Strong performing properties (Top 25%) earn $2,171 or more, indicating effective management and desirable locations/amenities.
- Typical properties (Median) generate around $1,167 per month, representing the average market performance.
- Entry-level properties (Bottom 25%) see earnings around $550, often with potential for optimization.
Average Monthly Airbnb Earnings Trend in Maungakiekie-Tāmaki
Maungakiekie-Tāmaki Airbnb Occupancy Rate Trends (2026)
Maximize your bookings by understanding the Maungakiekie-Tāmaki STR occupancy trends. Seasonal demand shifts significantly influence how often properties are booked. Typically, Februarysees the highest demand (peak season occupancy), while June experiences the lowest (low season). Effective strategies, like adjusting minimum stays or offering promotions, can boost occupancy during slower periods. Here's how different property tiers perform in Maungakiekie-Tāmaki:
- Best-in-class properties (Top 10%) achieve 85%+ occupancy, indicating high desirability and potentially optimized availability.
- Strong performing properties (Top 25%) maintain 70% or higher occupancy, suggesting good market fit and guest satisfaction.
- Typical properties (Median) have an occupancy rate around 47%.
- Entry-level properties (Bottom 25%) average 24% occupancy, potentially facing higher vacancy.
Average Monthly Occupancy Rate Trend in Maungakiekie-Tāmaki
Average Daily Rate (ADR) Airbnb Trends in Maungakiekie-Tāmaki (2026)
Effective short term rental pricing strategy in Maungakiekie-Tāmaki involves understanding monthly ADR fluctuations. The Average Daily Rate (ADR) for Airbnb in Maungakiekie-Tāmaki typically peaks in January and dips lowest during April. Leveraging Airbnb dynamic pricing tools or strategies based on this seasonality can significantly boost revenue. Here's a look at the typical nightly rates achieved:
- Best-in-class properties (Top 10%) command rates of $211+ per night, often due to premium features or locations.
- Strong performing properties (Top 25%) achieve nightly rates of $142 or more.
- Typical properties (Median) charge around $80 per night.
- Entry-level properties (Bottom 25%) earn around $50 per night.
Average Daily Rate (ADR) Trend by Month in Maungakiekie-Tāmaki
Get Live Maungakiekie-Tāmaki Market Intelligence 👇

Explore Real-time Analytics
Airbnb Seasonality Analysis & Trends in Maungakiekie-Tāmaki (2026)
Peak Season (December, February, March)
- Revenue averages $1,842 per month
- Occupancy rates average 56.1%
- Daily rates average $108
Shoulder Season
- Revenue averages $1,612 per month
- Occupancy maintains around 46.6%
- Daily rates hold near $109
Low Season (April, May, June)
- Revenue drops to average $1,304 per month
- Occupancy decreases to average 42.1%
- Daily rates adjust to average $105
Seasonality Insights for Maungakiekie-Tāmaki
- The Airbnb seasonality in Maungakiekie-Tāmaki shows moderate seasonality with distinct peak and low periods. While the sections above show seasonal averages, it's also insightful to look at the extremes:
- During the high season, the absolute peak month showcases Maungakiekie-Tāmaki's highest earning potential, with monthly revenues capable of climbing to $1,915, occupancy reaching a high of 58.7%, and ADRs peaking at $112.
- Conversely, the slowest single month of the year, typically falling within the low season, marks the market's lowest point. In this month, revenue might dip to $1,166, occupancy could drop to 37.1%, and ADRs may adjust down to $103.
- Understanding both the seasonal averages and these monthly peaks and troughs in revenue, occupancy, and ADR is crucial for maximizing your Airbnb profit potential in Maungakiekie-Tāmaki.
Seasonal Strategies for Maximizing Profit
- Peak Season: Maximize revenue through premium pricing and potentially longer minimum stays. Ensure high availability.
- Low Season: Offer competitive pricing, special promotions (e.g., extended stay discounts), and flexible cancellation policies. Target off-season travelers like remote workers or budget-conscious guests.
- Shoulder Seasons: Implement dynamic pricing that balances peak and low rates. Target weekend travelers or specific events. Offer slightly more flexible terms than peak season.
- Regularly analyze your own performance against these Maungakiekie-Tāmaki seasonality benchmarks and adjust your pricing and availability strategy accordingly.
Best Areas for Airbnb Investment in Maungakiekie-Tāmaki (2026)
Exploring the top neighborhoods for short-term rentals in Maungakiekie-Tāmaki? This section highlights key areas, outlining why they are attractive for hosts and guests, along with notable local attractions. Consider these locations based on your target guest profile and investment strategy.
| Neighborhood / Area | Why Host Here? (Target Guests & Appeal) | Key Attractions & Landmarks |
|---|---|---|
| Glen Innes | A vibrant suburb known for its diverse community and affordability. Close to amenities with good transport links, making it attractive for families and budget-conscious travelers. | Glen Innes Town Centre, Bates Trust Park, Tāmaki Estuary, Stonefields, Lynfield Cove |
| Panmure | A well-connected suburb with shopping facilities, parks, and recreational areas. Its proximity to the waterfront and public transport makes it a prime location for both short-term stays and long-term rentals. | Panmure Basin, ASB Stadium, Auckland War Memorial Museum, Taumanu Reserve, Mt Wellington |
| Mt Wellington | Home to the iconic Maungawhau/Mt Eden, this area attracts outdoor enthusiasts and families. Its central location in Auckland makes it easy to access surrounding areas and city attractions. | Maungawhau/Mt Eden, Sylvia Park, Mt Wellington Domain, Auckland Botanical Gardens, Lagoon Drive Park |
| One Tree Hill | A well-known suburb featuring the iconic One Tree Hill and a range of parks and green spaces. Ideal for travelers looking for natural surroundings with city accessibility. | One Tree Hill, Cornwall Park, Epsom Park, Auckland Stardome, EcoMatters Environment Trust |
| Ellerslie | A charming suburb with a quaint village feel, popular among locals and visitors alike. Known for its beautiful park and proximity to various city amenities. | Ellerslie Racecourse, Waikaraka Park, Ellerslie Village, Mt Wellington, Sylvia Park |
| Stonefields | A modern and up-and-coming neighborhood with new developments and parks. Its community feel and accessibility to public transport make it attractive for young professionals. | Stonefields Marketplace, Lunn Avenue, Waiatarua Reserve, Hihimalaya Park, Clyde Street Reserve |
| Tamaki | A suburban area with rich Māori history and community-driven initiatives. Offers both cultural experiences and convenient transport links to the city. | Tamaki River, Te Tāmaki Museum, Tamaki Community Centre, Waiata Reserve, Leisure Centre |
| St Heliers | A coastal suburb that is popular for its beach and waterfront views. Attracts tourists looking for relaxation by the sea and easy access to city attractions. | St Heliers Beach, Glover Park, Murray's Bay, Blockhouse Bay, Waitamata Harbour |
Understanding Airbnb License Requirements & STR Laws in Maungakiekie-Tāmaki (2026)
While Maungakiekie-Tāmaki, Auckland, New Zealand currently shows low STR regulations, specific Airbnb license requirements might still exist or change. Always verify the latest short term rental regulations and Airbnb license requirements directly with local government authorities for Maungakiekie-Tāmaki to ensure full compliance before hosting.
(Source: AirROI data, 2026, finding no licensed listings among those analyzed)
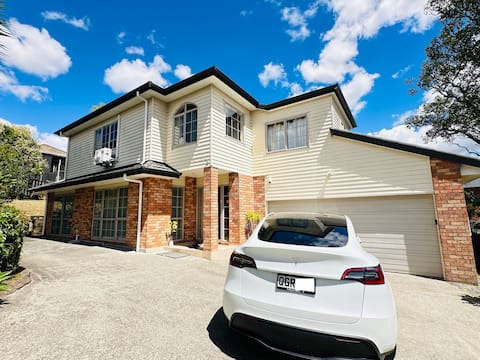
Top Performing Airbnb Properties in Maungakiekie-Tāmaki (2026)
Benchmark your potential! Explore examples of top-performing Airbnb properties in Maungakiekie-Tāmakibased on Trailing Twelve Month (TTM) revenue. Analyze their characteristics, revenue, occupancy rate, and ADR to understand what drives success in this market.

Relaxing family paradise with outdoor heated pool
Entire Place • 3 bedrooms

Waterfront villa near IKEA and Sylvia Park
Entire Place • 7 bedrooms

Auckland City & AIRPORT Near Sylvia park mall
Entire Place • 4 bedrooms

6 Min to Beach, Newly Built Family Haven
Entire Place • 4 bedrooms
Rest in Auckland City, Sylvia Park New Zealand
Entire Place • 4 bedrooms

One Tree Hill Modern 4 Bdrm house! New Luxury Mid-Mountain Villa in One Tree Hill, Central District
Entire Place • 4 bedrooms
Note: Performance varies based on location, size, amenities, seasonality, and management quality. Data reflects the past 12 months.
Top Performing Airbnb Hosts in Maungakiekie-Tāmaki (2026)
Learn from the best! This table showcases top-performing Airbnb hosts in Maungakiekie-Tāmaki based on the number of properties managed and estimated total revenue over the past year. Analyze their scale and performance metrics.
| Host Name | Properties | Grossing Revenue | Stay Reviews | Avg Rating |
|---|---|---|---|---|
| Sam | 3 | $154,657 | 297 | 4.49/5.0 |
| Johnny | 9 | $140,349 | 644 | 4.89/5.0 |
| Lisa | 1 | $89,296 | 44 | 5.00/5.0 |
| Team EJ | 2 | $79,408 | 85 | 4.61/5.0 |
| Urban Stays New Zealand | 3 | $57,901 | 109 | 4.79/5.0 |
| Hostech Limited | 1 | $56,911 | 64 | 4.86/5.0 |
| Sky | 1 | $56,077 | 56 | 4.80/5.0 |
| Sam | 1 | $47,435 | 240 | 4.79/5.0 |
| Jesselyn | 1 | $44,442 | 34 | 4.85/5.0 |
| Kiwi Nest | 3 | $42,205 | 48 | 4.77/5.0 |
Analyzing the strategies of top hosts, such as their property selection, pricing, and guest communication, can offer valuable lessons for optimizing your own Airbnb operations in Maungakiekie-Tāmaki.
Dive Deeper: Advanced Maungakiekie-Tāmaki STR Market Data (2026)
Ready to unlock more insights? AirROI provides access to advanced metrics and comprehensive Airbnb data for Maungakiekie-Tāmaki. Explore detailed analytics beyond this report to refine your investment strategy, optimize pricing, and maximize your vacation rental profits.
Explore Advanced MetricsMaungakiekie-Tāmaki Short-Term Rental Market Composition (2026): Property & Room Types
Room Type Distribution
Property Type Distribution
Market Composition Insights for Maungakiekie-Tāmaki
- The Maungakiekie-Tāmaki Airbnb market composition is heavily skewed towards Entire Home/Apt listings, which make up 64.7% of the 156 active rentals. This indicates strong guest preference for privacy and space.
- However, a notable 35.3% share for Private Rooms suggests opportunities for budget-conscious travelers or hosts renting out spare rooms.
- Looking at the property type distribution in Maungakiekie-Tāmaki, House properties are the most common (66%), reflecting the local real estate landscape.
- Houses represent a significant 66% portion, catering likely to families or larger groups.
- The presence of 6.4% Hotel/Boutique listings indicates integration with traditional hospitality.
Maungakiekie-Tāmaki Airbnb Room Capacity Analysis (2026): Bedroom Distribution
Distribution of Listings by Number of Bedrooms
Room Capacity Insights for Maungakiekie-Tāmaki
- The dominant room capacity in Maungakiekie-Tāmaki is 2 bedrooms listings, making up 22.4% of the market. This suggests a strong demand for properties suitable for couples or solo travelers.
- Together, 2 bedrooms and 1 bedroom properties represent 44.2% of the active Airbnb listings in Maungakiekie-Tāmaki, indicating a high concentration in these sizes.
Maungakiekie-Tāmaki Vacation Rental Guest Capacity Trends (2026)
Distribution of Listings by Guest Capacity
Guest Capacity Insights for Maungakiekie-Tāmaki
- The most common guest capacity trend in Maungakiekie-Tāmaki vacation rentals is listings accommodating 4 guests (17.9%). This suggests the primary traveler segment is likely small families or groups.
- Properties designed for 4 guests and 2 guests dominate the Maungakiekie-Tāmaki STR market, accounting for 35.2% of listings.
- 18.0% of properties accommodate 6+ guests, serving the market segment for larger families or group travel in Maungakiekie-Tāmaki.
- On average, properties in Maungakiekie-Tāmaki are equipped to host 2.8 guests.
Maungakiekie-Tāmaki Airbnb Booking Patterns (2026): Available vs. Booked Days
Available Days Distribution
Booked Days Distribution
Booking Pattern Insights for Maungakiekie-Tāmaki
- The most common availability pattern in Maungakiekie-Tāmaki falls within the 271-366 days range, representing 38.5% of listings. This suggests many properties have significant open periods on their calendars.
- Approximately 66.7% of listings show high availability (181+ days open annually), indicating potential for increased bookings or specific owner usage patterns.
- For booked days, the 91-180 days range is most frequent in Maungakiekie-Tāmaki (30.1%), reflecting common guest stay durations or potential owner blocking patterns.
- A notable 33.9% of properties secure long booking periods (181+ days booked per year), highlighting successful long-term rental strategies or significant owner usage.
Maungakiekie-Tāmaki Airbnb Minimum Stay Requirements Analysis
Distribution of Listings by Minimum Night Requirement
1 Night
51 listings
32.7% of total
2 Nights
37 listings
23.7% of total
3 Nights
4 listings
2.6% of total
4-6 Nights
10 listings
6.4% of total
7-29 Nights
6 listings
3.8% of total
30+ Nights
48 listings
30.8% of total
Key Insights
- The most prevalent minimum stay requirement in Maungakiekie-Tāmaki is 1 Night, adopted by 32.7% of listings. This highlights the market's preference for shorter, flexible bookings.
- A significant segment (30.8%) caters to monthly stays (30+ nights) in Maungakiekie-Tāmaki, pointing to opportunities in the extended-stay market.
Recommendations
- Align with the market by considering a 1 Night minimum stay, as 32.7% of Maungakiekie-Tāmaki hosts use this setting.
- Explore offering discounts for stays of 30+ nights to attract the 30.8% of the market seeking extended stays.
- Adjust minimum nights based on seasonality – potentially shorter during low season and longer during peak demand periods in Maungakiekie-Tāmaki.
Maungakiekie-Tāmaki Airbnb Cancellation Policy Trends Analysis (2026)
Super Strict 30 Days
1 listings
0.6% of total
Super Strict 60 Days
1 listings
0.6% of total
Flexible
34 listings
21.9% of total
Moderate
59 listings
38.1% of total
Firm
52 listings
33.5% of total
Strict
8 listings
5.2% of total
Cancellation Policy Insights for Maungakiekie-Tāmaki
- The prevailing Airbnb cancellation policy trend in Maungakiekie-Tāmaki is Moderate, used by 38.1% of listings.
- There's a relatively balanced mix between guest-friendly (60.0%) and stricter (38.7%) policies, offering choices for different guest needs.
- Strict cancellation policies are quite rare (5.2%), potentially making listings with this policy less competitive unless justified by high demand or property type.
Recommendations for Hosts
- Consider adopting a Moderate policy to align with the 38.1% market standard in Maungakiekie-Tāmaki.
- Using a Strict policy might deter some guests, as only 5.2% of listings use it. Evaluate if potential revenue protection outweighs possible lower booking rates.
- Regularly review your cancellation policy against competitors and market demand shifts in Maungakiekie-Tāmaki.
Maungakiekie-Tāmaki STR Booking Lead Time Analysis (2026)
Average Booking Lead Time by Month
Booking Lead Time Insights for Maungakiekie-Tāmaki
- The overall average booking lead time for vacation rentals in Maungakiekie-Tāmaki is 43 days.
- Guests book furthest in advance for stays during January (average 81 days), likely coinciding with peak travel demand or local events.
- The shortest booking windows occur for stays in May (average 27 days), indicating more last-minute travel plans during this time.
- Seasonally, Winter (55 days avg.) sees the longest lead times, while Spring (31 days avg.) has the shortest, reflecting typical travel planning cycles.
Recommendations for Hosts
- Use the overall average lead time (43 days) as a baseline for your pricing and availability strategy in Maungakiekie-Tāmaki.
- For January stays, consider implementing length-of-stay discounts or slightly higher rates for bookings made less than 81 days out to capitalize on advance planning.
- Target marketing efforts for the Winter season well in advance (at least 55 days) to capture early planners.
- Monitor your own booking lead times against these Maungakiekie-Tāmaki averages to identify opportunities for dynamic pricing adjustments.
Popular & Essential Airbnb Amenities in Maungakiekie-Tāmaki (2026)
Amenity Prevalence
Amenity Insights for Maungakiekie-Tāmaki
- Essential amenities in Maungakiekie-Tāmaki that guests expect include: Wifi, Smoke alarm. Lacking these (any) could significantly impact bookings.
- Popular amenities like Hot water, Dishes and silverware, Bed linens are common but not universal. Offering these can provide a competitive edge.
Recommendations for Hosts
- Ensure your listing includes all essential amenities for Maungakiekie-Tāmaki: Wifi, Smoke alarm.
- Prioritize adding missing essentials: Smoke alarm.
- Consider adding popular differentiators like Hot water or Dishes and silverware to increase appeal.
- Highlight unique or less common amenities you offer (e.g., hot tub, dedicated workspace, EV charger) in your listing description and photos.
- Regularly check competitor amenities in Maungakiekie-Tāmaki to stay competitive.
Maungakiekie-Tāmaki Airbnb Guest Demographics & Profile Analysis (2026)
Guest Profile Summary for Maungakiekie-Tāmaki
- The typical guest profile for Airbnb in Maungakiekie-Tāmaki consists of a mix of domestic (55%) and international guests, often arriving from nearby Auckland, typically belonging to the Post-2000s (Gen Z/Alpha) group (50%), primarily speaking English or Chinese.
- Domestic travelers account for 55.4% of guests.
- Key international markets include New Zealand (55.4%) and Australia (11.7%).
- Top languages spoken are English (60.7%) followed by Chinese (8.5%).
- A significant demographic segment is the Post-2000s (Gen Z/Alpha) group, representing 50% of guests.
Recommendations for Hosts
- Balance marketing efforts between domestic and international channels based on the guest mix.
- Tailor amenities and listing descriptions to appeal to the dominant Post-2000s (Gen Z/Alpha) demographic (e.g., highlight fast WiFi, smart home features, local guides).
- Highlight unique local experiences or amenities relevant to the primary guest profile.
- Consider seasonal promotions aligned with peak travel times for key origin markets.
Nearby Short-Term Rental Market Comparison
How does the Maungakiekie-Tāmaki Airbnb market stack up against its neighbors? Compare key performance metrics like average monthly revenue, ADR, and occupancy rates in surrounding areas to understand the broader regional STR landscape.
| Market | Active Properties | Monthly Revenue | Daily Rate | Avg. Occupancy |
|---|---|---|---|---|
| Hot Water Beach | 27 | $2,949 | $257.55 | 50% |
| Whananaki | 14 | $2,368 | $364.38 | 36% |
| Waiheke | 580 | $2,274 | $338.47 | 32% |
| Hahei | 104 | $2,241 | $260.25 | 39% |
| Opito Bay | 16 | $1,911 | $294.47 | 29% |
| Karapiro | 40 | $1,865 | $206.22 | 37% |
| Waitematā | 1,525 | $1,702 | $146.61 | 50% |
| Rukuhia | 10 | $1,675 | $216.31 | 33% |
| Tamahere | 76 | $1,665 | $198.77 | 39% |
| Tutukaka | 44 | $1,659 | $203.24 | 36% |