San Crisanto Airbnb Market Analysis 2026: Short Term Rental Data & Vacation Rental Statistics in Yucatán, Mexico
Is Airbnb profitable in San Crisanto in 2026? Explore comprehensive Airbnb analytics for San Crisanto, Yucatán, Mexico to uncover income potential. This 2026 STR market report for San Crisanto, based on AirROI data from February 2025 to January 2026, reveals key trends in the niche market of 38 active listings.
Whether you're considering an Airbnb investment in San Crisanto, optimizing your existing vacation rental, or exploring rental arbitrage opportunities, understanding the San Crisanto Airbnb data is crucial. Leveraging the low regulation environment is key to maximizing your short term rental income potential. Let's dive into the specifics.
Key San Crisanto Airbnb Performance Metrics Overview
Monthly Airbnb Revenue Variations & Income Potential in San Crisanto (2026)
Understanding the monthly revenue variations for Airbnb listings in San Crisanto is key to maximizing your short term rental income potential. Seasonality significantly impacts earnings. Our analysis, based on data from the past 12 months, shows that the peak revenue month for STRs in San Crisanto is typically April, while September often presents the lowest earnings, highlighting opportunities for strategic pricing adjustments during shoulder and low seasons. Explore the typical Airbnb income in San Crisanto across different performance tiers:
- Best-in-class properties (Top 10%) achieve $3,133+ monthly, often utilizing dynamic pricing and superior guest experiences.
- Strong performing properties (Top 25%) earn $1,958 or more, indicating effective management and desirable locations/amenities.
- Typical properties (Median) generate around $965 per month, representing the average market performance.
- Entry-level properties (Bottom 25%) see earnings around $377, often with potential for optimization.
Average Monthly Airbnb Earnings Trend in San Crisanto
San Crisanto Airbnb Occupancy Rate Trends (2026)
Maximize your bookings by understanding the San Crisanto STR occupancy trends. Seasonal demand shifts significantly influence how often properties are booked. Typically, Aprilsees the highest demand (peak season occupancy), while November experiences the lowest (low season). Effective strategies, like adjusting minimum stays or offering promotions, can boost occupancy during slower periods. Here's how different property tiers perform in San Crisanto:
- Best-in-class properties (Top 10%) achieve 60%+ occupancy, indicating high desirability and potentially optimized availability.
- Strong performing properties (Top 25%) maintain 40% or higher occupancy, suggesting good market fit and guest satisfaction.
- Typical properties (Median) have an occupancy rate around 23%.
- Entry-level properties (Bottom 25%) average 11% occupancy, potentially facing higher vacancy.
Average Monthly Occupancy Rate Trend in San Crisanto
Average Daily Rate (ADR) Airbnb Trends in San Crisanto (2026)
Effective short term rental pricing strategy in San Crisanto involves understanding monthly ADR fluctuations. The Average Daily Rate (ADR) for Airbnb in San Crisanto typically peaks in August and dips lowest during September. Leveraging Airbnb dynamic pricing tools or strategies based on this seasonality can significantly boost revenue. Here's a look at the typical nightly rates achieved:
- Best-in-class properties (Top 10%) command rates of $266+ per night, often due to premium features or locations.
- Strong performing properties (Top 25%) achieve nightly rates of $182 or more.
- Typical properties (Median) charge around $116 per night.
- Entry-level properties (Bottom 25%) earn around $90 per night.
Average Daily Rate (ADR) Trend by Month in San Crisanto
Get Live San Crisanto Market Intelligence 👇
Explore Real-time Analytics
Airbnb Seasonality Analysis & Trends in San Crisanto (2026)
Peak Season (April, March, July)
- Revenue averages $2,265 per month
- Occupancy rates average 46.3%
- Daily rates average $159
Shoulder Season
- Revenue averages $1,349 per month
- Occupancy maintains around 26.2%
- Daily rates hold near $156
Low Season (January, September, November)
- Revenue drops to average $878 per month
- Occupancy decreases to average 16.3%
- Daily rates adjust to average $146
Seasonality Insights for San Crisanto
- The Airbnb seasonality in San Crisanto shows highly seasonal trends requiring careful strategy. While the sections above show seasonal averages, it's also insightful to look at the extremes:
- During the high season, the absolute peak month showcases San Crisanto's highest earning potential, with monthly revenues capable of climbing to $2,401, occupancy reaching a high of 53.4%, and ADRs peaking at $166.
- Conversely, the slowest single month of the year, typically falling within the low season, marks the market's lowest point. In this month, revenue might dip to $762, occupancy could drop to 14.2%, and ADRs may adjust down to $141.
- Understanding both the seasonal averages and these monthly peaks and troughs in revenue, occupancy, and ADR is crucial for maximizing your Airbnb profit potential in San Crisanto.
Seasonal Strategies for Maximizing Profit
- Peak Season: Maximize revenue through premium pricing and potentially longer minimum stays. Ensure high availability.
- Low Season: Offer competitive pricing, special promotions (e.g., extended stay discounts), and flexible cancellation policies. Target off-season travelers like remote workers or budget-conscious guests.
- Shoulder Seasons: Implement dynamic pricing that balances peak and low rates. Target weekend travelers or specific events. Offer slightly more flexible terms than peak season.
- Regularly analyze your own performance against these San Crisanto seasonality benchmarks and adjust your pricing and availability strategy accordingly.
Best Areas for Airbnb Investment in San Crisanto (2026)
Exploring the top neighborhoods for short-term rentals in San Crisanto? This section highlights key areas, outlining why they are attractive for hosts and guests, along with notable local attractions. Consider these locations based on your target guest profile and investment strategy.
| Neighborhood / Area | Why Host Here? (Target Guests & Appeal) | Key Attractions & Landmarks |
|---|---|---|
| Playa San Crisanto | Beautiful beach with calm waters ideal for relaxation and water sports. Attracts families and couples looking for a serene getaway. | Beachfront activities, Sea turtle sanctuary, Local restaurants, Fishing spots, Boat tours |
| Centro San Crisanto | Charming town center with local markets and cultural experiences. Great for travelers interested in authentic Yucatecan culture and local cuisine. | Local market, Historical architecture, Yucatecan cuisine, Cultural festivals |
| Laguna de los Rieles | Scenic lagoon area offering eco-tourism and nature activities. Perfect for nature lovers and those seeking peace and tranquility. | Kayaking, Birdwatching, Nature trails |
| Cenote San Crisanto | Unique natural swimming hole surrounded by beautiful scenery. A popular spot for day trips and relaxation in nature. | Cenote swimming, Picnic areas, Nature walks |
| Celestún | Nearby coastal area known for wildlife reserves and beautiful beaches. Offers opportunities for eco-tours and exploring local flora and fauna. | Celestún Biosphere Reserve, Flamingo watching, Beaches |
| El Cuyo | Quaint fishing village known for its beautiful beaches and laid-back atmosphere. Attracts those who want to escape the crowds and enjoy nature. | Fishing, Beach relaxation, Local seafood |
| Ría Lagartos | Famous for its breathtaking landscapes and wildlife, including flamingos. An excellent choice for eco-tourists and photographers. | Flamingo watching, Boat tours, Wildlife photography |
| Las Coloradas | Picturesque area known for its striking pink lakes. An Instagram-worthy spot that attracts tourists seeking unique experiences. | Pink lagoons, Photography opportunities, Local tours |
Understanding Airbnb License Requirements & STR Laws in San Crisanto (2026)
While San Crisanto, Yucatán, Mexico currently shows low STR regulations, specific Airbnb license requirements might still exist or change. Always verify the latest short term rental regulations and Airbnb license requirements directly with local government authorities for San Crisanto to ensure full compliance before hosting.
(Source: AirROI data, 2026, finding no licensed listings among those analyzed)
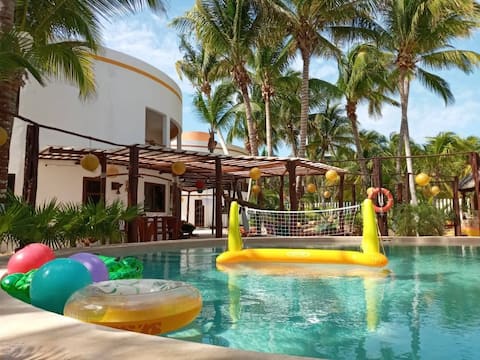
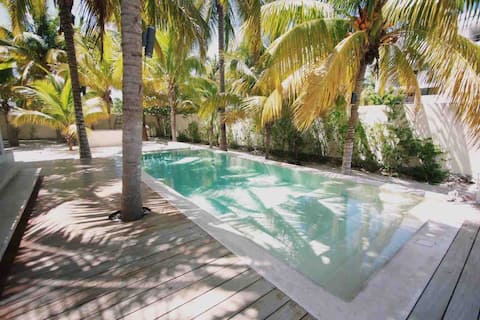
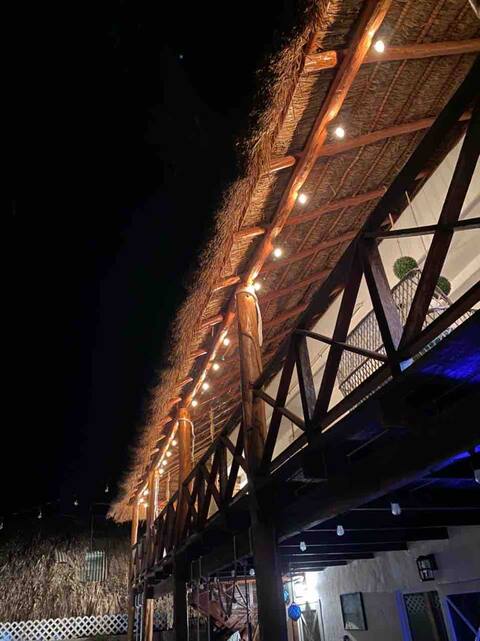
Top Performing Airbnb Properties in San Crisanto (2026)
Benchmark your potential! Explore examples of top-performing Airbnb properties in San Crisantobased on Trailing Twelve Month (TTM) revenue. Analyze their characteristics, revenue, occupancy rate, and ADR to understand what drives success in this market.

Unique Beachfront Casa Kyma, Pool, Yucatan
Entire Place • 3 bedrooms
Villa Tortugas Playa Patuxka, a paradise in Yucatan
Entire Place • 3 bedrooms
Beach House Romanitos
Entire Place • 3 bedrooms

San Crisanto Beachfront Villa with Private Pool
Entire Place • 3 bedrooms

Cocal Callona, beach house facing the sea
Entire Place • 3 bedrooms
Casa Paya
Entire Place • 3 bedrooms
Note: Performance varies based on location, size, amenities, seasonality, and management quality. Data reflects the past 12 months.
Top Performing Airbnb Hosts in San Crisanto (2026)
Learn from the best! This table showcases top-performing Airbnb hosts in San Crisanto based on the number of properties managed and estimated total revenue over the past year. Analyze their scale and performance metrics.
| Host Name | Properties | Grossing Revenue | Stay Reviews | Avg Rating |
|---|---|---|---|---|
| Dovile Dio | 1 | $93,204 | 37 | 5.00/5.0 |
| Jose | 5 | $79,986 | 100 | 4.95/5.0 |
| Eduardo José | 2 | $38,399 | 24 | 4.88/5.0 |
| Salvador | 1 | $32,132 | 99 | 4.96/5.0 |
| Irak Abraham | 1 | $30,914 | 91 | 4.47/5.0 |
| Vicente Ariel | 1 | $27,372 | 16 | 4.94/5.0 |
| Rodrigo | 1 | $25,354 | 55 | 4.69/5.0 |
| Esteban | 1 | $19,607 | 47 | 4.94/5.0 |
| Carlos Adrian | 1 | $17,877 | 7 | 5.00/5.0 |
| Hector | 1 | $15,343 | 106 | 4.87/5.0 |
Analyzing the strategies of top hosts, such as their property selection, pricing, and guest communication, can offer valuable lessons for optimizing your own Airbnb operations in San Crisanto.
Dive Deeper: Advanced San Crisanto STR Market Data (2026)
Ready to unlock more insights? AirROI provides access to advanced metrics and comprehensive Airbnb data for San Crisanto. Explore detailed analytics beyond this report to refine your investment strategy, optimize pricing, and maximize your vacation rental profits.
Explore Advanced MetricsSan Crisanto Short-Term Rental Market Composition (2026): Property & Room Types
Room Type Distribution
Property Type Distribution
Market Composition Insights for San Crisanto
- The San Crisanto Airbnb market composition is heavily skewed towards Entire Home/Apt listings, which make up 94.7% of the 38 active rentals. This indicates strong guest preference for privacy and space.
- Looking at the property type distribution in San Crisanto, House properties are the most common (78.9%), reflecting the local real estate landscape.
- Houses represent a significant 78.9% portion, catering likely to families or larger groups.
- Smaller segments like hotel/boutique (combined 2.6%) offer potential for unique stay experiences.
San Crisanto Airbnb Room Capacity Analysis (2026): Bedroom Distribution
Distribution of Listings by Number of Bedrooms
Room Capacity Insights for San Crisanto
- The dominant room capacity in San Crisanto is 3 bedrooms listings, making up 39.5% of the market. This suggests a strong demand for properties suitable for families or small groups.
- Together, 3 bedrooms and 1 bedroom properties represent 65.8% of the active Airbnb listings in San Crisanto, indicating a high concentration in these sizes.
- A significant 42.1% of listings offer 3+ bedrooms, catering to larger groups and families seeking more space in San Crisanto.
San Crisanto Vacation Rental Guest Capacity Trends (2026)
Distribution of Listings by Guest Capacity
Guest Capacity Insights for San Crisanto
- The most common guest capacity trend in San Crisanto vacation rentals is listings accommodating 8+ guests (36.8%). This suggests the primary traveler segment is likely larger groups.
- Properties designed for 8+ guests and 6 guests dominate the San Crisanto STR market, accounting for 65.7% of listings.
- 76.2% of properties accommodate 6+ guests, serving the market segment for larger families or group travel in San Crisanto.
- On average, properties in San Crisanto are equipped to host 6.2 guests.
San Crisanto Airbnb Booking Patterns (2026): Available vs. Booked Days
Available Days Distribution
Booked Days Distribution
Booking Pattern Insights for San Crisanto
- The most common availability pattern in San Crisanto falls within the 271-366 days range, representing 68.4% of listings. This suggests many properties have significant open periods on their calendars.
- Approximately 94.7% of listings show high availability (181+ days open annually), indicating potential for increased bookings or specific owner usage patterns.
- For booked days, the 31-90 days range is most frequent in San Crisanto (39.5%), reflecting common guest stay durations or potential owner blocking patterns.
- A notable 5.3% of properties secure long booking periods (181+ days booked per year), highlighting successful long-term rental strategies or significant owner usage.
San Crisanto Airbnb Minimum Stay Requirements Analysis
Distribution of Listings by Minimum Night Requirement
1 Night
4 listings
10.5% of total
2 Nights
16 listings
42.1% of total
3 Nights
4 listings
10.5% of total
4-6 Nights
1 listings
2.6% of total
30+ Nights
13 listings
34.2% of total
Key Insights
- The most prevalent minimum stay requirement in San Crisanto is 2 Nights, adopted by 42.1% of listings. This highlights the market's preference for shorter, flexible bookings.
- A significant segment (34.2%) caters to monthly stays (30+ nights) in San Crisanto, pointing to opportunities in the extended-stay market.
Recommendations
- Align with the market by considering a 2 Nights minimum stay, as 42.1% of San Crisanto hosts use this setting.
- If feasible, allowing 1-night stays, especially midweek or during low season, could capture last-minute bookings, as only 10.5% currently do.
- A 2-night minimum appears standard (42.1%). Consider this for weekends or peak periods.
- Explore offering discounts for stays of 30+ nights to attract the 34.2% of the market seeking extended stays.
- Adjust minimum nights based on seasonality – potentially shorter during low season and longer during peak demand periods in San Crisanto.
San Crisanto Airbnb Cancellation Policy Trends Analysis (2026)
Flexible
16 listings
42.1% of total
Moderate
12 listings
31.6% of total
Firm
9 listings
23.7% of total
Strict
1 listings
2.6% of total
Cancellation Policy Insights for San Crisanto
- The prevailing Airbnb cancellation policy trend in San Crisanto is Flexible, used by 42.1% of listings.
- The market strongly favors guest-friendly terms, with 73.7% of listings offering Flexible or Moderate policies. This suggests guests in San Crisanto may expect booking flexibility.
- Strict cancellation policies are quite rare (2.6%), potentially making listings with this policy less competitive unless justified by high demand or property type.
Recommendations for Hosts
- Consider adopting a Flexible policy to align with the 42.1% market standard in San Crisanto.
- Using a Strict policy might deter some guests, as only 2.6% of listings use it. Evaluate if potential revenue protection outweighs possible lower booking rates.
- Regularly review your cancellation policy against competitors and market demand shifts in San Crisanto.
San Crisanto STR Booking Lead Time Analysis (2026)
Average Booking Lead Time by Month
Booking Lead Time Insights for San Crisanto
- The overall average booking lead time for vacation rentals in San Crisanto is 29 days.
- Guests book furthest in advance for stays during April (average 70 days), likely coinciding with peak travel demand or local events.
- The shortest booking windows occur for stays in November (average 12 days), indicating more last-minute travel plans during this time.
- Seasonally, Spring (38 days avg.) sees the longest lead times, while Fall (20 days avg.) has the shortest, reflecting typical travel planning cycles.
Recommendations for Hosts
- Use the overall average lead time (29 days) as a baseline for your pricing and availability strategy in San Crisanto.
- For April stays, consider implementing length-of-stay discounts or slightly higher rates for bookings made less than 70 days out to capitalize on advance planning.
- During November, focus on last-minute booking availability and promotions, as guests book with very short notice (12 days avg.).
- Target marketing efforts for the Spring season well in advance (at least 38 days) to capture early planners.
- Monitor your own booking lead times against these San Crisanto averages to identify opportunities for dynamic pricing adjustments.
Popular & Essential Airbnb Amenities in San Crisanto (2026)
Amenity Prevalence
Amenity Insights for San Crisanto
- Essential amenities in San Crisanto that guests expect include: Wifi. Lacking these (this) could significantly impact bookings.
- Popular amenities like Air conditioning, Free parking on premises, Beach access are common but not universal. Offering these can provide a competitive edge.
- A pool is a highly desired but not standard amenity, making it a key feature for attracting guests seeking leisure in San Crisanto.
Recommendations for Hosts
- Ensure your listing includes all essential amenities for San Crisanto: Wifi.
- Prioritize adding missing essentials: Wifi.
- Consider adding popular differentiators like Air conditioning or Free parking on premises to increase appeal.
- Highlight unique or less common amenities you offer (e.g., hot tub, dedicated workspace, EV charger) in your listing description and photos.
- Regularly check competitor amenities in San Crisanto to stay competitive.
San Crisanto Airbnb Guest Demographics & Profile Analysis (2026)
Guest Profile Summary for San Crisanto
- The typical guest profile for Airbnb in San Crisanto consists of primarily domestic travelers (70%), often arriving from nearby Mérida, typically belonging to the Post-2000s (Gen Z/Alpha) group (50%), primarily speaking Spanish or English.
- Domestic travelers account for 69.6% of guests.
- Key international markets include Mexico (69.6%) and United States (15.2%).
- Top languages spoken are Spanish (50.5%) followed by English (36.1%).
- A significant demographic segment is the Post-2000s (Gen Z/Alpha) group, representing 50% of guests.
Recommendations for Hosts
- Target domestic marketing efforts towards travelers from Mérida and Merida.
- Tailor amenities and listing descriptions to appeal to the dominant Post-2000s (Gen Z/Alpha) demographic (e.g., highlight fast WiFi, smart home features, local guides).
- Highlight unique local experiences or amenities relevant to the primary guest profile.
- Consider seasonal promotions aligned with peak travel times for key origin markets.
Nearby Short-Term Rental Market Comparison
How does the San Crisanto Airbnb market stack up against its neighbors? Compare key performance metrics like average monthly revenue, ADR, and occupancy rates in surrounding areas to understand the broader regional STR landscape.
| Market | Active Properties | Monthly Revenue | Daily Rate | Avg. Occupancy |
|---|---|---|---|---|
| San Bruno | 20 | $2,028 | $269.55 | 32% |
| San Benito | 39 | $1,876 | $235.61 | 36% |
| Playa Uaymitun | 13 | $1,727 | $341.44 | 34% |
| Chuburná | 46 | $1,524 | $172.34 | 37% |
| Dzemul | 14 | $1,477 | $200.18 | 28% |
| Hunucmá | 105 | $1,377 | $179.58 | 33% |
| Chicxulub | 94 | $1,298 | $181.39 | 32% |
| Chicxulub Puerto | 282 | $1,162 | $191.44 | 32% |
| Chuburná Puerto | 58 | $1,106 | $128.13 | 35% |
| Santa Clara | 19 | $976 | $150.25 | 20% |