San Bruno Airbnb Market Analysis 2026: Short Term Rental Data & Vacation Rental Statistics in Yucatán, Mexico
Is Airbnb profitable in San Bruno in 2026? Explore comprehensive Airbnb analytics for San Bruno, Yucatán, Mexico to uncover income potential. This 2026 STR market report for San Bruno, based on AirROI data from February 2025 to January 2026, reveals key trends in the niche market of 20 active listings.
Whether you're considering an Airbnb investment in San Bruno, optimizing your existing vacation rental, or exploring rental arbitrage opportunities, understanding the San Bruno Airbnb data is crucial. Leveraging the low regulation environment is key to maximizing your short term rental income potential. Let's dive into the specifics.
Key San Bruno Airbnb Performance Metrics Overview
Monthly Airbnb Revenue Variations & Income Potential in San Bruno (2026)
Understanding the monthly revenue variations for Airbnb listings in San Bruno is key to maximizing your short term rental income potential. Seasonality significantly impacts earnings. Our analysis, based on data from the past 12 months, shows that the peak revenue month for STRs in San Bruno is typically July, while January often presents the lowest earnings, highlighting opportunities for strategic pricing adjustments during shoulder and low seasons. Explore the typical Airbnb income in San Bruno across different performance tiers:
- Best-in-class properties (Top 10%) achieve $6,706+ monthly, often utilizing dynamic pricing and superior guest experiences.
- Strong performing properties (Top 25%) earn $4,108 or more, indicating effective management and desirable locations/amenities.
- Typical properties (Median) generate around $2,128 per month, representing the average market performance.
- Entry-level properties (Bottom 25%) see earnings around $1,000, often with potential for optimization.
Average Monthly Airbnb Earnings Trend in San Bruno
San Bruno Airbnb Occupancy Rate Trends (2026)
Maximize your bookings by understanding the San Bruno STR occupancy trends. Seasonal demand shifts significantly influence how often properties are booked. Typically, Julysees the highest demand (peak season occupancy), while January experiences the lowest (low season). Effective strategies, like adjusting minimum stays or offering promotions, can boost occupancy during slower periods. Here's how different property tiers perform in San Bruno:
- Best-in-class properties (Top 10%) achieve 63%+ occupancy, indicating high desirability and potentially optimized availability.
- Strong performing properties (Top 25%) maintain 44% or higher occupancy, suggesting good market fit and guest satisfaction.
- Typical properties (Median) have an occupancy rate around 27%.
- Entry-level properties (Bottom 25%) average 16% occupancy, potentially facing higher vacancy.
Average Monthly Occupancy Rate Trend in San Bruno
Average Daily Rate (ADR) Airbnb Trends in San Bruno (2026)
Effective short term rental pricing strategy in San Bruno involves understanding monthly ADR fluctuations. The Average Daily Rate (ADR) for Airbnb in San Bruno typically peaks in December and dips lowest during May. Leveraging Airbnb dynamic pricing tools or strategies based on this seasonality can significantly boost revenue. Here's a look at the typical nightly rates achieved:
- Best-in-class properties (Top 10%) command rates of $379+ per night, often due to premium features or locations.
- Strong performing properties (Top 25%) achieve nightly rates of $288 or more.
- Typical properties (Median) charge around $214 per night.
- Entry-level properties (Bottom 25%) earn around $150 per night.
Average Daily Rate (ADR) Trend by Month in San Bruno
Get Live San Bruno Market Intelligence 👇

Explore Real-time Analytics
Airbnb Seasonality Analysis & Trends in San Bruno (2026)
Peak Season (July, February, August)
- Revenue averages $5,004 per month
- Occupancy rates average 51.9%
- Daily rates average $258
Shoulder Season
- Revenue averages $2,927 per month
- Occupancy maintains around 30.6%
- Daily rates hold near $249
Low Season (January, October, November)
- Revenue drops to average $1,668 per month
- Occupancy decreases to average 19.0%
- Daily rates adjust to average $265
Seasonality Insights for San Bruno
- The Airbnb seasonality in San Bruno shows highly seasonal trends requiring careful strategy. While the sections above show seasonal averages, it's also insightful to look at the extremes:
- During the high season, the absolute peak month showcases San Bruno's highest earning potential, with monthly revenues capable of climbing to $7,206, occupancy reaching a high of 62.3%, and ADRs peaking at $285.
- Conversely, the slowest single month of the year, typically falling within the low season, marks the market's lowest point. In this month, revenue might dip to $1,520, occupancy could drop to 17.5%, and ADRs may adjust down to $229.
- Understanding both the seasonal averages and these monthly peaks and troughs in revenue, occupancy, and ADR is crucial for maximizing your Airbnb profit potential in San Bruno.
Seasonal Strategies for Maximizing Profit
- Peak Season: Maximize revenue through premium pricing and potentially longer minimum stays. Ensure high availability.
- Low Season: Offer competitive pricing, special promotions (e.g., extended stay discounts), and flexible cancellation policies. Target off-season travelers like remote workers or budget-conscious guests.
- Shoulder Seasons: Implement dynamic pricing that balances peak and low rates. Target weekend travelers or specific events. Offer slightly more flexible terms than peak season.
- Regularly analyze your own performance against these San Bruno seasonality benchmarks and adjust your pricing and availability strategy accordingly.
Best Areas for Airbnb Investment in San Bruno (2026)
Exploring the top neighborhoods for short-term rentals in San Bruno? This section highlights key areas, outlining why they are attractive for hosts and guests, along with notable local attractions. Consider these locations based on your target guest profile and investment strategy.
| Neighborhood / Area | Why Host Here? (Target Guests & Appeal) | Key Attractions & Landmarks |
|---|---|---|
| Centro Histórico | The colonial heart of San Bruno, rich in history and culture. This area is perfect for tourists looking to explore the local heritage, vibrant markets, and traditional Yucatecan cuisine. | Parque Principal, Museo del Pueblo, Templo de San Bruno, food markets, local artisan shops |
| Puerto Progreso | Close to the coast and popular for beachgoers, Puerto Progreso offers beautiful beaches and water activities. It's an ideal location for families and tourists seeking a seaside retreat. | Progreso Beach, Malecón de Progreso, water sports, fresh seafood restaurants |
| Chicxulub | Famous for being close to the impact site of the Chicxulub crater, this tranquil beach town provides a serene environment for beach lovers and nature enthusiasts. | Playa Chicxulub, local cenotes, eco-tourism, quiet beachfront |
| Mérida | Although not directly in San Bruno, nearby Mérida is a cultural hub that attracts many visitors. It's great for those looking to experience Yucatán's vibrant arts scene and historical architecture. | Paseo de Montejo, Piazza Grande, Cenote X'batun, historical museums, local markets |
| Dzilam de Bravo | A lesser-known coastal area that offers beautiful landscapes and tranquility away from the crowded beaches. Perfect for eco-tourism and retreats. | Cenote de Dzilam, natural parks, local wildlife, bird watching |
| Telchac Puerto | A small beach community with beautiful stretches of beach and a laid-back vibe. Great for families and those looking for a peaceful vacation. | Telchac Beach, local seafood eateries, beachfront activities |
| Baca | This quaint village offers a glimpse into rural Yucatán life and is known for its warm hospitality. It's great for tourists looking for an authentic experience. | local markets, Yucatecan cuisine, cultural events, traditional music scenes |
| San Felipe | Known for its stunning beaches and as a tranquil escape from city life, San Felipe is perfect for those wanting a relaxed beach experience combined with local culture. | San Felipe Beach, traditional fishing villages, coastal scenery, community festivals |
Understanding Airbnb License Requirements & STR Laws in San Bruno (2026)
While San Bruno, Yucatán, Mexico currently shows low STR regulations, specific Airbnb license requirements might still exist or change. Always verify the latest short term rental regulations and Airbnb license requirements directly with local government authorities for San Bruno to ensure full compliance before hosting.
(Source: AirROI data, 2026, finding no licensed listings among those analyzed)
Top Performing Airbnb Properties in San Bruno (2026)
Benchmark your potential! Explore examples of top-performing Airbnb properties in San Brunobased on Trailing Twelve Month (TTM) revenue. Analyze their characteristics, revenue, occupancy rate, and ADR to understand what drives success in this market.
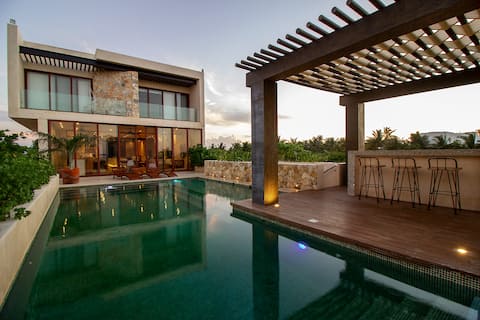
Stunning Beach Front House - Yucson KM31
Entire Place • 7 bedrooms

Beachfront Luxury Villa for 7ppl new infinity pool
Entire Place • 3 bedrooms

A piece of heaven by the sea
Entire Place • 5 bedrooms

4-Bedroom Beachfront Apartment
Entire Place • 4 bedrooms

House facing the San Esteban Sea
Entire Place • 4 bedrooms

New Beachfront Beauty
Entire Place • 4 bedrooms
Note: Performance varies based on location, size, amenities, seasonality, and management quality. Data reflects the past 12 months.
Top Performing Airbnb Hosts in San Bruno (2026)
Learn from the best! This table showcases top-performing Airbnb hosts in San Bruno based on the number of properties managed and estimated total revenue over the past year. Analyze their scale and performance metrics.
| Host Name | Properties | Grossing Revenue | Stay Reviews | Avg Rating |
|---|---|---|---|---|
| Karla | 1 | $123,447 | 12 | 4.75/5.0 |
| Carolina | 1 | $72,138 | 208 | 4.79/5.0 |
| Maria Elena | 1 | $52,147 | 97 | 4.96/5.0 |
| Salvador | 1 | $45,382 | 19 | 4.79/5.0 |
| Somar Hosting | 2 | $44,008 | 27 | 4.84/5.0 |
| Yanin Nicte Ha | 2 | $29,301 | 13 | 4.92/5.0 |
| Arturo | 1 | $23,504 | 9 | 5.00/5.0 |
| Humberto | 1 | $14,852 | 22 | 4.95/5.0 |
| Bwellcome | 1 | $14,691 | 0 | Not Rated |
| Casa Ku | 1 | $14,650 | 5 | 5.00/5.0 |
Analyzing the strategies of top hosts, such as their property selection, pricing, and guest communication, can offer valuable lessons for optimizing your own Airbnb operations in San Bruno.
Dive Deeper: Advanced San Bruno STR Market Data (2026)
Ready to unlock more insights? AirROI provides access to advanced metrics and comprehensive Airbnb data for San Bruno. Explore detailed analytics beyond this report to refine your investment strategy, optimize pricing, and maximize your vacation rental profits.
Explore Advanced MetricsSan Bruno Short-Term Rental Market Composition (2026): Property & Room Types
Room Type Distribution
Property Type Distribution
Market Composition Insights for San Bruno
- The San Bruno Airbnb market composition is heavily skewed towards Entire Home/Apt listings, which make up 95% of the 20 active rentals. This indicates strong guest preference for privacy and space.
- Looking at the property type distribution in San Bruno, Apartment/Condo properties are the most common (45%), reflecting the local real estate landscape.
- Houses represent a significant 45% portion, catering likely to families or larger groups.
San Bruno Airbnb Room Capacity Analysis (2026): Bedroom Distribution
Distribution of Listings by Number of Bedrooms
Room Capacity Insights for San Bruno
- The dominant room capacity in San Bruno is 4 bedrooms listings, making up 45% of the market. This suggests a strong demand for properties suitable for families or small groups.
- Together, 4 bedrooms and 3 bedrooms properties represent 65.0% of the active Airbnb listings in San Bruno, indicating a high concentration in these sizes.
- A significant 80.0% of listings offer 3+ bedrooms, catering to larger groups and families seeking more space in San Bruno.
San Bruno Vacation Rental Guest Capacity Trends (2026)
Distribution of Listings by Guest Capacity
Guest Capacity Insights for San Bruno
- The most common guest capacity trend in San Bruno vacation rentals is listings accommodating 8+ guests (65%). This suggests the primary traveler segment is likely larger groups.
- Properties designed for 8+ guests and 6 guests dominate the San Bruno STR market, accounting for 85.0% of listings.
- 90.0% of properties accommodate 6+ guests, serving the market segment for larger families or group travel in San Bruno.
- On average, properties in San Bruno are equipped to host 7.0 guests.
San Bruno Airbnb Booking Patterns (2026): Available vs. Booked Days
Available Days Distribution
Booked Days Distribution
Booking Pattern Insights for San Bruno
- The most common availability pattern in San Bruno falls within the 271-366 days range, representing 65% of listings. This suggests many properties have significant open periods on their calendars.
- Approximately 95.0% of listings show high availability (181+ days open annually), indicating potential for increased bookings or specific owner usage patterns.
- For booked days, the 31-90 days range is most frequent in San Bruno (45%), reflecting common guest stay durations or potential owner blocking patterns.
- A notable 5.0% of properties secure long booking periods (181+ days booked per year), highlighting successful long-term rental strategies or significant owner usage.
San Bruno Airbnb Minimum Stay Requirements Analysis
Distribution of Listings by Minimum Night Requirement
1 Night
2 listings
10% of total
2 Nights
2 listings
10% of total
3 Nights
5 listings
25% of total
4-6 Nights
1 listings
5% of total
7-29 Nights
1 listings
5% of total
30+ Nights
9 listings
45% of total
Key Insights
- The most prevalent minimum stay requirement in San Bruno is 30+ Nights, adopted by 45% of listings. This highlights the market's preference for longer commitments.
- A significant segment (45%) caters to monthly stays (30+ nights) in San Bruno, pointing to opportunities in the extended-stay market.
Recommendations
- Align with the market by considering a 30+ Nights minimum stay, as 45% of San Bruno hosts use this setting.
- If feasible, allowing 1-night stays, especially midweek or during low season, could capture last-minute bookings, as only 10% currently do.
- Explore offering discounts for stays of 30+ nights to attract the 45% of the market seeking extended stays.
- Adjust minimum nights based on seasonality – potentially shorter during low season and longer during peak demand periods in San Bruno.
San Bruno Airbnb Cancellation Policy Trends Analysis (2026)
Flexible
3 listings
15% of total
Moderate
9 listings
45% of total
Firm
6 listings
30% of total
Strict
2 listings
10% of total
Cancellation Policy Insights for San Bruno
- The prevailing Airbnb cancellation policy trend in San Bruno is Moderate, used by 45% of listings.
- There's a relatively balanced mix between guest-friendly (60.0%) and stricter (40.0%) policies, offering choices for different guest needs.
Recommendations for Hosts
- Consider adopting a Moderate policy to align with the 45% market standard in San Bruno.
- Using a Strict policy might deter some guests, as only 10% of listings use it. Evaluate if potential revenue protection outweighs possible lower booking rates.
- Regularly review your cancellation policy against competitors and market demand shifts in San Bruno.
San Bruno STR Booking Lead Time Analysis (2026)
Average Booking Lead Time by Month
Booking Lead Time Insights for San Bruno
- The overall average booking lead time for vacation rentals in San Bruno is 67 days.
- Guests book furthest in advance for stays during July (average 103 days), likely coinciding with peak travel demand or local events.
- The shortest booking windows occur for stays in November (average 29 days), indicating more last-minute travel plans during this time.
- Seasonally, Summer (79 days avg.) sees the longest lead times, while Fall (39 days avg.) has the shortest, reflecting typical travel planning cycles.
Recommendations for Hosts
- Use the overall average lead time (67 days) as a baseline for your pricing and availability strategy in San Bruno.
- For July stays, consider implementing length-of-stay discounts or slightly higher rates for bookings made less than 103 days out to capitalize on advance planning.
- Target marketing efforts for the Summer season well in advance (at least 79 days) to capture early planners.
- Monitor your own booking lead times against these San Bruno averages to identify opportunities for dynamic pricing adjustments.
Popular & Essential Airbnb Amenities in San Bruno (2026)
Amenity Prevalence
Amenity Insights for San Bruno
- Essential amenities in San Bruno that guests expect include: Free parking on premises, Pool, Wifi, Air conditioning. Lacking these (any) could significantly impact bookings.
- Popular amenities like Kitchen, Coffee maker, TV are common but not universal. Offering these can provide a competitive edge.
Recommendations for Hosts
- Ensure your listing includes all essential amenities for San Bruno: Free parking on premises, Pool, Wifi, Air conditioning.
- Prioritize adding missing essentials: Pool, Wifi, Air conditioning.
- Consider adding popular differentiators like Kitchen or Coffee maker to increase appeal.
- Highlight unique or less common amenities you offer (e.g., hot tub, dedicated workspace, EV charger) in your listing description and photos.
- Regularly check competitor amenities in San Bruno to stay competitive.
San Bruno Airbnb Guest Demographics & Profile Analysis (2026)
Guest Profile Summary for San Bruno
- The typical guest profile for Airbnb in San Bruno consists of primarily domestic travelers (79%), often arriving from nearby Mérida, typically belonging to the Post-2000s (Gen Z/Alpha) group (50%), primarily speaking Spanish or English.
- Domestic travelers account for 79.3% of guests.
- Key international markets include Mexico (79.3%) and United States (15.5%).
- Top languages spoken are Spanish (50%) followed by English (34%).
- A significant demographic segment is the Post-2000s (Gen Z/Alpha) group, representing 50% of guests.
Recommendations for Hosts
- Target domestic marketing efforts towards travelers from Mérida and Monterrey.
- Tailor amenities and listing descriptions to appeal to the dominant Post-2000s (Gen Z/Alpha) demographic (e.g., highlight fast WiFi, smart home features, local guides).
- Highlight unique local experiences or amenities relevant to the primary guest profile.
- Consider seasonal promotions aligned with peak travel times for key origin markets.
Nearby Short-Term Rental Market Comparison
How does the San Bruno Airbnb market stack up against its neighbors? Compare key performance metrics like average monthly revenue, ADR, and occupancy rates in surrounding areas to understand the broader regional STR landscape.
| Market | Active Properties | Monthly Revenue | Daily Rate | Avg. Occupancy |
|---|---|---|---|---|
| San Benito | 39 | $1,876 | $235.61 | 36% |
| Playa Uaymitun | 13 | $1,727 | $341.44 | 34% |
| Chuburná | 46 | $1,524 | $172.34 | 37% |
| Dzemul | 14 | $1,477 | $200.18 | 28% |
| Hunucmá | 105 | $1,377 | $179.58 | 33% |
| Chicxulub | 94 | $1,298 | $181.39 | 32% |
| Chicxulub Puerto | 282 | $1,162 | $191.44 | 32% |
| Chuburná Puerto | 58 | $1,106 | $128.13 | 35% |
| San Crisanto | 38 | $1,054 | $139.49 | 27% |
| Santa Clara | 19 | $976 | $150.25 | 20% |