Mérida Airbnb Market Analysis 2026: Short Term Rental Data & Vacation Rental Statistics in Yucatán, Mexico
Is Airbnb profitable in Mérida in 2026? Explore comprehensive Airbnb analytics for Mérida, Yucatán, Mexico to uncover income potential. This 2026 STR market report for Mérida, based on AirROI data from February 2025 to January 2026, reveals key trends in the bustling market of 4,567 active listings.
Whether you're considering an Airbnb investment in Mérida, optimizing your existing vacation rental, or exploring rental arbitrage opportunities, understanding the Mérida Airbnb data is crucial. Leveraging the low regulation environment is key to maximizing your short term rental income potential. Let's dive into the specifics.
Key Mérida Airbnb Performance Metrics Overview
Monthly Airbnb Revenue Variations & Income Potential in Mérida (2026)
Understanding the monthly revenue variations for Airbnb listings in Mérida is key to maximizing your short term rental income potential. Seasonality significantly impacts earnings. Our analysis, based on data from the past 12 months, shows that the peak revenue month for STRs in Mérida is typically December, while May often presents the lowest earnings, highlighting opportunities for strategic pricing adjustments during shoulder and low seasons. Explore the typical Airbnb income in Mérida across different performance tiers:
- Best-in-class properties (Top 10%) achieve $2,554+ monthly, often utilizing dynamic pricing and superior guest experiences.
- Strong performing properties (Top 25%) earn $1,371 or more, indicating effective management and desirable locations/amenities.
- Typical properties (Median) generate around $691 per month, representing the average market performance.
- Entry-level properties (Bottom 25%) see earnings around $331, often with potential for optimization.
Average Monthly Airbnb Earnings Trend in Mérida
Mérida Airbnb Occupancy Rate Trends (2026)
Maximize your bookings by understanding the Mérida STR occupancy trends. Seasonal demand shifts significantly influence how often properties are booked. Typically, Februarysees the highest demand (peak season occupancy), while May experiences the lowest (low season). Effective strategies, like adjusting minimum stays or offering promotions, can boost occupancy during slower periods. Here's how different property tiers perform in M�érida:
- Best-in-class properties (Top 10%) achieve 84%+ occupancy, indicating high desirability and potentially optimized availability.
- Strong performing properties (Top 25%) maintain 67% or higher occupancy, suggesting good market fit and guest satisfaction.
- Typical properties (Median) have an occupancy rate around 43%.
- Entry-level properties (Bottom 25%) average 22% occupancy, potentially facing higher vacancy.
Average Monthly Occupancy Rate Trend in Mérida
Average Daily Rate (ADR) Airbnb Trends in Mérida (2026)
Effective short term rental pricing strategy in Mérida involves understanding monthly ADR fluctuations. The Average Daily Rate (ADR) for Airbnb in Mérida typically peaks in December and dips lowest during April. Leveraging Airbnb dynamic pricing tools or strategies based on this seasonality can significantly boost revenue. Here's a look at the typical nightly rates achieved:
- Best-in-class properties (Top 10%) command rates of $156+ per night, often due to premium features or locations.
- Strong performing properties (Top 25%) achieve nightly rates of $93 or more.
- Typical properties (Median) charge around $54 per night.
- Entry-level properties (Bottom 25%) earn around $35 per night.
Average Daily Rate (ADR) Trend by Month in Mérida
Get Live Mérida Market Intelligence 👇

Explore Real-time Analytics
Airbnb Seasonality Analysis & Trends in Mérida (2026)
Peak Season (December, January, November)
- Revenue averages $1,341 per month
- Occupancy rates average 46.0%
- Daily rates average $87
Shoulder Season
- Revenue averages $1,123 per month
- Occupancy maintains around 47.1%
- Daily rates hold near $78
Low Season (May, June, September)
- Revenue drops to average $883 per month
- Occupancy decreases to average 39.5%
- Daily rates adjust to average $78
Seasonality Insights for Mérida
- The Airbnb seasonality in Mérida shows moderate seasonality with distinct peak and low periods. While the sections above show seasonal averages, it's also insightful to look at the extremes:
- During the high season, the absolute peak month showcases Mérida's highest earning potential, with monthly revenues capable of climbing to $1,445, occupancy reaching a high of 55.2%, and ADRs peaking at $90.
- Conversely, the slowest single month of the year, typically falling within the low season, marks the market's lowest point. In this month, revenue might dip to $853, occupancy could drop to 38.3%, and ADRs may adjust down to $76.
- Understanding both the seasonal averages and these monthly peaks and troughs in revenue, occupancy, and ADR is crucial for maximizing your Airbnb profit potential in Mérida.
Seasonal Strategies for Maximizing Profit
- Peak Season: Maximize revenue through premium pricing and potentially longer minimum stays. Ensure high availability.
- Low Season: Offer competitive pricing, special promotions (e.g., extended stay discounts), and flexible cancellation policies. Target off-season travelers like remote workers or budget-conscious guests.
- Shoulder Seasons: Implement dynamic pricing that balances peak and low rates. Target weekend travelers or specific events. Offer slightly more flexible terms than peak season.
- Regularly analyze your own performance against these Mérida seasonality benchmarks and adjust your pricing and availability strategy accordingly.
Best Areas for Airbnb Investment in Mérida (2026)
Exploring the top neighborhoods for short-term rentals in Mérida? This section highlights key areas, outlining why they are attractive for hosts and guests, along with notable local attractions. Consider these locations based on your target guest profile and investment strategy.
| Neighborhood / Area | Why Host Here? (Target Guests & Appeal) | Key Attractions & Landmarks |
|---|---|---|
| Centro Histórico | The heart of Mérida, known for its colonial architecture, vibrant culture, and numerous historical landmarks. Ideal for tourists who want to experience the city's rich history and local life. | Plaza Grande, Catedral de Mérida, Paseo de Montejo, Museo Casa de Montejo, Teatro Peón Contreras |
| Paseo de Montejo | A famous avenue lined with colonial mansions, restaurants, and shops. Popular among tourists and expatriates who enjoy a lively atmosphere and proximity to cultural sites. | Paseo de Montejo, Casa de la Cultura, Museo de Antropología, Parque de las Américas, Café Micaela |
| Santa Lucia | A charming neighborhood with a tranquil atmosphere, known for its small parks, local eateries, and weekly cultural events. Attracts visitors looking for a relaxing stay near the city center. | Parque de Santa Lucia, Sunday Serenades, Cultural events, Local restaurants, Artisan shops |
| Noche Buena | A residential area known for its local markets and proximity to major attractions, offering a more authentic Mérida experience away from the tourist crowds. | Mercado de Santiago, Cenote X'batun, Casa de la Cultura, Plaza de la Independencia, Teatro Armando Manzanero |
| Calle 60 | Known for its lively atmosphere, lined with shops, street food stalls, and nightlife options. A great location for younger travelers seeking a vibrant experience. | Mercado 60, Restaurants and bars, Centro Cultural Olimpo, Street Art, Cultural performances |
| San Ramón Norte | A peaceful, upscale neighborhood with parks and a family-friendly atmosphere. Ideal for longer stays and for families looking for a more suburban feel close to the city. | Parks, Family-friendly amenities, Cinemas, Shopping centers, Local markets |
| Chuburná | Close to the beach and offers a tranquil retreat while still being accessible to the city. Perfect for travelers looking for relaxation and natural beauty. | Playa Chuburná, Local restaurants, Beach activities, Nature walks, Cenotes nearby |
| Las Águilas | A residential area popular with locals and known for its great food options. Offers a more authentic experience of daily life in Mérida. | Local markets, Street food, Parks and recreation areas, Cultural centers, Traditional events |
Understanding Airbnb License Requirements & STR Laws in Mérida (2026)
While Mérida, Yucatán, Mexico currently shows low STR regulations, specific Airbnb license requirements might still exist or change. Always verify the latest short term rental regulations and Airbnb license requirements directly with local government authorities for Mérida to ensure full compliance before hosting.
(Source: AirROI data, 2026, based on 0% licensed listings)
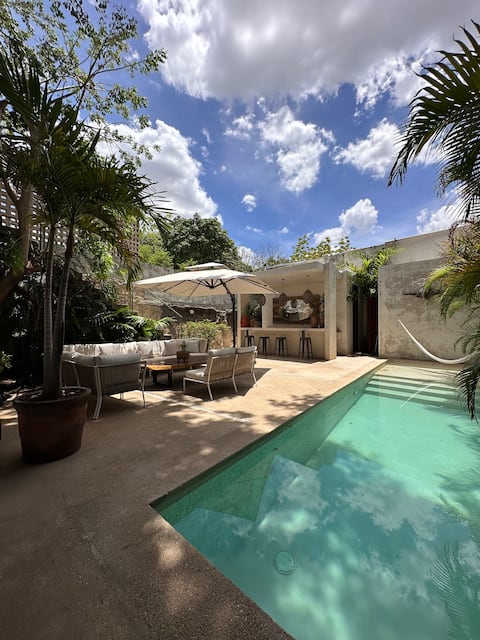
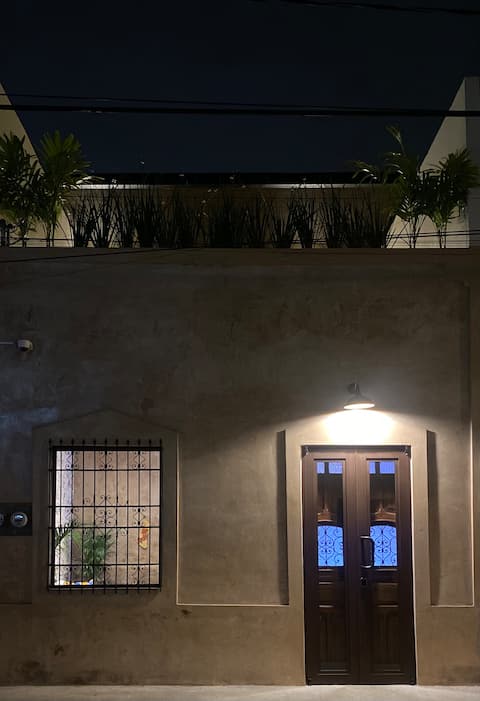
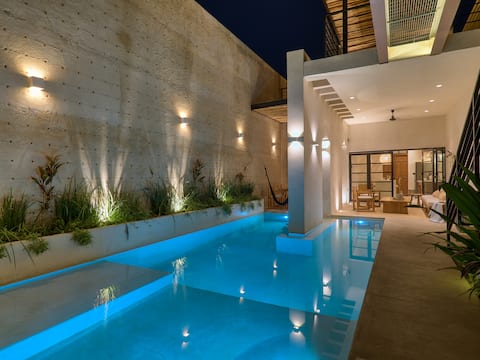
Top Performing Airbnb Properties in Mérida (2026)
Benchmark your potential! Explore examples of top-performing Airbnb properties in Méridabased on Trailing Twelve Month (TTM) revenue. Analyze their characteristics, revenue, occupancy rate, and ADR to understand what drives success in this market.
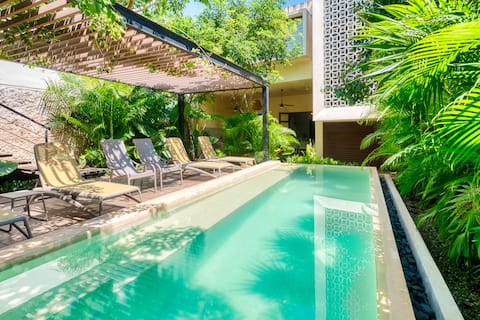
Colonial Home - Private Garden & Pool - Downtown
Entire Place • 7 bedrooms

Luxurious Vintage Mansion with Pool
Entire Place • 8 bedrooms
Casona.1903
Entire Place • 5 bedrooms
Casa Odilia
Entire Place • 6 bedrooms
Casa Antal - Yucatan Home Rentals
Entire Place • 4 bedrooms

Unique Design 'Casa Mandarina' 4BDR with Pool
Entire Place • 4 bedrooms
Note: Performance varies based on location, size, amenities, seasonality, and management quality. Data reflects the past 12 months.
Top Performing Airbnb Hosts in Mérida (2026)
Learn from the best! This table showcases top-performing Airbnb hosts in Mérida based on the number of properties managed and estimated total revenue over the past year. Analyze their scale and performance metrics.
| Host Name | Properties | Grossing Revenue | Stay Reviews | Avg Rating |
|---|---|---|---|---|
| Homirent | 118 | $937,840 | 11881 | 4.77/5.0 |
| María | 30 | $600,748 | 5796 | 4.76/5.0 |
| Oswaldo | 29 | $558,501 | 1237 | 4.89/5.0 |
| Vania | 9 | $334,813 | 728 | 4.87/5.0 |
| Alejandro | 31 | $299,438 | 6610 | 4.78/5.0 |
| Michael | 17 | $297,895 | 379 | 4.76/5.0 |
| Hponce Homes | 9 | $288,503 | 74 | 4.91/5.0 |
| Joaquin | 12 | $285,630 | 574 | 4.93/5.0 |
| Becca, Mike, & Cory | 13 | $275,575 | 1350 | 4.96/5.0 |
| Luis | 6 | $258,702 | 644 | 4.89/5.0 |
Analyzing the strategies of top hosts, such as their property selection, pricing, and guest communication, can offer valuable lessons for optimizing your own Airbnb operations in Mérida.
Dive Deeper: Advanced Mérida STR Market Data (2026)
Ready to unlock more insights? AirROI provides access to advanced metrics and comprehensive Airbnb data for Mérida. Explore detailed analytics beyond this report to refine your investment strategy, optimize pricing, and maximize your vacation rental profits.
Explore Advanced MetricsMérida Short-Term Rental Market Composition (2026): Property & Room Types
Room Type Distribution
Property Type Distribution
Market Composition Insights for Mérida
- The Mérida Airbnb market composition is heavily skewed towards Entire Home/Apt listings, which make up 80.4% of the 4,567 active rentals. This indicates strong guest preference for privacy and space.
- Looking at the property type distribution in Mérida, House properties are the most common (52.3%), reflecting the local real estate landscape.
- Houses represent a significant 52.3% portion, catering likely to families or larger groups.
- The presence of 8.6% Hotel/Boutique listings indicates integration with traditional hospitality.
- Smaller segments like others, outdoor/unique (combined 2.6%) offer potential for unique stay experiences.
Mérida Airbnb Room Capacity Analysis (2026): Bedroom Distribution
Distribution of Listings by Number of Bedrooms
Room Capacity Insights for Mérida
- The dominant room capacity in Mérida is 1 bedroom listings, making up 38.6% of the market. This suggests a strong demand for properties suitable for couples or solo travelers.
- Together, 1 bedroom and 2 bedrooms properties represent 68.7% of the active Airbnb listings in Mérida, indicating a high concentration in these sizes.
Mérida Vacation Rental Guest Capacity Trends (2026)
Distribution of Listings by Guest Capacity
Guest Capacity Insights for Mérida
- The most common guest capacity trend in Mérida vacation rentals is listings accommodating 2 guests (25%). This suggests the primary traveler segment is likely couples or solo travelers.
- Properties designed for 2 guests and 4 guests dominate the Mérida STR market, accounting for 48.2% of listings.
- 27.6% of properties accommodate 6+ guests, serving the market segment for larger families or group travel in Mérida.
- On average, properties in Mérida are equipped to host 3.8 guests.
Mérida Airbnb Booking Patterns (2026): Available vs. Booked Days
Available Days Distribution
Booked Days Distribution
Booking Pattern Insights for Mérida
- The most common availability pattern in Mérida falls within the 271-366 days range, representing 45.5% of listings. This suggests many properties have significant open periods on their calendars.
- Approximately 75.4% of listings show high availability (181+ days open annually), indicating potential for increased bookings or specific owner usage patterns.
- For booked days, the 91-180 days range is most frequent in Mérida (30.4%), reflecting common guest stay durations or potential owner blocking patterns.
- A notable 25.8% of properties secure long booking periods (181+ days booked per year), highlighting successful long-term rental strategies or significant owner usage.
Mérida Airbnb Minimum Stay Requirements Analysis
Distribution of Listings by Minimum Night Requirement
1 Night
1441 listings
31.6% of total
2 Nights
1439 listings
31.5% of total
3 Nights
481 listings
10.5% of total
4-6 Nights
180 listings
3.9% of total
7-29 Nights
65 listings
1.4% of total
30+ Nights
958 listings
21% of total
Key Insights
- The most prevalent minimum stay requirement in Mérida is 1 Night, adopted by 31.6% of listings. This highlights the market's preference for shorter, flexible bookings.
- A strong majority (63.1%) of the Mérida Airbnb data shows acceptance of very short stays (1-2 nights), indicating a dynamic, high-turnover market.
- A significant segment (21%) caters to monthly stays (30+ nights) in Mérida, pointing to opportunities in the extended-stay market.
Recommendations
- Align with the market by considering a 1 Night minimum stay, as 31.6% of Mérida hosts use this setting.
- Explore offering discounts for stays of 30+ nights to attract the 21% of the market seeking extended stays.
- Adjust minimum nights based on seasonality – potentially shorter during low season and longer during peak demand periods in Mérida.
Mérida Airbnb Cancellation Policy Trends Analysis (2026)
Limited
55 listings
1.2% of total
Super Strict 30 Days
7 listings
0.2% of total
Flexible
1732 listings
38% of total
Moderate
1304 listings
28.6% of total
Firm
1093 listings
24% of total
Strict
370 listings
8.1% of total
Cancellation Policy Insights for Mérida
- The prevailing Airbnb cancellation policy trend in Mérida is Flexible, used by 38% of listings.
- There's a relatively balanced mix between guest-friendly (66.6%) and stricter (32.1%) policies, offering choices for different guest needs.
- Strict cancellation policies are quite rare (8.1%), potentially making listings with this policy less competitive unless justified by high demand or property type.
Recommendations for Hosts
- Consider adopting a Flexible policy to align with the 38% market standard in Mérida.
- Using a Strict policy might deter some guests, as only 8.1% of listings use it. Evaluate if potential revenue protection outweighs possible lower booking rates.
- Regularly review your cancellation policy against competitors and market demand shifts in Mérida.
Mérida STR Booking Lead Time Analysis (2026)
Average Booking Lead Time by Month
Booking Lead Time Insights for Mérida
- The overall average booking lead time for vacation rentals in Mérida is 28 days.
- Guests book furthest in advance for stays during December (average 45 days), likely coinciding with peak travel demand or local events.
- The shortest booking windows occur for stays in June (average 19 days), indicating more last-minute travel plans during this time.
- Seasonally, Winter (40 days avg.) sees the longest lead times, while Summer (23 days avg.) has the shortest, reflecting typical travel planning cycles.
Recommendations for Hosts
- Use the overall average lead time (28 days) as a baseline for your pricing and availability strategy in Mérida.
- For December stays, consider implementing length-of-stay discounts or slightly higher rates for bookings made less than 45 days out to capitalize on advance planning.
- Target marketing efforts for the Winter season well in advance (at least 40 days) to capture early planners.
- Monitor your own booking lead times against these Mérida averages to identify opportunities for dynamic pricing adjustments.
Popular & Essential Airbnb Amenities in Mérida (2026)
Amenity Prevalence
Amenity Insights for Mérida
- Essential amenities in Mérida that guests expect include: Wifi, Air conditioning. Lacking these (any) could significantly impact bookings.
- Popular amenities like TV, Hot water, Kitchen are common but not universal. Offering these can provide a competitive edge.
Recommendations for Hosts
- Ensure your listing includes all essential amenities for Mérida: Wifi, Air conditioning.
- Prioritize adding missing essentials: Wifi, Air conditioning.
- Consider adding popular differentiators like TV or Hot water to increase appeal.
- Highlight unique or less common amenities you offer (e.g., hot tub, dedicated workspace, EV charger) in your listing description and photos.
- Regularly check competitor amenities in Mérida to stay competitive.
Mérida Airbnb Guest Demographics & Profile Analysis (2026)
Guest Profile Summary for Mérida
- The typical guest profile for Airbnb in Mérida consists of primarily domestic travelers (66%), often arriving from nearby Mexico City, typically belonging to the Post-2000s (Gen Z/Alpha) group (50%), primarily speaking Spanish or English.
- Domestic travelers account for 66.4% of guests.
- Key international markets include Mexico (66.4%) and United States (17.2%).
- Top languages spoken are Spanish (45.5%) followed by English (38.3%).
- A significant demographic segment is the Post-2000s (Gen Z/Alpha) group, representing 50% of guests.
Recommendations for Hosts
- Target domestic marketing efforts towards travelers from Mexico City and Cancún.
- Tailor amenities and listing descriptions to appeal to the dominant Post-2000s (Gen Z/Alpha) demographic (e.g., highlight fast WiFi, smart home features, local guides).
- Highlight unique local experiences or amenities relevant to the primary guest profile.
- Consider seasonal promotions aligned with peak travel times for key origin markets.
Nearby Short-Term Rental Market Comparison
How does the Mérida Airbnb market stack up against its neighbors? Compare key performance metrics like average monthly revenue, ADR, and occupancy rates in surrounding areas to understand the broader regional STR landscape.
| Market | Active Properties | Monthly Revenue | Daily Rate | Avg. Occupancy |
|---|---|---|---|---|
| San Bruno | 20 | $2,028 | $269.55 | 32% |
| San Benito | 39 | $1,876 | $235.61 | 36% |
| Playa Uaymitun | 13 | $1,727 | $341.44 | 34% |
| Chuburná | 46 | $1,524 | $172.34 | 37% |
| Dzemul | 14 | $1,477 | $200.18 | 28% |
| Hunucmá | 105 | $1,377 | $179.58 | 33% |
| Chicxulub | 94 | $1,298 | $181.39 | 32% |
| Chicxulub Puerto | 282 | $1,162 | $191.44 | 32% |
| Chuburná Puerto | 58 | $1,106 | $128.13 | 35% |
| San Crisanto | 38 | $1,054 | $139.49 | 27% |