Celestún Airbnb Market Analysis 2026: Short Term Rental Data & Vacation Rental Statistics in Yucatán, Mexico
Is Airbnb profitable in Celestún in 2026? Explore comprehensive Airbnb analytics for Celestún, Yucatán, Mexico to uncover income potential. This 2026 STR market report for Celestún, based on AirROI data from February 2025 to January 2026, reveals key trends in the niche market of 63 active listings.
Whether you're considering an Airbnb investment in Celestún, optimizing your existing vacation rental, or exploring rental arbitrage opportunities, understanding the Celestún Airbnb data is crucial. Leveraging the low regulation environment is key to maximizing your short term rental income potential. Let's dive into the specifics.
Key Celestún Airbnb Performance Metrics Overview
Monthly Airbnb Revenue Variations & Income Potential in Celestún (2026)
Understanding the monthly revenue variations for Airbnb listings in Celestún is key to maximizing your short term rental income potential. Seasonality significantly impacts earnings. Our analysis, based on data from the past 12 months, shows that the peak revenue month for STRs in Celestún is typically February, while September often presents the lowest earnings, highlighting opportunities for strategic pricing adjustments during shoulder and low seasons. Explore the typical Airbnb income in Celestún across different performance tiers:
- Best-in-class properties (Top 10%) achieve $2,312+ monthly, often utilizing dynamic pricing and superior guest experiences.
- Strong performing properties (Top 25%) earn $1,014 or more, indicating effective management and desirable locations/amenities.
- Typical properties (Median) generate around $508 per month, representing the average market performance.
- Entry-level properties (Bottom 25%) see earnings around $236, often with potential for optimization.
Average Monthly Airbnb Earnings Trend in Celestún
Celestún Airbnb Occupancy Rate Trends (2026)
Maximize your bookings by understanding the Celestún STR occupancy trends. Seasonal demand shifts significantly influence how often properties are booked. Typically, Februarysees the highest demand (peak season occupancy), while June experiences the lowest (low season). Effective strategies, like adjusting minimum stays or offering promotions, can boost occupancy during slower periods. Here's how different property tiers perform in Celestún:
- Best-in-class properties (Top 10%) achieve 52%+ occupancy, indicating high desirability and potentially optimized availability.
- Strong performing properties (Top 25%) maintain 35% or higher occupancy, suggesting good market fit and guest satisfaction.
- Typical properties (Median) have an occupancy rate around 21%.
- Entry-level properties (Bottom 25%) average 10% occupancy, potentially facing higher vacancy.
Average Monthly Occupancy Rate Trend in Celestún
Average Daily Rate (ADR) Airbnb Trends in Celestún (2026)
Effective short term rental pricing strategy in Celestún involves understanding monthly ADR fluctuations. The Average Daily Rate (ADR) for Airbnb in Celestún typically peaks in December and dips lowest during March. Leveraging Airbnb dynamic pricing tools or strategies based on this seasonality can significantly boost revenue. Here's a look at the typical nightly rates achieved:
- Best-in-class properties (Top 10%) command rates of $177+ per night, often due to premium features or locations.
- Strong performing properties (Top 25%) achieve nightly rates of $142 or more.
- Typical properties (Median) charge around $101 per night.
- Entry-level properties (Bottom 25%) earn around $61 per night.
Average Daily Rate (ADR) Trend by Month in Celestún
Get Live Celestún Market Intelligence 👇
Explore Real-time Analytics
Airbnb Seasonality Analysis & Trends in Celestún (2026)
Peak Season (February, March, April)
- Revenue averages $1,244 per month
- Occupancy rates average 35.2%
- Daily rates average $110
Shoulder Season
- Revenue averages $971 per month
- Occupancy maintains around 23.4%
- Daily rates hold near $115
Low Season (June, September, October)
- Revenue drops to average $729 per month
- Occupancy decreases to average 17.1%
- Daily rates adjust to average $114
Seasonality Insights for Celestún
- The Airbnb seasonality in Celestún shows highly seasonal trends requiring careful strategy. While the sections above show seasonal averages, it's also insightful to look at the extremes:
- During the high season, the absolute peak month showcases Celestún's highest earning potential, with monthly revenues capable of climbing to $1,345, occupancy reaching a high of 40.4%, and ADRs peaking at $118.
- Conversely, the slowest single month of the year, typically falling within the low season, marks the market's lowest point. In this month, revenue might dip to $607, occupancy could drop to 15.6%, and ADRs may adjust down to $109.
- Understanding both the seasonal averages and these monthly peaks and troughs in revenue, occupancy, and ADR is crucial for maximizing your Airbnb profit potential in Celestún.
Seasonal Strategies for Maximizing Profit
- Peak Season: Maximize revenue through premium pricing and potentially longer minimum stays. Ensure high availability.
- Low Season: Offer competitive pricing, special promotions (e.g., extended stay discounts), and flexible cancellation policies. Target off-season travelers like remote workers or budget-conscious guests.
- Shoulder Seasons: Implement dynamic pricing that balances peak and low rates. Target weekend travelers or specific events. Offer slightly more flexible terms than peak season.
- Regularly analyze your own performance against these Celestún seasonality benchmarks and adjust your pricing and availability strategy accordingly.
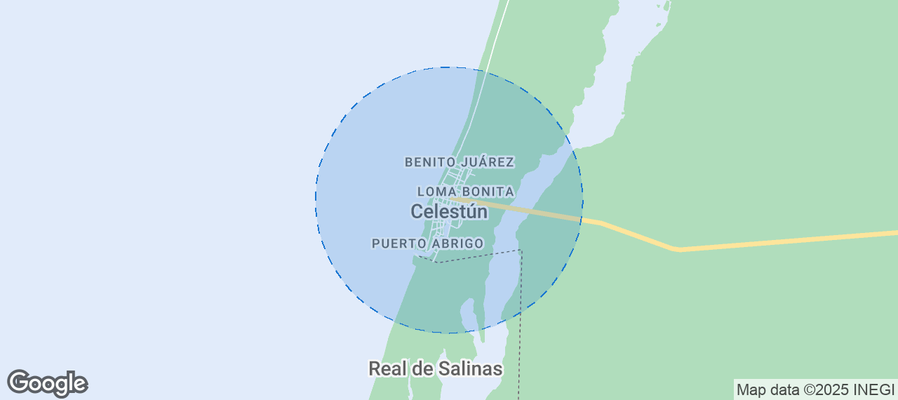
Best Areas for Airbnb Investment in Celestún (2026)
Exploring the top neighborhoods for short-term rentals in Celestún? This section highlights key areas, outlining why they are attractive for hosts and guests, along with notable local attractions. Consider these locations based on your target guest profile and investment strategy.
| Neighborhood / Area | Why Host Here? (Target Guests & Appeal) | Key Attractions & Landmarks |
|---|---|---|
| Celestún Beach | Known for its beautiful beach and proximity to the Celestún Biosphere Reserve, making it a perfect spot for nature lovers and beach vacationers. | Celestún Biosphere Reserve, Flamingo watching, Celestún lagoon, Beachfront restaurants, Kayaking opportunities |
| Downtown Celestún | The heart of the town, offering local culture, cuisine, and easy access to shops and restaurants. Ideal for guests wanting an authentic experience. | Local markets, Traditional restaurants, Town square, Cultural events, Artisan shops |
| Ría Celestún | A stunning natural estuary that attracts bird watchers and eco-tourists. Perfect for those looking for a tranquil, nature-focused getaway. | Birdwatching tours, Boating tours, Photography opportunities, Nature trails, Wildlife observation |
| Celestún main pier | A bustling area where tourists can take boat tours and enjoy local seafood. Great for travelers wanting to explore marine activities. | Boat tours to the biosphere, Seafood restaurants, Fishing opportunities, Sunset views, Cultural interactions with fishermen |
| Las Coloradas | Famous for its pink lakes and unique landscapes, attracting those looking for Instagram-worthy spots and photography opportunities. | Pink lakes, Photography spots, Sunset views, Unique landscapes, Nature walks |
| Nearby Mayan ruins | Historical sites that appeal to those interested in culture and history, offering a different experience from seaside relaxation. | Mayan ruins of Xcambó, Archaeological sites, Guided tours, Cultural significance, Nature integration |
| Cenotes near Celestún | Cenotes are natural swimming holes that offer refreshing dips and snorkeling opportunities, loved by adventure tourists. | Swimming in cenotes, Snorkeling, Nature immersion, Unique geological formations, Adventure tours |
| Private Villas and Rentals | Luxurious accommodations for families and groups, providing a secluded and exclusive vacation experience. | Luxury accommodations, Private beach access, Spa services, Personal chefs, Family-friendly activities |
Understanding Airbnb License Requirements & STR Laws in Celestún (2026)
While Celestún, Yucatán, Mexico currently shows low STR regulations, specific Airbnb license requirements might still exist or change. Always verify the latest short term rental regulations and Airbnb license requirements directly with local government authorities for Celestún to ensure full compliance before hosting.
(Source: AirROI data, 2026, finding no licensed listings among those analyzed)
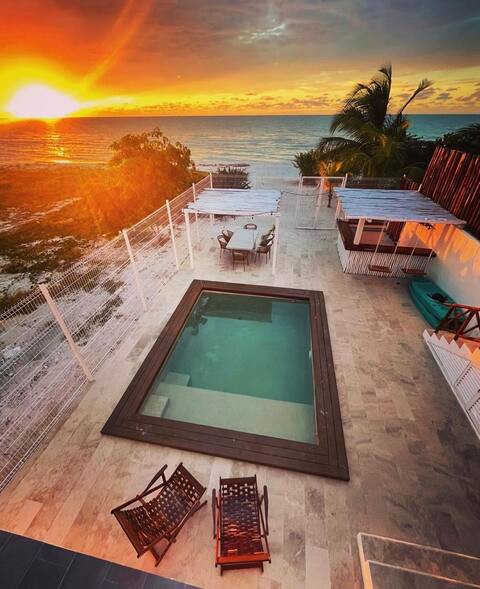
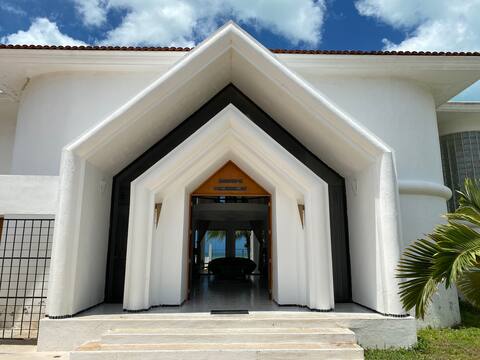
Top Performing Airbnb Properties in Celestún (2026)
Benchmark your potential! Explore examples of top-performing Airbnb properties in Celestúnbased on Trailing Twelve Month (TTM) revenue. Analyze their characteristics, revenue, occupancy rate, and ADR to understand what drives success in this market.
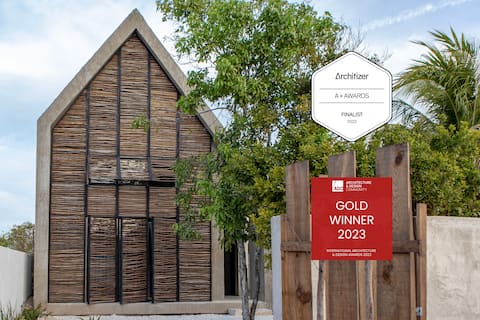
CasaTresAguas, Beachfront with Pool 3 bed/2 bath
Entire Place • 2 bedrooms
Casa Flamingo BeachFront House Celestún 12pers
Entire Place • 5 bedrooms
The House in Celestun, facing the Sea
Entire Place • 4 bedrooms
Accommodation in Celestún
Entire Place • 2 bedrooms
Ocean Front Villa
Entire Place • 3 bedrooms

SandyToes La Casita del Mexicano (Mexican's Little House)
Entire Place • 2 bedrooms
Note: Performance varies based on location, size, amenities, seasonality, and management quality. Data reflects the past 12 months.
Top Performing Airbnb Hosts in Celestún (2026)
Learn from the best! This table showcases top-performing Airbnb hosts in Celestún based on the number of properties managed and estimated total revenue over the past year. Analyze their scale and performance metrics.
| Host Name | Properties | Grossing Revenue | Stay Reviews | Avg Rating |
|---|---|---|---|---|
| Angela | 1 | $82,839 | 21 | 5.00/5.0 |
| Jarek | 4 | $63,576 | 219 | 4.90/5.0 |
| Rodrigo | 3 | $58,026 | 161 | 4.87/5.0 |
| Mariana | 1 | $53,905 | 94 | 4.87/5.0 |
| Giovanni | 4 | $44,161 | 101 | 4.64/5.0 |
| Shanali | 1 | $24,504 | 77 | 4.81/5.0 |
| Eduardo | 5 | $20,214 | 54 | 4.72/5.0 |
| Hotel Villa Gabriela | 7 | $19,405 | 660 | 4.62/5.0 |
| Casa Bre Mar | 4 | $17,254 | 63 | 4.74/5.0 |
| Reonaldo | 4 | $14,657 | 34 | 5.00/5.0 |
Analyzing the strategies of top hosts, such as their property selection, pricing, and guest communication, can offer valuable lessons for optimizing your own Airbnb operations in Celestún.
Dive Deeper: Advanced Celestún STR Market Data (2026)
Ready to unlock more insights? AirROI provides access to advanced metrics and comprehensive Airbnb data for Celestún. Explore detailed analytics beyond this report to refine your investment strategy, optimize pricing, and maximize your vacation rental profits.
Explore Advanced MetricsCelestún Short-Term Rental Market Composition (2026): Property & Room Types
Room Type Distribution
Property Type Distribution
Market Composition Insights for Celestún
- The Celestún Airbnb market composition is heavily skewed towards Entire Home/Apt listings, which make up 57.1% of the 63 active rentals. This indicates strong guest preference for privacy and space.
- However, a notable 41.3% share for Private Rooms suggests opportunities for budget-conscious travelers or hosts renting out spare rooms.
- Looking at the property type distribution in Celestún, House properties are the most common (54%), reflecting the local real estate landscape.
- Houses represent a significant 54% portion, catering likely to families or larger groups.
- The presence of 27% Hotel/Boutique listings indicates integration with traditional hospitality.
Celestún Airbnb Room Capacity Analysis (2026): Bedroom Distribution
Distribution of Listings by Number of Bedrooms
Room Capacity Insights for Celestún
- The dominant room capacity in Celestún is 1 bedroom listings, making up 54% of the market. This suggests a strong demand for properties suitable for couples or solo travelers.
- Together, 1 bedroom and 2 bedrooms properties represent 77.8% of the active Airbnb listings in Celestún, indicating a high concentration in these sizes.
- With over half the market (54%) consisting of studios or 1-bedroom units, Celestún is particularly well-suited for individuals or couples.
- Listings with 3+ bedrooms (6.4%) represent a smaller niche, potentially indicating an underserved market for larger group accommodations in Celestún.
Celestún Vacation Rental Guest Capacity Trends (2026)
Distribution of Listings by Guest Capacity
Guest Capacity Insights for Celestún
- The most common guest capacity trend in Celestún vacation rentals is listings accommodating 2 guests (23.8%). This suggests the primary traveler segment is likely couples or solo travelers.
- Properties designed for 2 guests and 4 guests dominate the Celestún STR market, accounting for 44.4% of listings.
- 23.8% of properties accommodate 6+ guests, serving the market segment for larger families or group travel in Celestún.
- On average, properties in Celestún are equipped to host 3.7 guests.
Celestún Airbnb Booking Patterns (2026): Available vs. Booked Days
Available Days Distribution
Booked Days Distribution
Booking Pattern Insights for Celestún
- The most common availability pattern in Celestún falls within the 271-366 days range, representing 79.4% of listings. This suggests many properties have significant open periods on their calendars.
- Approximately 93.7% of listings show high availability (181+ days open annually), indicating potential for increased bookings or specific owner usage patterns.
- For booked days, the 31-90 days range is most frequent in Celestún (50.8%), reflecting common guest stay durations or potential owner blocking patterns.
- A notable 6.3% of properties secure long booking periods (181+ days booked per year), highlighting successful long-term rental strategies or significant owner usage.
Celestún Airbnb Minimum Stay Requirements Analysis
Distribution of Listings by Minimum Night Requirement
1 Night
43 listings
68.3% of total
2 Nights
11 listings
17.5% of total
3 Nights
2 listings
3.2% of total
30+ Nights
7 listings
11.1% of total
Key Insights
- The most prevalent minimum stay requirement in Celestún is 1 Night, adopted by 68.3% of listings. This highlights the market's preference for shorter, flexible bookings.
- A strong majority (85.8%) of the Celestún Airbnb data shows acceptance of very short stays (1-2 nights), indicating a dynamic, high-turnover market.
- A significant segment (11.1%) caters to monthly stays (30+ nights) in Celestún, pointing to opportunities in the extended-stay market.
Recommendations
- Align with the market by considering a 1 Night minimum stay, as 68.3% of Celestún hosts use this setting.
- Explore offering discounts for stays of 30+ nights to attract the 11.1% of the market seeking extended stays.
- Adjust minimum nights based on seasonality – potentially shorter during low season and longer during peak demand periods in Celestún.
Celestún Airbnb Cancellation Policy Trends Analysis (2026)
Super Strict 60 Days
3 listings
4.8% of total
Flexible
33 listings
52.4% of total
Moderate
13 listings
20.6% of total
Firm
13 listings
20.6% of total
Strict
1 listings
1.6% of total
Cancellation Policy Insights for Celestún
- The prevailing Airbnb cancellation policy trend in Celestún is Flexible, used by 52.4% of listings.
- The market strongly favors guest-friendly terms, with 73.0% of listings offering Flexible or Moderate policies. This suggests guests in Celestún may expect booking flexibility.
- Strict cancellation policies are quite rare (1.6%), potentially making listings with this policy less competitive unless justified by high demand or property type.
Recommendations for Hosts
- Consider adopting a Flexible policy to align with the 52.4% market standard in Celestún.
- Given the high prevalence of Flexible policies (52.4%), offering this can enhance booking appeal, especially during shoulder seasons.
- Using a Strict policy might deter some guests, as only 1.6% of listings use it. Evaluate if potential revenue protection outweighs possible lower booking rates.
- Regularly review your cancellation policy against competitors and market demand shifts in Celestún.
Celestún STR Booking Lead Time Analysis (2026)
Average Booking Lead Time by Month
Booking Lead Time Insights for Celestún
- The overall average booking lead time for vacation rentals in Celestún is 38 days.
- Guests book furthest in advance for stays during December (average 65 days), likely coinciding with peak travel demand or local events.
- The shortest booking windows occur for stays in September (average 27 days), indicating more last-minute travel plans during this time.
- Seasonally, Winter (53 days avg.) sees the longest lead times, while Spring (32 days avg.) has the shortest, reflecting typical travel planning cycles.
Recommendations for Hosts
- Use the overall average lead time (38 days) as a baseline for your pricing and availability strategy in Celestún.
- For December stays, consider implementing length-of-stay discounts or slightly higher rates for bookings made less than 65 days out to capitalize on advance planning.
- Target marketing efforts for the Winter season well in advance (at least 53 days) to capture early planners.
- Monitor your own booking lead times against these Celestún averages to identify opportunities for dynamic pricing adjustments.
Popular & Essential Airbnb Amenities in Celestún (2026)
Amenity Prevalence
Amenity Insights for Celestún
- Essential amenities in Celestún that guests expect include: Wifi. Lacking these (this) could significantly impact bookings.
- Popular amenities like Air conditioning, TV, Beach access are common but not universal. Offering these can provide a competitive edge.
Recommendations for Hosts
- Ensure your listing includes all essential amenities for Celestún: Wifi.
- Consider adding popular differentiators like Air conditioning or TV to increase appeal.
- Highlight unique or less common amenities you offer (e.g., hot tub, dedicated workspace, EV charger) in your listing description and photos.
- Regularly check competitor amenities in Celestún to stay competitive.
Celestún Airbnb Guest Demographics & Profile Analysis (2026)
Guest Profile Summary for Celestún
- The typical guest profile for Airbnb in Celestún consists of a mix of domestic (54%) and international guests, often arriving from nearby Mexico City, typically belonging to the Post-2000s (Gen Z/Alpha) group (50%), primarily speaking English or Spanish.
- Domestic travelers account for 53.9% of guests.
- Key international markets include Mexico (53.9%) and United States (19.1%).
- Top languages spoken are English (40.6%) followed by Spanish (38.7%).
- A significant demographic segment is the Post-2000s (Gen Z/Alpha) group, representing 50% of guests.
Recommendations for Hosts
- Balance marketing efforts between domestic and international channels based on the guest mix.
- Tailor amenities and listing descriptions to appeal to the dominant Post-2000s (Gen Z/Alpha) demographic (e.g., highlight fast WiFi, smart home features, local guides).
- Highlight unique local experiences or amenities relevant to the primary guest profile.
- Consider seasonal promotions aligned with peak travel times for key origin markets.
Nearby Short-Term Rental Market Comparison
How does the Celestún Airbnb market stack up against its neighbors? Compare key performance metrics like average monthly revenue, ADR, and occupancy rates in surrounding areas to understand the broader regional STR landscape.
| Market | Active Properties | Monthly Revenue | Daily Rate | Avg. Occupancy |
|---|---|---|---|---|
| San Bruno | 20 | $2,028 | $269.55 | 32% |
| San Benito | 39 | $1,876 | $235.61 | 36% |
| Playa Uaymitun | 13 | $1,727 | $341.44 | 34% |
| Chuburná | 46 | $1,524 | $172.34 | 37% |
| Dzemul | 14 | $1,477 | $200.18 | 28% |
| Hunucmá | 105 | $1,377 | $179.58 | 33% |
| Chicxulub | 94 | $1,298 | $181.39 | 32% |
| Chicxulub Puerto | 282 | $1,162 | $191.44 | 32% |
| Chuburná Puerto | 58 | $1,106 | $128.13 | 35% |
| San Crisanto | 38 | $1,054 | $139.49 | 27% |