San Benito Airbnb Market Analysis 2026: Short Term Rental Data & Vacation Rental Statistics in Yucatán, Mexico
Is Airbnb profitable in San Benito in 2026? Explore comprehensive Airbnb analytics for San Benito, Yucatán, Mexico to uncover income potential. This 2026 STR market report for San Benito, based on AirROI data from February 2025 to January 2026, reveals key trends in the niche market of 39 active listings.
Whether you're considering an Airbnb investment in San Benito, optimizing your existing vacation rental, or exploring rental arbitrage opportunities, understanding the San Benito Airbnb data is crucial. Leveraging the low regulation environment is key to maximizing your short term rental income potential. Let's dive into the specifics.
Key San Benito Airbnb Performance Metrics Overview
Monthly Airbnb Revenue Variations & Income Potential in San Benito (2026)
Understanding the monthly revenue variations for Airbnb listings in San Benito is key to maximizing your short term rental income potential. Seasonality significantly impacts earnings. Our analysis, based on data from the past 12 months, shows that the peak revenue month for STRs in San Benito is typically July, while September often presents the lowest earnings, highlighting opportunities for strategic pricing adjustments during shoulder and low seasons. Explore the typical Airbnb income in San Benito across different performance tiers:
- Best-in-class properties (Top 10%) achieve $5,543+ monthly, often utilizing dynamic pricing and superior guest experiences.
- Strong performing properties (Top 25%) earn $3,637 or more, indicating effective management and desirable locations/amenities.
- Typical properties (Median) generate around $2,174 per month, representing the average market performance.
- Entry-level properties (Bottom 25%) see earnings around $1,122, often with potential for optimization.
Average Monthly Airbnb Earnings Trend in San Benito
San Benito Airbnb Occupancy Rate Trends (2026)
Maximize your bookings by understanding the San Benito STR occupancy trends. Seasonal demand shifts significantly influence how often properties are booked. Typically, Marchsees the highest demand (peak season occupancy), while October experiences the lowest (low season). Effective strategies, like adjusting minimum stays or offering promotions, can boost occupancy during slower periods. Here's how different property tiers perform in San Benito:
- Best-in-class properties (Top 10%) achieve 73%+ occupancy, indicating high desirability and potentially optimized availability.
- Strong performing properties (Top 25%) maintain 55% or higher occupancy, suggesting good market fit and guest satisfaction.
- Typical properties (Median) have an occupancy rate around 35%.
- Entry-level properties (Bottom 25%) average 19% occupancy, potentially facing higher vacancy.
Average Monthly Occupancy Rate Trend in San Benito
Average Daily Rate (ADR) Airbnb Trends in San Benito (2026)
Effective short term rental pricing strategy in San Benito involves understanding monthly ADR fluctuations. The Average Daily Rate (ADR) for Airbnb in San Benito typically peaks in December and dips lowest during March. Leveraging Airbnb dynamic pricing tools or strategies based on this seasonality can significantly boost revenue. Here's a look at the typical nightly rates achieved:
- Best-in-class properties (Top 10%) command rates of $363+ per night, often due to premium features or locations.
- Strong performing properties (Top 25%) achieve nightly rates of $250 or more.
- Typical properties (Median) charge around $180 per night.
- Entry-level properties (Bottom 25%) earn around $145 per night.
Average Daily Rate (ADR) Trend by Month in San Benito
Get Live San Benito Market Intelligence 👇

Explore Real-time Analytics
Airbnb Seasonality Analysis & Trends in San Benito (2026)
Peak Season (July, April, March)
- Revenue averages $3,719 per month
- Occupancy rates average 50.0%
- Daily rates average $220
Shoulder Season
- Revenue averages $2,680 per month
- Occupancy maintains around 37.6%
- Daily rates hold near $232
Low Season (May, September, November)
- Revenue drops to average $1,705 per month
- Occupancy decreases to average 29.3%
- Daily rates adjust to average $223
Seasonality Insights for San Benito
- The Airbnb seasonality in San Benito shows highly seasonal trends requiring careful strategy. While the sections above show seasonal averages, it's also insightful to look at the extremes:
- During the high season, the absolute peak month showcases San Benito's highest earning potential, with monthly revenues capable of climbing to $4,556, occupancy reaching a high of 50.7%, and ADRs peaking at $260.
- Conversely, the slowest single month of the year, typically falling within the low season, marks the market's lowest point. In this month, revenue might dip to $1,569, occupancy could drop to 27.9%, and ADRs may adjust down to $206.
- Understanding both the seasonal averages and these monthly peaks and troughs in revenue, occupancy, and ADR is crucial for maximizing your Airbnb profit potential in San Benito.
Seasonal Strategies for Maximizing Profit
- Peak Season: Maximize revenue through premium pricing and potentially longer minimum stays. Ensure high availability.
- Low Season: Offer competitive pricing, special promotions (e.g., extended stay discounts), and flexible cancellation policies. Target off-season travelers like remote workers or budget-conscious guests.
- Shoulder Seasons: Implement dynamic pricing that balances peak and low rates. Target weekend travelers or specific events. Offer slightly more flexible terms than peak season.
- Regularly analyze your own performance against these San Benito seasonality benchmarks and adjust your pricing and availability strategy accordingly.
Best Areas for Airbnb Investment in San Benito (2026)
Exploring the top neighborhoods for short-term rentals in San Benito? This section highlights key areas, outlining why they are attractive for hosts and guests, along with notable local attractions. Consider these locations based on your target guest profile and investment strategy.
| Neighborhood / Area | Why Host Here? (Target Guests & Appeal) | Key Attractions & Landmarks |
|---|---|---|
| Playa de San Benito | A tranquil beach area perfect for relaxation and water activities. Ideal for tourists looking for a peaceful getaway with access to the beautiful Yucatán coast. | San Benito Beach, Marina, Local seafood restaurants, Fishing spots, Water sports activities |
| Centro de San Benito | The bustling downtown area filled with local shops, markets, and cultural experiences. Great for tourists who want to immerse themselves in the local culture. | Local markets, Restaurants, Art galleries, Cultural festivals, Historical buildings |
| Chichen Itza | A UNESCO World Heritage site and one of the New Seven Wonders of the World. Attracts tourists from all over the globe, making it a prime location for investment. | Chichen Itza pyramids, Cenote Ik Kil, Sacred Cenote, Local Mayan villages, Cultural tours |
| Ek Balam | Known for its well-preserved Mayan ruins and proximity to cenotes. A perfect spot for tourists interested in history and adventure activities. | Ek Balam ruins, Cenote X'Canche, Eco-park activities, Mayan village tours |
| Valladolid | A charming colonial city with a vibrant atmosphere and rich history. It's a great base for exploring nearby attractions while offering a unique cultural experience. | Cenote Zaci, Convento de San Bernardino, Plaza Principal, Local handicraft shops, Culinary experiences |
| Cenote Ik Kil | A stunning natural swimming hole popular with visitors. This area attracts tourists looking for unique outdoor activities and experiences. | Cenote Ik Kil, Diving and swimming activities, Photography spots, Local flora and fauna |
| Rio Lagartos | A beautiful coastal town known for its biosphere reserve and wildlife, particularly flamingos. Perfect for eco-tourism and nature enthusiasts. | Rio Lagartos Biosphere Reserve, Flamingo watching tours, Kayaking, Local seafood experiences |
| Tizimin | A lesser-known region with rich history and access to ancient Mayan ruins. Ideal for travelers looking for off-the-beaten-path experiences. | Tizimin ruins, Cultural festivals, Local culinary experiences, Craft workshops |
Understanding Airbnb License Requirements & STR Laws in San Benito (2026)
While San Benito, Yucatán, Mexico currently shows low STR regulations, specific Airbnb license requirements might still exist or change. Always verify the latest short term rental regulations and Airbnb license requirements directly with local government authorities for San Benito to ensure full compliance before hosting.
(Source: AirROI data, 2026, based on 3% licensed listings)
Top Performing Airbnb Properties in San Benito (2026)
Benchmark your potential! Explore examples of top-performing Airbnb properties in San Benitobased on Trailing Twelve Month (TTM) revenue. Analyze their characteristics, revenue, occupancy rate, and ADR to understand what drives success in this market.

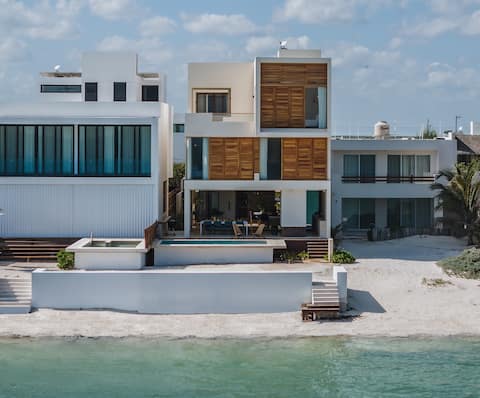
House with chic-vibes and beach front
Entire Place • 4 bedrooms
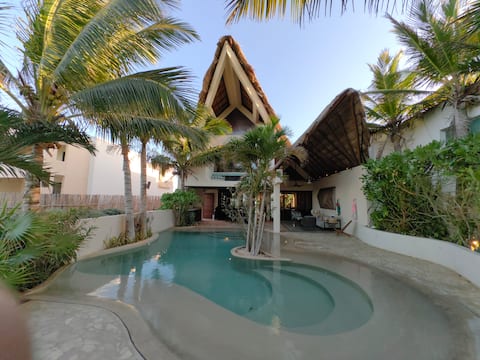
Mori house in front of the beach
Entire Place • 5 bedrooms

New Luxury Beachhouse
Entire Place • 4 bedrooms

Uac-aal, Oceanfront with Pool
Entire Place • 4 bedrooms
Villa Kakashki - Beachfront
Entire Place • 3 bedrooms

Las Olas Residence · Luxury Beachfront Villa ·
Entire Place • 6 bedrooms
Note: Performance varies based on location, size, amenities, seasonality, and management quality. Data reflects the past 12 months.
Top Performing Airbnb Hosts in San Benito (2026)
Learn from the best! This table showcases top-performing Airbnb hosts in San Benito based on the number of properties managed and estimated total revenue over the past year. Analyze their scale and performance metrics.
| Host Name | Properties | Grossing Revenue | Stay Reviews | Avg Rating |
|---|---|---|---|---|
| Michael | 6 | $118,007 | 287 | 4.58/5.0 |
| Jose | 3 | $107,950 | 76 | 4.85/5.0 |
| Ali | 1 | $65,660 | 38 | 4.97/5.0 |
| Somar Hosting | 1 | $55,687 | 26 | 4.88/5.0 |
| Fidel Jaimes | 2 | $51,916 | 25 | 4.84/5.0 |
| Maria Fernanda | 1 | $51,322 | 17 | 4.82/5.0 |
| Carlos | 1 | $42,207 | 4 | 5.00/5.0 |
| Concierge4u Riviera Yucatan | 1 | $41,990 | 11 | 4.45/5.0 |
| María | 1 | $35,565 | 20 | 4.95/5.0 |
| Elda Liliana | 1 | $30,839 | 5 | 4.60/5.0 |
Analyzing the strategies of top hosts, such as their property selection, pricing, and guest communication, can offer valuable lessons for optimizing your own Airbnb operations in San Benito.
Dive Deeper: Advanced San Benito STR Market Data (2026)
Ready to unlock more insights? AirROI provides access to advanced metrics and comprehensive Airbnb data for San Benito. Explore detailed analytics beyond this report to refine your investment strategy, optimize pricing, and maximize your vacation rental profits.
Explore Advanced MetricsSan Benito Short-Term Rental Market Composition (2026): Property & Room Types
Room Type Distribution
Property Type Distribution
Market Composition Insights for San Benito
- The San Benito Airbnb market composition is heavily skewed towards Entire Home/Apt listings, which make up 94.9% of the 39 active rentals. This indicates strong guest preference for privacy and space.
- Looking at the property type distribution in San Benito, House properties are the most common (74.4%), reflecting the local real estate landscape.
- Houses represent a significant 74.4% portion, catering likely to families or larger groups.
- Smaller segments like outdoor/unique (combined 2.6%) offer potential for unique stay experiences.
San Benito Airbnb Room Capacity Analysis (2026): Bedroom Distribution
Distribution of Listings by Number of Bedrooms
Room Capacity Insights for San Benito
- The dominant room capacity in San Benito is 3 bedrooms listings, making up 48.7% of the market. This suggests a strong demand for properties suitable for families or small groups.
- Together, 3 bedrooms and 4 bedrooms properties represent 76.9% of the active Airbnb listings in San Benito, indicating a high concentration in these sizes.
- A significant 89.7% of listings offer 3+ bedrooms, catering to larger groups and families seeking more space in San Benito.
San Benito Vacation Rental Guest Capacity Trends (2026)
Distribution of Listings by Guest Capacity
Guest Capacity Insights for San Benito
- The most common guest capacity trend in San Benito vacation rentals is listings accommodating 8+ guests (59%). This suggests the primary traveler segment is likely larger groups.
- Properties designed for 8+ guests and 6 guests dominate the San Benito STR market, accounting for 76.9% of listings.
- 87.2% of properties accommodate 6+ guests, serving the market segment for larger families or group travel in San Benito.
- On average, properties in San Benito are equipped to host 6.8 guests.
San Benito Airbnb Booking Patterns (2026): Available vs. Booked Days
Available Days Distribution
Booked Days Distribution
Booking Pattern Insights for San Benito
- The most common availability pattern in San Benito falls within the 271-366 days range, representing 48.7% of listings. This suggests many properties have significant open periods on their calendars.
- Approximately 84.6% of listings show high availability (181+ days open annually), indicating potential for increased bookings or specific owner usage patterns.
- For booked days, the 91-180 days range is most frequent in San Benito (38.5%), reflecting common guest stay durations or potential owner blocking patterns.
- A notable 15.4% of properties secure long booking periods (181+ days booked per year), highlighting successful long-term rental strategies or significant owner usage.
San Benito Airbnb Minimum Stay Requirements Analysis
Distribution of Listings by Minimum Night Requirement
1 Night
3 listings
7.7% of total
2 Nights
7 listings
17.9% of total
3 Nights
4 listings
10.3% of total
4-6 Nights
5 listings
12.8% of total
7-29 Nights
2 listings
5.1% of total
30+ Nights
18 listings
46.2% of total
Key Insights
- The most prevalent minimum stay requirement in San Benito is 30+ Nights, adopted by 46.2% of listings. This highlights the market's preference for longer commitments.
- A significant segment (46.2%) caters to monthly stays (30+ nights) in San Benito, pointing to opportunities in the extended-stay market.
Recommendations
- Align with the market by considering a 30+ Nights minimum stay, as 46.2% of San Benito hosts use this setting.
- If feasible, allowing 1-night stays, especially midweek or during low season, could capture last-minute bookings, as only 7.7% currently do.
- Explore offering discounts for stays of 30+ nights to attract the 46.2% of the market seeking extended stays.
- Adjust minimum nights based on seasonality – potentially shorter during low season and longer during peak demand periods in San Benito.
San Benito Airbnb Cancellation Policy Trends Analysis (2026)
Super Strict 30 Days
1 listings
2.6% of total
Limited
2 listings
5.1% of total
Flexible
9 listings
23.1% of total
Moderate
12 listings
30.8% of total
Firm
6 listings
15.4% of total
Strict
9 listings
23.1% of total
Cancellation Policy Insights for San Benito
- The prevailing Airbnb cancellation policy trend in San Benito is Moderate, used by 30.8% of listings.
- There's a relatively balanced mix between guest-friendly (53.9%) and stricter (38.5%) policies, offering choices for different guest needs.
Recommendations for Hosts
- Consider adopting a Moderate policy to align with the 30.8% market standard in San Benito.
- Regularly review your cancellation policy against competitors and market demand shifts in San Benito.
San Benito STR Booking Lead Time Analysis (2026)
Average Booking Lead Time by Month
Booking Lead Time Insights for San Benito
- The overall average booking lead time for vacation rentals in San Benito is 51 days.
- Guests book furthest in advance for stays during July (average 111 days), likely coinciding with peak travel demand or local events.
- The shortest booking windows occur for stays in March (average 21 days), indicating more last-minute travel plans during this time.
- Seasonally, Summer (76 days avg.) sees the longest lead times, while Spring (36 days avg.) has the shortest, reflecting typical travel planning cycles.
Recommendations for Hosts
- Use the overall average lead time (51 days) as a baseline for your pricing and availability strategy in San Benito.
- For July stays, consider implementing length-of-stay discounts or slightly higher rates for bookings made less than 111 days out to capitalize on advance planning.
- Target marketing efforts for the Summer season well in advance (at least 76 days) to capture early planners.
- Monitor your own booking lead times against these San Benito averages to identify opportunities for dynamic pricing adjustments.
Popular & Essential Airbnb Amenities in San Benito (2026)
Amenity Prevalence
Amenity Insights for San Benito
- Essential amenities in San Benito that guests expect include: Free parking on premises, Air conditioning, Wifi, TV, Kitchen, Pool. Lacking these (any) could significantly impact bookings.
- Popular amenities like Beach access, Hot water, Coffee maker are common but not universal. Offering these can provide a competitive edge.
Recommendations for Hosts
- Ensure your listing includes all essential amenities for San Benito: Free parking on premises, Air conditioning, Wifi, TV, Kitchen, Pool.
- Prioritize adding missing essentials: Wifi, TV, Kitchen, Pool.
- Consider adding popular differentiators like Beach access or Hot water to increase appeal.
- Highlight unique or less common amenities you offer (e.g., hot tub, dedicated workspace, EV charger) in your listing description and photos.
- Regularly check competitor amenities in San Benito to stay competitive.
San Benito Airbnb Guest Demographics & Profile Analysis (2026)
Guest Profile Summary for San Benito
- The typical guest profile for Airbnb in San Benito consists of primarily domestic travelers (81%), often arriving from nearby Mérida, typically belonging to the Post-2000s (Gen Z/Alpha) group (50%), primarily speaking Spanish or English.
- Domestic travelers account for 81.1% of guests.
- Key international markets include Mexico (81.1%) and United States (11.6%).
- Top languages spoken are Spanish (45.1%) followed by English (40.1%).
- A significant demographic segment is the Post-2000s (Gen Z/Alpha) group, representing 50% of guests.
Recommendations for Hosts
- Target domestic marketing efforts towards travelers from Mérida and Mexico City.
- Tailor amenities and listing descriptions to appeal to the dominant Post-2000s (Gen Z/Alpha) demographic (e.g., highlight fast WiFi, smart home features, local guides).
- Highlight unique local experiences or amenities relevant to the primary guest profile.
- Consider seasonal promotions aligned with peak travel times for key origin markets.
Nearby Short-Term Rental Market Comparison
How does the San Benito Airbnb market stack up against its neighbors? Compare key performance metrics like average monthly revenue, ADR, and occupancy rates in surrounding areas to understand the broader regional STR landscape.
| Market | Active Properties | Monthly Revenue | Daily Rate | Avg. Occupancy |
|---|---|---|---|---|
| San Bruno | 20 | $2,028 | $269.55 | 32% |
| Playa Uaymitun | 13 | $1,727 | $341.44 | 34% |
| Chuburná | 46 | $1,524 | $172.34 | 37% |
| Dzemul | 14 | $1,477 | $200.18 | 28% |
| Hunucmá | 105 | $1,377 | $179.58 | 33% |
| Chicxulub | 94 | $1,298 | $181.39 | 32% |
| Chicxulub Puerto | 282 | $1,162 | $191.44 | 32% |
| Chuburná Puerto | 58 | $1,106 | $128.13 | 35% |
| San Crisanto | 38 | $1,054 | $139.49 | 27% |
| Santa Clara | 19 | $976 | $150.25 | 20% |