Tecolutla Airbnb Market Analysis 2026: Short Term Rental Data & Vacation Rental Statistics in Veracruz, Mexico
Is Airbnb profitable in Tecolutla in 2026? Explore comprehensive Airbnb analytics for Tecolutla, Veracruz, Mexico to uncover income potential. This 2026 STR market report for Tecolutla, based on AirROI data from February 2025 to January 2026, reveals key trends in the niche market of 110 active listings.
Whether you're considering an Airbnb investment in Tecolutla, optimizing your existing vacation rental, or exploring rental arbitrage opportunities, understanding the Tecolutla Airbnb data is crucial. Leveraging the low regulation environment is key to maximizing your short term rental income potential. Let's dive into the specifics.
Key Tecolutla Airbnb Performance Metrics Overview
Monthly Airbnb Revenue Variations & Income Potential in Tecolutla (2026)
Understanding the monthly revenue variations for Airbnb listings in Tecolutla is key to maximizing your short term rental income potential. Seasonality significantly impacts earnings. Our analysis, based on data from the past 12 months, shows that the peak revenue month for STRs in Tecolutla is typically August, while November often presents the lowest earnings, highlighting opportunities for strategic pricing adjustments during shoulder and low seasons. Explore the typical Airbnb income in Tecolutla across different performance tiers:
- Best-in-class properties (Top 10%) achieve $2,274+ monthly, often utilizing dynamic pricing and superior guest experiences.
- Strong performing properties (Top 25%) earn $964 or more, indicating effective management and desirable locations/amenities.
- Typical properties (Median) generate around $456 per month, representing the average market performance.
- Entry-level properties (Bottom 25%) see earnings around $230, often with potential for optimization.
Average Monthly Airbnb Earnings Trend in Tecolutla
Tecolutla Airbnb Occupancy Rate Trends (2026)
Maximize your bookings by understanding the Tecolutla STR occupancy trends. Seasonal demand shifts significantly influence how often properties are booked. Typically, Aprilsees the highest demand (peak season occupancy), while January experiences the lowest (low season). Effective strategies, like adjusting minimum stays or offering promotions, can boost occupancy during slower periods. Here's how different property tiers perform in Tecolutla:
- Best-in-class properties (Top 10%) achieve 46%+ occupancy, indicating high desirability and potentially optimized availability.
- Strong performing properties (Top 25%) maintain 33% or higher occupancy, suggesting good market fit and guest satisfaction.
- Typical properties (Median) have an occupancy rate around 20%.
- Entry-level properties (Bottom 25%) average 11% occupancy, potentially facing higher vacancy.
Average Monthly Occupancy Rate Trend in Tecolutla
Average Daily Rate (ADR) Airbnb Trends in Tecolutla (2026)
Effective short term rental pricing strategy in Tecolutla involves understanding monthly ADR fluctuations. The Average Daily Rate (ADR) for Airbnb in Tecolutla typically peaks in December and dips lowest during March. Leveraging Airbnb dynamic pricing tools or strategies based on this seasonality can significantly boost revenue. Here's a look at the typical nightly rates achieved:
- Best-in-class properties (Top 10%) command rates of $218+ per night, often due to premium features or locations.
- Strong performing properties (Top 25%) achieve nightly rates of $134 or more.
- Typical properties (Median) charge around $68 per night.
- Entry-level properties (Bottom 25%) earn around $47 per night.
Average Daily Rate (ADR) Trend by Month in Tecolutla
Get Live Tecolutla Market Intelligence 👇

Explore Real-time Analytics
Airbnb Seasonality Analysis & Trends in Tecolutla (2026)
Peak Season (August, July, April)
- Revenue averages $1,322 per month
- Occupancy rates average 32.9%
- Daily rates average $110
Shoulder Season
- Revenue averages $894 per month
- Occupancy maintains around 23.0%
- Daily rates hold near $108
Low Season (January, February, November)
- Revenue drops to average $634 per month
- Occupancy decreases to average 16.1%
- Daily rates adjust to average $107
Seasonality Insights for Tecolutla
- The Airbnb seasonality in Tecolutla shows highly seasonal trends requiring careful strategy. While the sections above show seasonal averages, it's also insightful to look at the extremes:
- During the high season, the absolute peak month showcases Tecolutla's highest earning potential, with monthly revenues capable of climbing to $1,352, occupancy reaching a high of 37.0%, and ADRs peaking at $113.
- Conversely, the slowest single month of the year, typically falling within the low season, marks the market's lowest point. In this month, revenue might dip to $617, occupancy could drop to 14.1%, and ADRs may adjust down to $102.
- Understanding both the seasonal averages and these monthly peaks and troughs in revenue, occupancy, and ADR is crucial for maximizing your Airbnb profit potential in Tecolutla.
Seasonal Strategies for Maximizing Profit
- Peak Season: Maximize revenue through premium pricing and potentially longer minimum stays. Ensure high availability.
- Low Season: Offer competitive pricing, special promotions (e.g., extended stay discounts), and flexible cancellation policies. Target off-season travelers like remote workers or budget-conscious guests.
- Shoulder Seasons: Implement dynamic pricing that balances peak and low rates. Target weekend travelers or specific events. Offer slightly more flexible terms than peak season.
- Regularly analyze your own performance against these Tecolutla seasonality benchmarks and adjust your pricing and availability strategy accordingly.
Best Areas for Airbnb Investment in Tecolutla (2026)
Exploring the top neighborhoods for short-term rentals in Tecolutla? This section highlights key areas, outlining why they are attractive for hosts and guests, along with notable local attractions. Consider these locations based on your target guest profile and investment strategy.
| Neighborhood / Area | Why Host Here? (Target Guests & Appeal) | Key Attractions & Landmarks |
|---|---|---|
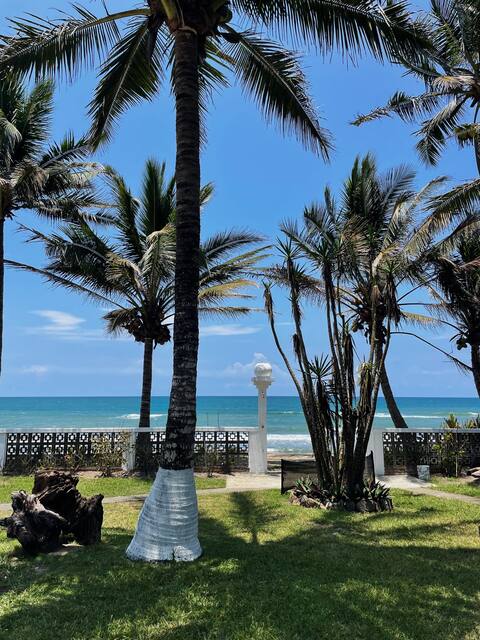
| Las Palmas Beach | Popular destination for its beautiful beach and proximity to nature. Tourists are drawn to the calm waters and scenic views, making it ideal for families and beachgoers. | Las Palmas Beach, Laguna Tecolutla, palm tree-lined shores, local seafood restaurants, water sports activities |
| Tecolutla River | A unique spot for eco-tourism, with opportunities for kayaking and nature tours. Attracts adventure seekers and eco-conscious travelers looking for unique experiences. | Tecolutla River, mangrove tours, bird watching, kayaking, eco-lodges |
| Cabo Roo | Less crowded area known for its tranquility, ideal for those looking to escape the hustle and bustle. Perfect for those seeking peace and quiet during their vacation. | peaceful beaches, remote getaways, local restaurants, sunset views, scenic hiking trails |
| Pueblo Mágico de Tecolutla | The charming town itself offers cultural experiences, local markets, and authentic cuisine. A great choice for travelers wanting to immerse themselves in local culture. | local markets, historical architecture, Tecolutla Church, artisan shops, traditional Mexican food |
| El Chote | A hidden gem for nature lovers, with access to unspoiled beaches and natural reserves. Great for those looking for a serene and rustic vacation experience. | El Chote beach, natural reserves, hiking trails, fishing spots, camping areas |
| Tuxpan Port | Proximity to Tuxpan offers additional activities and access to larger cities. Increases options for guests wanting to explore beyond Tecolutla. | Tuxpan Beach, Zocolo de Tuxpan, river cruises, local nightlife, shopping areas |
| Cazones River | Known for its beautiful riverine landscape and fishing opportunities. Attracts nature enthusiasts and those interested in local fishing culture. | Cazones River, fishing villages, boat tours, local festivals, lush greenery |
| San Rafael | Another quaint beach town nearby with beautiful landscapes, attracting tourists looking for serenity and relaxation in nature. | beaches of San Rafael, local seafood, hiking paths, beautiful lookout points, small-town charm |
Understanding Airbnb License Requirements & STR Laws in Tecolutla (2026)
While Tecolutla, Veracruz, Mexico currently shows low STR regulations, specific Airbnb license requirements might still exist or change. Always verify the latest short term rental regulations and Airbnb license requirements directly with local government authorities for Tecolutla to ensure full compliance before hosting.
(Source: AirROI data, 2026, finding no licensed listings among those analyzed)
Top Performing Airbnb Properties in Tecolutla (2026)
Benchmark your potential! Explore examples of top-performing Airbnb properties in Tecolutlabased on Trailing Twelve Month (TTM) revenue. Analyze their characteristics, revenue, occupancy rate, and ADR to understand what drives success in this market.
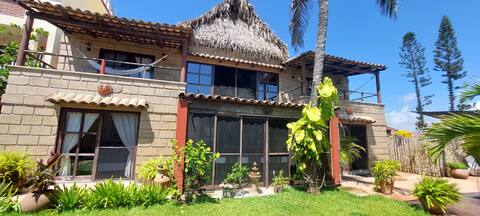
Beautiful BEACH HOUSE, with a garden and ocean view!
Entire Place • 6 bedrooms

"Don Chuy" Inn, an oceanfront location
Entire Place • 6 bedrooms
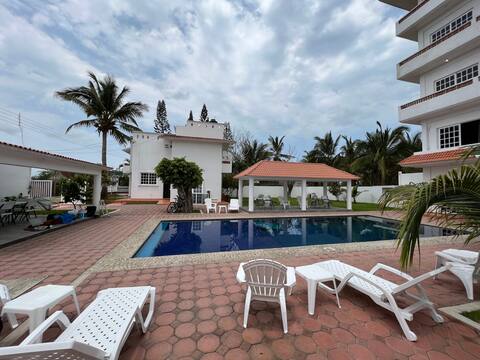
Pascal Hermosa's House. Beautiful House with a Pool
Entire Place • 4 bedrooms

Beach house with pool one block from the sea.
Entire Place • 3 bedrooms
Comfort and Exclusivity in Tecolutla 18 people
Private Room • 4 bedrooms

Wonderful BEACH HOUSE, with a garden and pool!
Entire Place • 3 bedrooms
Note: Performance varies based on location, size, amenities, seasonality, and management quality. Data reflects the past 12 months.
Top Performing Airbnb Hosts in Tecolutla (2026)
Learn from the best! This table showcases top-performing Airbnb hosts in Tecolutla based on the number of properties managed and estimated total revenue over the past year. Analyze their scale and performance metrics.
| Host Name | Properties | Grossing Revenue | Stay Reviews | Avg Rating |
|---|---|---|---|---|
| Alfonso | 3 | $141,701 | 19 | 4.96/5.0 |
| Beto | 7 | $113,661 | 540 | 4.78/5.0 |
| Ariadna | 10 | $96,823 | 203 | 4.52/5.0 |
| Monica | 1 | $58,200 | 46 | 4.54/5.0 |
| Pascal | 1 | $47,805 | 129 | 4.96/5.0 |
| Esther | 1 | $45,624 | 37 | 5.00/5.0 |
| Ale | 8 | $39,763 | 1237 | 4.88/5.0 |
| Gloria | 2 | $36,625 | 300 | 4.28/5.0 |
| Hector | 1 | $29,023 | 113 | 4.88/5.0 |
| Punta Cometa B.H. | 14 | $28,057 | 184 | 4.71/5.0 |
Analyzing the strategies of top hosts, such as their property selection, pricing, and guest communication, can offer valuable lessons for optimizing your own Airbnb operations in Tecolutla.
Dive Deeper: Advanced Tecolutla STR Market Data (2026)
Ready to unlock more insights? AirROI provides access to advanced metrics and comprehensive Airbnb data for Tecolutla. Explore detailed analytics beyond this report to refine your investment strategy, optimize pricing, and maximize your vacation rental profits.
Explore Advanced MetricsTecolutla Short-Term Rental Market Composition (2026): Property & Room Types
Room Type Distribution
Property Type Distribution
Market Composition Insights for Tecolutla
- The Tecolutla Airbnb market composition is heavily skewed towards Private Room listings, which make up 52.7% of the 110 active rentals. This indicates strong guest preference for privacy and space.
- Looking at the property type distribution in Tecolutla, House properties are the most common (44.5%), reflecting the local real estate landscape.
- Houses represent a significant 44.5% portion, catering likely to families or larger groups.
- The presence of 27.3% Hotel/Boutique listings indicates integration with traditional hospitality.
- Smaller segments like others, unique stays (combined 4.5%) offer potential for unique stay experiences.
Tecolutla Airbnb Room Capacity Analysis (2026): Bedroom Distribution
Distribution of Listings by Number of Bedrooms
Room Capacity Insights for Tecolutla
- The dominant room capacity in Tecolutla is 1 bedroom listings, making up 33.6% of the market. This suggests a strong demand for properties suitable for couples or solo travelers.
- Together, 1 bedroom and 2 bedrooms properties represent 54.5% of the active Airbnb listings in Tecolutla, indicating a high concentration in these sizes.
- A significant 21.8% of listings offer 3+ bedrooms, catering to larger groups and families seeking more space in Tecolutla.
Tecolutla Vacation Rental Guest Capacity Trends (2026)
Distribution of Listings by Guest Capacity
Guest Capacity Insights for Tecolutla
- The most common guest capacity trend in Tecolutla vacation rentals is listings accommodating 8+ guests (34.5%). This suggests the primary traveler segment is likely larger groups.
- Properties designed for 8+ guests and 4 guests dominate the Tecolutla STR market, accounting for 46.3% of listings.
- 47.2% of properties accommodate 6+ guests, serving the market segment for larger families or group travel in Tecolutla.
- On average, properties in Tecolutla are equipped to host 4.5 guests.
Tecolutla Airbnb Booking Patterns (2026): Available vs. Booked Days
Available Days Distribution
Booked Days Distribution
Booking Pattern Insights for Tecolutla
- The most common availability pattern in Tecolutla falls within the 271-366 days range, representing 73.6% of listings. This suggests many properties have significant open periods on their calendars.
- Approximately 97.2% of listings show high availability (181+ days open annually), indicating potential for increased bookings or specific owner usage patterns.
- For booked days, the 31-90 days range is most frequent in Tecolutla (40%), reflecting common guest stay durations or potential owner blocking patterns.
- A notable 3.6% of properties secure long booking periods (181+ days booked per year), highlighting successful long-term rental strategies or significant owner usage.
Tecolutla Airbnb Minimum Stay Requirements Analysis
Distribution of Listings by Minimum Night Requirement
1 Night
53 listings
48.2% of total
2 Nights
36 listings
32.7% of total
30+ Nights
21 listings
19.1% of total
Key Insights
- The most prevalent minimum stay requirement in Tecolutla is 1 Night, adopted by 48.2% of listings. This highlights the market's preference for shorter, flexible bookings.
- A strong majority (80.9%) of the Tecolutla Airbnb data shows acceptance of very short stays (1-2 nights), indicating a dynamic, high-turnover market.
- A significant segment (19.1%) caters to monthly stays (30+ nights) in Tecolutla, pointing to opportunities in the extended-stay market.
Recommendations
- Align with the market by considering a 1 Night minimum stay, as 48.2% of Tecolutla hosts use this setting.
- Explore offering discounts for stays of 30+ nights to attract the 19.1% of the market seeking extended stays.
- Adjust minimum nights based on seasonality – potentially shorter during low season and longer during peak demand periods in Tecolutla.
Tecolutla Airbnb Cancellation Policy Trends Analysis (2026)
Flexible
49 listings
44.5% of total
Moderate
19 listings
17.3% of total
Firm
26 listings
23.6% of total
Strict
16 listings
14.5% of total
Cancellation Policy Insights for Tecolutla
- The prevailing Airbnb cancellation policy trend in Tecolutla is Flexible, used by 44.5% of listings.
- There's a relatively balanced mix between guest-friendly (61.8%) and stricter (38.1%) policies, offering choices for different guest needs.
Recommendations for Hosts
- Consider adopting a Flexible policy to align with the 44.5% market standard in Tecolutla.
- Using a Strict policy might deter some guests, as only 14.5% of listings use it. Evaluate if potential revenue protection outweighs possible lower booking rates.
- Regularly review your cancellation policy against competitors and market demand shifts in Tecolutla.
Tecolutla STR Booking Lead Time Analysis (2026)
Average Booking Lead Time by Month
Booking Lead Time Insights for Tecolutla
- The overall average booking lead time for vacation rentals in Tecolutla is 23 days.
- Guests book furthest in advance for stays during September (average 41 days), likely coinciding with peak travel demand or local events.
- The shortest booking windows occur for stays in February (average 10 days), indicating more last-minute travel plans during this time.
- Seasonally, Fall (29 days avg.) sees the longest lead times, while Spring (21 days avg.) has the shortest, reflecting typical travel planning cycles.
Recommendations for Hosts
- Use the overall average lead time (23 days) as a baseline for your pricing and availability strategy in Tecolutla.
- For September stays, consider implementing length-of-stay discounts or slightly higher rates for bookings made less than 41 days out to capitalize on advance planning.
- During February, focus on last-minute booking availability and promotions, as guests book with very short notice (10 days avg.).
- Target marketing efforts for the Fall season well in advance (at least 29 days) to capture early planners.
- Monitor your own booking lead times against these Tecolutla averages to identify opportunities for dynamic pricing adjustments.
Popular & Essential Airbnb Amenities in Tecolutla (2026)
Amenity Prevalence
Amenity Insights for Tecolutla
- Popular amenities like Wifi, TV, Free parking on premises are common but not universal. Offering these can provide a competitive edge.
- Warning: Wifi is not universally provided but is considered essential globally. Ensure reliable Wifi is offered.
Recommendations for Hosts
- Consider adding popular differentiators like Wifi or TV to increase appeal.
- Highlight unique or less common amenities you offer (e.g., hot tub, dedicated workspace, EV charger) in your listing description and photos.
- Regularly check competitor amenities in Tecolutla to stay competitive.
Tecolutla Airbnb Guest Demographics & Profile Analysis (2026)
Guest Profile Summary for Tecolutla
- The typical guest profile for Airbnb in Tecolutla consists of primarily domestic travelers (96%), often arriving from nearby Mexico City, typically belonging to the Post-2000s (Gen Z/Alpha) group (50%), primarily speaking Spanish or English.
- Domestic travelers account for 96.1% of guests.
- Key international markets include Mexico (96.1%) and United States (3%).
- Top languages spoken are Spanish (62.2%) followed by English (27.9%).
- A significant demographic segment is the Post-2000s (Gen Z/Alpha) group, representing 50% of guests.
Recommendations for Hosts
- Target domestic marketing efforts towards travelers from Mexico City and Pachuca.
- Tailor amenities and listing descriptions to appeal to the dominant Post-2000s (Gen Z/Alpha) demographic (e.g., highlight fast WiFi, smart home features, local guides).
- Highlight unique local experiences or amenities relevant to the primary guest profile.
- Consider seasonal promotions aligned with peak travel times for key origin markets.
Nearby Short-Term Rental Market Comparison
How does the Tecolutla Airbnb market stack up against its neighbors? Compare key performance metrics like average monthly revenue, ADR, and occupancy rates in surrounding areas to understand the broader regional STR landscape.
| Market | Active Properties | Monthly Revenue | Daily Rate | Avg. Occupancy |
|---|---|---|---|---|
| La Guadalupe | 19 | $1,791 | $216.30 | 31% |
| Costa Esmeralda | 18 | $1,183 | $182.50 | 26% |
| San Francisco Mazapa | 15 | $1,155 | $93.59 | 39% |
| Monte Gordo | 29 | $1,065 | $166.24 | 24% |
| Playa de Chachalacas | 70 | $1,064 | $158.49 | 26% |
| Santa Ana Portales | 175 | $1,062 | $187.63 | 22% |
| Terrenos del Lote "La Isla" | 39 | $990 | $139.28 | 24% |
| Mineral del Chico | 100 | $947 | $124.78 | 29% |
| San José Ocotillos | 62 | $802 | $117.30 | 23% |
| San Nicolás de Los Ranchos | 12 | $801 | $150.59 | 20% |