Alvarado Airbnb Market Analysis 2026: Short Term Rental Data & Vacation Rental Statistics in Veracruz, Mexico
Is Airbnb profitable in Alvarado in 2026? Explore comprehensive Airbnb analytics for Alvarado, Veracruz, Mexico to uncover income potential. This 2026 STR market report for Alvarado, based on AirROI data from February 2025 to January 2026, reveals key trends in the niche market of 30 active listings.
Whether you're considering an Airbnb investment in Alvarado, optimizing your existing vacation rental, or exploring rental arbitrage opportunities, understanding the Alvarado Airbnb data is crucial. Leveraging the low regulation environment is key to maximizing your short term rental income potential. Let's dive into the specifics.
Key Alvarado Airbnb Performance Metrics Overview
Monthly Airbnb Revenue Variations & Income Potential in Alvarado (2026)
Understanding the monthly revenue variations for Airbnb listings in Alvarado is key to maximizing your short term rental income potential. Seasonality significantly impacts earnings. Our analysis, based on data from the past 12 months, shows that the peak revenue month for STRs in Alvarado is typically April, while January often presents the lowest earnings, highlighting opportunities for strategic pricing adjustments during shoulder and low seasons. Explore the typical Airbnb income in Alvarado across different performance tiers:
- Best-in-class properties (Top 10%) achieve $2,345+ monthly, often utilizing dynamic pricing and superior guest experiences.
- Strong performing properties (Top 25%) earn $1,098 or more, indicating effective management and desirable locations/amenities.
- Typical properties (Median) generate around $536 per month, representing the average market performance.
- Entry-level properties (Bottom 25%) see earnings around $301, often with potential for optimization.
Average Monthly Airbnb Earnings Trend in Alvarado
Alvarado Airbnb Occupancy Rate Trends (2026)
Maximize your bookings by understanding the Alvarado STR occupancy trends. Seasonal demand shifts significantly influence how often properties are booked. Typically, Aprilsees the highest demand (peak season occupancy), while January experiences the lowest (low season). Effective strategies, like adjusting minimum stays or offering promotions, can boost occupancy during slower periods. Here's how different property tiers perform in Alvarado:
- Best-in-class properties (Top 10%) achieve 62%+ occupancy, indicating high desirability and potentially optimized availability.
- Strong performing properties (Top 25%) maintain 39% or higher occupancy, suggesting good market fit and guest satisfaction.
- Typical properties (Median) have an occupancy rate around 22%.
- Entry-level properties (Bottom 25%) average 12% occupancy, potentially facing higher vacancy.
Average Monthly Occupancy Rate Trend in Alvarado
Average Daily Rate (ADR) Airbnb Trends in Alvarado (2026)
Effective short term rental pricing strategy in Alvarado involves understanding monthly ADR fluctuations. The Average Daily Rate (ADR) for Airbnb in Alvarado typically peaks in December and dips lowest during February. Leveraging Airbnb dynamic pricing tools or strategies based on this seasonality can significantly boost revenue. Here's a look at the typical nightly rates achieved:
- Best-in-class properties (Top 10%) command rates of $241+ per night, often due to premium features or locations.
- Strong performing properties (Top 25%) achieve nightly rates of $117 or more.
- Typical properties (Median) charge around $91 per night.
- Entry-level properties (Bottom 25%) earn around $67 per night.
Average Daily Rate (ADR) Trend by Month in Alvarado
Get Live Alvarado Market Intelligence 👇

Explore Real-time Analytics
Airbnb Seasonality Analysis & Trends in Alvarado (2026)
Peak Season (April, March, July)
- Revenue averages $1,290 per month
- Occupancy rates average 39.1%
- Daily rates average $113
Shoulder Season
- Revenue averages $989 per month
- Occupancy maintains around 29.5%
- Daily rates hold near $122
Low Season (January, May, October)
- Revenue drops to average $576 per month
- Occupancy decreases to average 16.7%
- Daily rates adjust to average $124
Seasonality Insights for Alvarado
- The Airbnb seasonality in Alvarado shows highly seasonal trends requiring careful strategy. While the sections above show seasonal averages, it's also insightful to look at the extremes:
- During the high season, the absolute peak month showcases Alvarado's highest earning potential, with monthly revenues capable of climbing to $1,385, occupancy reaching a high of 45.1%, and ADRs peaking at $139.
- Conversely, the slowest single month of the year, typically falling within the low season, marks the market's lowest point. In this month, revenue might dip to $432, occupancy could drop to 12.2%, and ADRs may adjust down to $108.
- Understanding both the seasonal averages and these monthly peaks and troughs in revenue, occupancy, and ADR is crucial for maximizing your Airbnb profit potential in Alvarado.
Seasonal Strategies for Maximizing Profit
- Peak Season: Maximize revenue through premium pricing and potentially longer minimum stays. Ensure high availability.
- Low Season: Offer competitive pricing, special promotions (e.g., extended stay discounts), and flexible cancellation policies. Target off-season travelers like remote workers or budget-conscious guests.
- Shoulder Seasons: Implement dynamic pricing that balances peak and low rates. Target weekend travelers or specific events. Offer slightly more flexible terms than peak season.
- Regularly analyze your own performance against these Alvarado seasonality benchmarks and adjust your pricing and availability strategy accordingly.
Best Areas for Airbnb Investment in Alvarado (2026)
Exploring the top neighborhoods for short-term rentals in Alvarado? This section highlights key areas, outlining why they are attractive for hosts and guests, along with notable local attractions. Consider these locations based on your target guest profile and investment strategy.
| Neighborhood / Area | Why Host Here? (Target Guests & Appeal) | Key Attractions & Landmarks |
|---|---|---|
| Centro Histórico | The historical center of Alvarado, featuring colonial architecture and cultural heritage. A prime spot for visitors looking to explore the rich history and local traditions of Veracruz. | Altar a la Patria, Plaza de la Cultura, Museo de la Ciudad, Church of San Juan Bautista, Callejón del Artista |
| Boca del Río | A coastal area near Alvarado known for its beautiful beaches and water activities. Ideal for tourists who enjoy sun, sand, and seafood dining. | Playa Dorada, Playa Mocambo, Aquarium of Veracruz, Teatro Fernando Gutiérrez Barrios, Boardwalk of Boca del Río |
| Laguna de Alvarado | A tranquil lagoon setting perfect for eco-tourism and nature lovers. Offers opportunities for fishing, bird watching, and exploring local biodiversity. | Laguna de Alvarado, Birdwatching tours, Fishing trips, Nature trails, Local seafood markets |
| Chachalacas | A beach area popular for its dunes and surf spots, attracting adventurous travelers looking for outdoor activities and vibrant beach experiences. | Chachalacas Beach, Sand Dunes, Water sports, Fishing, Ecotourism activities |
| San Juan de Ulúa | A historic fortress island that draws visitors interested in history and architecture. Offers educational tours and picturesque views. | Fortress of San Juan de Ulúa, Museums, Historical tours, Beautiful harbor views, Cultural events |
| Dona Rosa | A quaint local neighborhood known for its community vibe and traditional food offerings. Great for tourists wanting to experience local life. | Street food markets, Local craft shops, Cultural festivals, Traditional Veracruz music, Artisan workshops |
| Cerro Gordo | An area with picturesque views and hiking opportunities for travelers looking for nature and adventure, close to Alvarado. | Hiking trails, Nature reserves, Panoramic views of the coast, Wildlife observation, Outdoor picnic spots |
| Pueblo Viejo | A serene town offering a glimpse into the rural life of Veracruz. Ideal for guests looking for authenticity and relaxation away from the city. | Local markets, Cultural heritage sites, Traditional fiestas, Nature exploration, Rural excursions |
Understanding Airbnb License Requirements & STR Laws in Alvarado (2026)
While Alvarado, Veracruz, Mexico currently shows low STR regulations, specific Airbnb license requirements might still exist or change. Always verify the latest short term rental regulations and Airbnb license requirements directly with local government authorities for Alvarado to ensure full compliance before hosting.
(Source: AirROI data, 2026, finding no licensed listings among those analyzed)
Top Performing Airbnb Properties in Alvarado (2026)
Benchmark your potential! Explore examples of top-performing Airbnb properties in Alvaradobased on Trailing Twelve Month (TTM) revenue. Analyze their characteristics, revenue, occupancy rate, and ADR to understand what drives success in this market.

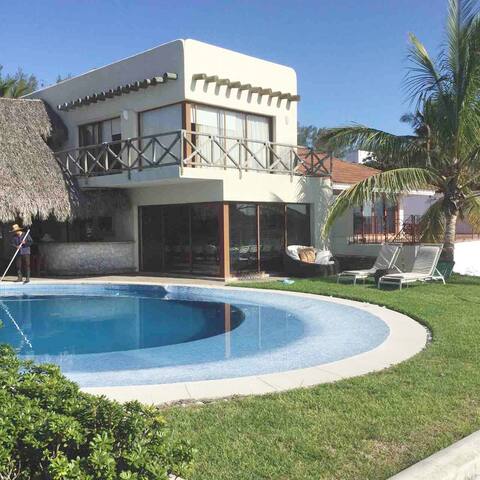
The Beautiful House on the Beach
Entire Place • 5 bedrooms
Casa de Campo Las Anitas Golf Club La Villa Rica
Entire Place • 5 bedrooms

Apartment in Alvarado
Entire Place • 2 bedrooms
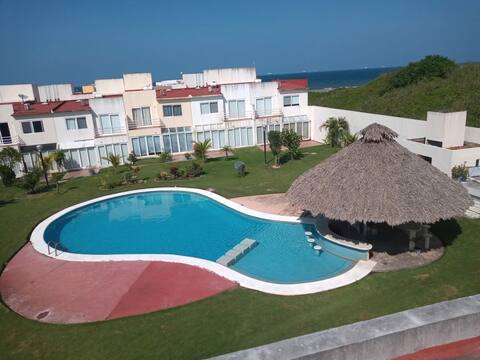
Beach house in Veracruz!
Entire Place • 3 bedrooms
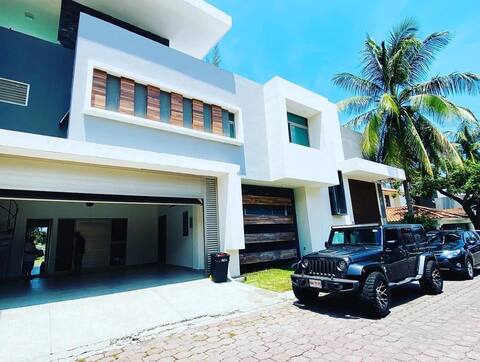
Spectacular new house in Veracruz Golf Club
Entire Place • 3 bedrooms

Apt. "Vista Azul", Veracruz
Entire Place • 2 bedrooms
Note: Performance varies based on location, size, amenities, seasonality, and management quality. Data reflects the past 12 months.
Top Performing Airbnb Hosts in Alvarado (2026)
Learn from the best! This table showcases top-performing Airbnb hosts in Alvarado based on the number of properties managed and estimated total revenue over the past year. Analyze their scale and performance metrics.
| Host Name | Properties | Grossing Revenue | Stay Reviews | Avg Rating |
|---|---|---|---|---|
| Efrain | 1 | $44,645 | 71 | 4.80/5.0 |
| Ana Maria | 1 | $28,561 | 57 | 4.79/5.0 |
| Daniela | 1 | $24,000 | 24 | 4.83/5.0 |
| Viridiana | 1 | $11,491 | 42 | 4.88/5.0 |
| Servicios De Arrendamiento Del | 2 | $11,364 | 36 | 4.72/5.0 |
| Jose | 2 | $10,977 | 25 | 4.88/5.0 |
| Jorge | 1 | $9,725 | 14 | 4.79/5.0 |
| Henry | 1 | $9,108 | 17 | 5.00/5.0 |
| Ernesto | 1 | $7,823 | 34 | 4.38/5.0 |
| Jamet | 1 | $7,085 | 10 | 5.00/5.0 |
Analyzing the strategies of top hosts, such as their property selection, pricing, and guest communication, can offer valuable lessons for optimizing your own Airbnb operations in Alvarado.
Dive Deeper: Advanced Alvarado STR Market Data (2026)
Ready to unlock more insights? AirROI provides access to advanced metrics and comprehensive Airbnb data for Alvarado. Explore detailed analytics beyond this report to refine your investment strategy, optimize pricing, and maximize your vacation rental profits.
Explore Advanced MetricsAlvarado Short-Term Rental Market Composition (2026): Property & Room Types
Room Type Distribution
Property Type Distribution
Market Composition Insights for Alvarado
- The Alvarado Airbnb market composition is heavily skewed towards Entire Home/Apt listings, which make up 100% of the 30 active rentals. This indicates strong guest preference for privacy and space.
- Looking at the property type distribution in Alvarado, Apartment/Condo properties are the most common (50%), reflecting the local real estate landscape.
- Houses represent a significant 43.3% portion, catering likely to families or larger groups.
- Smaller segments like hotel/boutique, outdoor/unique (combined 6.6%) offer potential for unique stay experiences.
Alvarado Airbnb Room Capacity Analysis (2026): Bedroom Distribution
Distribution of Listings by Number of Bedrooms
Room Capacity Insights for Alvarado
- The dominant room capacity in Alvarado is 2 bedrooms listings, making up 56.7% of the market. This suggests a strong demand for properties suitable for couples or solo travelers.
- Together, 2 bedrooms and 3 bedrooms properties represent 80.0% of the active Airbnb listings in Alvarado, indicating a high concentration in these sizes.
- A significant 33.3% of listings offer 3+ bedrooms, catering to larger groups and families seeking more space in Alvarado.
Alvarado Vacation Rental Guest Capacity Trends (2026)
Distribution of Listings by Guest Capacity
Guest Capacity Insights for Alvarado
- The most common guest capacity trend in Alvarado vacation rentals is listings accommodating 8+ guests (33.3%). This suggests the primary traveler segment is likely larger groups.
- Properties designed for 8+ guests and 6 guests dominate the Alvarado STR market, accounting for 66.6% of listings.
- 73.3% of properties accommodate 6+ guests, serving the market segment for larger families or group travel in Alvarado.
- On average, properties in Alvarado are equipped to host 6.3 guests.
Alvarado Airbnb Booking Patterns (2026): Available vs. Booked Days
Available Days Distribution
Booked Days Distribution
Booking Pattern Insights for Alvarado
- The most common availability pattern in Alvarado falls within the 271-366 days range, representing 76.7% of listings. This suggests many properties have significant open periods on their calendars.
- Approximately 93.4% of listings show high availability (181+ days open annually), indicating potential for increased bookings or specific owner usage patterns.
- For booked days, the 31-90 days range is most frequent in Alvarado (40%), reflecting common guest stay durations or potential owner blocking patterns.
- A notable 6.6% of properties secure long booking periods (181+ days booked per year), highlighting successful long-term rental strategies or significant owner usage.
Alvarado Airbnb Minimum Stay Requirements Analysis
Distribution of Listings by Minimum Night Requirement
1 Night
10 listings
33.3% of total
2 Nights
9 listings
30% of total
3 Nights
2 listings
6.7% of total
30+ Nights
9 listings
30% of total
Key Insights
- The most prevalent minimum stay requirement in Alvarado is 1 Night, adopted by 33.3% of listings. This highlights the market's preference for shorter, flexible bookings.
- A strong majority (63.3%) of the Alvarado Airbnb data shows acceptance of very short stays (1-2 nights), indicating a dynamic, high-turnover market.
- A significant segment (30%) caters to monthly stays (30+ nights) in Alvarado, pointing to opportunities in the extended-stay market.
Recommendations
- Align with the market by considering a 1 Night minimum stay, as 33.3% of Alvarado hosts use this setting.
- Explore offering discounts for stays of 30+ nights to attract the 30% of the market seeking extended stays.
- Adjust minimum nights based on seasonality – potentially shorter during low season and longer during peak demand periods in Alvarado.
Alvarado Airbnb Cancellation Policy Trends Analysis (2026)
Flexible
16 listings
55.2% of total
Moderate
6 listings
20.7% of total
Firm
3 listings
10.3% of total
Strict
4 listings
13.8% of total
Cancellation Policy Insights for Alvarado
- The prevailing Airbnb cancellation policy trend in Alvarado is Flexible, used by 55.2% of listings.
- The market strongly favors guest-friendly terms, with 75.9% of listings offering Flexible or Moderate policies. This suggests guests in Alvarado may expect booking flexibility.
Recommendations for Hosts
- Consider adopting a Flexible policy to align with the 55.2% market standard in Alvarado.
- Given the high prevalence of Flexible policies (55.2%), offering this can enhance booking appeal, especially during shoulder seasons.
- Using a Strict policy might deter some guests, as only 13.8% of listings use it. Evaluate if potential revenue protection outweighs possible lower booking rates.
- Regularly review your cancellation policy against competitors and market demand shifts in Alvarado.
Alvarado STR Booking Lead Time Analysis (2026)
Average Booking Lead Time by Month
Booking Lead Time Insights for Alvarado
- The overall average booking lead time for vacation rentals in Alvarado is 18 days.
- Guests book furthest in advance for stays during December (average 42 days), likely coinciding with peak travel demand or local events.
- The shortest booking windows occur for stays in February (average 6 days), indicating more last-minute travel plans during this time.
- Seasonally, Winter (26 days avg.) sees the longest lead times, while Spring (17 days avg.) has the shortest, reflecting typical travel planning cycles.
Recommendations for Hosts
- Use the overall average lead time (18 days) as a baseline for your pricing and availability strategy in Alvarado.
- For December stays, consider implementing length-of-stay discounts or slightly higher rates for bookings made less than 42 days out to capitalize on advance planning.
- During February, focus on last-minute booking availability and promotions, as guests book with very short notice (6 days avg.).
- Target marketing efforts for the Winter season well in advance (at least 26 days) to capture early planners.
- Monitor your own booking lead times against these Alvarado averages to identify opportunities for dynamic pricing adjustments.
Popular & Essential Airbnb Amenities in Alvarado (2026)
Amenity Prevalence
Amenity Insights for Alvarado
- Essential amenities in Alvarado that guests expect include: Kitchen, Air conditioning, TV, Free parking on premises. Lacking these (any) could significantly impact bookings.
- Popular amenities like Wifi, Cooking basics, Iron are common but not universal. Offering these can provide a competitive edge.
- A pool is a highly desired but not standard amenity, making it a key feature for attracting guests seeking leisure in Alvarado.
- Warning: Wifi is not universally provided but is considered essential globally. Ensure reliable Wifi is offered.
Recommendations for Hosts
- Ensure your listing includes all essential amenities for Alvarado: Kitchen, Air conditioning, TV, Free parking on premises.
- Prioritize adding missing essentials: Air conditioning, TV, Free parking on premises.
- Consider adding popular differentiators like Wifi or Cooking basics to increase appeal.
- Highlight unique or less common amenities you offer (e.g., hot tub, dedicated workspace, EV charger) in your listing description and photos.
- Regularly check competitor amenities in Alvarado to stay competitive.
Alvarado Airbnb Guest Demographics & Profile Analysis (2026)
Guest Profile Summary for Alvarado
- The typical guest profile for Airbnb in Alvarado consists of primarily domestic travelers (93%), often arriving from nearby Mexico City, typically belonging to the Post-2000s (Gen Z/Alpha) group (50%), primarily speaking Spanish or English.
- Domestic travelers account for 92.7% of guests.
- Key international markets include Mexico (92.7%) and United States (6.5%).
- Top languages spoken are Spanish (50.5%) followed by English (36.1%).
- A significant demographic segment is the Post-2000s (Gen Z/Alpha) group, representing 50% of guests.
Recommendations for Hosts
- Target domestic marketing efforts towards travelers from Mexico City and Puebla.
- Tailor amenities and listing descriptions to appeal to the dominant Post-2000s (Gen Z/Alpha) demographic (e.g., highlight fast WiFi, smart home features, local guides).
- Highlight unique local experiences or amenities relevant to the primary guest profile.
- Consider seasonal promotions aligned with peak travel times for key origin markets.
Nearby Short-Term Rental Market Comparison
How does the Alvarado Airbnb market stack up against its neighbors? Compare key performance metrics like average monthly revenue, ADR, and occupancy rates in surrounding areas to understand the broader regional STR landscape.
| Market | Active Properties | Monthly Revenue | Daily Rate | Avg. Occupancy |
|---|---|---|---|---|
| La Guadalupe | 19 | $1,791 | $216.30 | 31% |
| Costa Esmeralda | 18 | $1,183 | $182.50 | 26% |
| Monte Gordo | 29 | $1,065 | $166.24 | 24% |
| Playa de Chachalacas | 70 | $1,064 | $158.49 | 26% |
| Jalcomulco | 26 | $793 | $110.40 | 24% |
| Mandinga y Matoza | 52 | $757 | $113.41 | 29% |
| Veracruz | 283 | $735 | $93.45 | 33% |
| Tecolutla | 110 | $709 | $112.07 | 23% |
| Boca del Río | 624 | $708 | $88.52 | 34% |
| Casitas | 30 | $700 | $186.29 | 18% |