Tonatico Airbnb Market Analysis 2025: Short Term Rental Data & Vacation Rental Statistics in Tonatico, Mexico
Is Airbnb profitable in Tonatico in 2025? Explore comprehensive Airbnb analytics for Tonatico, Tonatico, Mexico to uncover income potential. This 2025 STR market report for Tonatico, based on AirROI data from November 2024 to October 2025, reveals key trends in the niche market of 19 active listings.
Whether you're considering an Airbnb investment in Tonatico, optimizing your existing vacation rental, or exploring rental arbitrage opportunities, understanding the Tonatico Airbnb data is crucial. Leveraging the low regulation environment is key to maximizing your short term rental income potential. Let's dive into the specifics.
Key Tonatico Airbnb Performance Metrics Overview
Monthly Airbnb Revenue Variations & Income Potential in Tonatico (2025)
Understanding the monthly revenue variations for Airbnb listings in Tonatico is key to maximizing your short term rental income potential. Seasonality significantly impacts earnings. Our analysis, based on data from the past 12 months, shows that the peak revenue month for STRs in Tonatico is typically April, while October often presents the lowest earnings, highlighting opportunities for strategic pricing adjustments during shoulder and low seasons. Explore the typical Airbnb income in Tonatico across different performance tiers:
- Best-in-class properties (Top 10%) achieve $2,472+ monthly, often utilizing dynamic pricing and superior guest experiences.
- Strong performing properties (Top 25%) earn $1,971 or more, indicating effective management and desirable locations/amenities.
- Typical properties (Median) generate around $1,077 per month, representing the average market performance.
- Entry-level properties (Bottom 25%) see earnings around $301, often with potential for optimization.
Average Monthly Airbnb Earnings Trend in Tonatico
Tonatico Airbnb Occupancy Rate Trends (2025)
Maximize your bookings by understanding the Tonatico STR occupancy trends. Seasonal demand shifts significantly influence how often properties are booked. Typically, Aprilsees the highest demand (peak season occupancy), while October experiences the lowest (low season). Effective strategies, like adjusting minimum stays or offering promotions, can boost occupancy during slower periods. Here's how different property tiers perform in Tonatico:
- Best-in-class properties (Top 10%) achieve 44%+ occupancy, indicating high desirability and potentially optimized availability.
- Strong performing properties (Top 25%) maintain 38% or higher occupancy, suggesting good market fit and guest satisfaction.
- Typical properties (Median) have an occupancy rate around 26%.
- Entry-level properties (Bottom 25%) average 14% occupancy, potentially facing higher vacancy.
Average Monthly Occupancy Rate Trend in Tonatico
Average Daily Rate (ADR) Airbnb Trends in Tonatico (2025)
Effective short term rental pricing strategy in Tonatico involves understanding monthly ADR fluctuations. The Average Daily Rate (ADR) for Airbnb in Tonatico typically peaks in October and dips lowest during March. Leveraging Airbnb dynamic pricing tools or strategies based on this seasonality can significantly boost revenue. Here's a look at the typical nightly rates achieved:
- Best-in-class properties (Top 10%) command rates of $285+ per night, often due to premium features or locations.
- Strong performing properties (Top 25%) achieve nightly rates of $191 or more.
- Typical properties (Median) charge around $101 per night.
- Entry-level properties (Bottom 25%) earn around $61 per night.
Average Daily Rate (ADR) Trend by Month in Tonatico
Get Live Tonatico Market Intelligence 👇

Explore Real-time Analytics
Airbnb Seasonality Analysis & Trends in Tonatico (2025)
Peak Season (April, December, July)
- Revenue averages $1,670 per month
- Occupancy rates average 32.5%
- Daily rates average $165
Shoulder Season
- Revenue averages $1,240 per month
- Occupancy maintains around 28.4%
- Daily rates hold near $165
Low Season (June, October, November)
- Revenue drops to average $851 per month
- Occupancy decreases to average 18.6%
- Daily rates adjust to average $175
Seasonality Insights for Tonatico
- The Airbnb seasonality in Tonatico shows highly seasonal trends requiring careful strategy. While the sections above show seasonal averages, it's also insightful to look at the extremes:
- During the high season, the absolute peak month showcases Tonatico's highest earning potential, with monthly revenues capable of climbing to $2,081, occupancy reaching a high of 40.9%, and ADRs peaking at $188.
- Conversely, the slowest single month of the year, typically falling within the low season, marks the market's lowest point. In this month, revenue might dip to $543, occupancy could drop to 11.5%, and ADRs may adjust down to $152.
- Understanding both the seasonal averages and these monthly peaks and troughs in revenue, occupancy, and ADR is crucial for maximizing your Airbnb profit potential in Tonatico.
Seasonal Strategies for Maximizing Profit
- Peak Season: Maximize revenue through premium pricing and potentially longer minimum stays. Ensure high availability.
- Low Season: Offer competitive pricing, special promotions (e.g., extended stay discounts), and flexible cancellation policies. Target off-season travelers like remote workers or budget-conscious guests.
- Shoulder Seasons: Implement dynamic pricing that balances peak and low rates. Target weekend travelers or specific events. Offer slightly more flexible terms than peak season.
- Regularly analyze your own performance against these Tonatico seasonality benchmarks and adjust your pricing and availability strategy accordingly.
Best Areas for Airbnb Investment in Tonatico (2025)
Exploring the top neighborhoods for short-term rentals in Tonatico? This section highlights key areas, outlining why they are attractive for hosts and guests, along with notable local attractions. Consider these locations based on your target guest profile and investment strategy.
| Neighborhood / Area | Why Host Here? (Target Guests & Appeal) | Key Attractions & Landmarks |
|---|---|---|
| Centro | The heart of Tonatico, Centro is vibrant with local markets, restaurants, and cultural sites. It attracts both local and visiting tourists looking to experience the authentic lifestyle of Tonatico. | Main Square, Church of Tonatico, Local artisan markets, Street food vendors, Cafés and restaurants |
| Termal Tonatico | Known for its hot springs, this area is perfect for relaxation and wellness tourism. Visitors come to enjoy the therapeutic benefits of the thermal waters, making it a prime location for wellness-focused Airbnb hosts. | Termal spas, Hot springs resorts, Wellness retreats, Scenic walking paths, Relaxation areas |
| La Malinche | A scenic area known for its natural beauty and outdoor activities. It attracts nature lovers and tourists looking for adventures such as hiking and bird watching. | Hiking trails, Natural parks, Bird watching spots, Photography opportunities, Scenic views |
| El Salto | A popular local attraction featuring beautiful waterfalls. This area draws visitors looking for nature excursions and picturesque views, making it a great spot for family and outdoor-oriented travellers. | Waterfalls, Picnic areas, Hiking routes, Photography spots, Nature trails |
| Barranca de los Laureles | A beautiful canyon area perfect for adventure tourism. It offers plenty of options for hiking and exploring the rugged terrain, appealing to those who love outdoor challenges. | Canyon views, Hiking opportunities, Wildlife observation, Photography spots, Adventure tours |
| Las Estacas | An ecological park with a stunning river and recreational activities. It's a family-friendly location that promotes outdoor fun, making it attractive to groups and families seeking adventure and leisure. | Recreational river, Swimming areas, Picnic facilities, Camping sites, Outdoor sports |
| Jardines de la Cultura | This area hosts cultural events and gatherings, making it popular with tourists interested in local culture and festivities. It's a great spot for those looking to engage with Tonatico's community life. | Cultural events, Local festivals, Art exhibitions, Workshops, Community gatherings |
| Pueblo Mágico | As a designated 'Magical Town', this area is rich in history and culture. It attracts tourists seeking to explore the charming streets, historical architecture, and local stories. | Historic sites, Cultural heritage, Artisan shops, Culinary experiences, Community events |
Understanding Airbnb License Requirements & STR Laws in Tonatico (2025)
While Tonatico, Tonatico, Mexico currently shows low STR regulations, specific Airbnb license requirements might still exist or change. Always verify the latest short term rental regulations and Airbnb license requirements directly with local government authorities for Tonatico to ensure full compliance before hosting.
(Source: AirROI data, 2025, finding no licensed listings among those analyzed)
Top Performing Airbnb Properties in Tonatico (2025)
Benchmark your potential! Explore examples of top-performing Airbnb properties in Tonaticobased on Trailing Twelve Month (TTM) revenue. Analyze their characteristics, revenue, occupancy rate, and ADR to understand what drives success in this market.
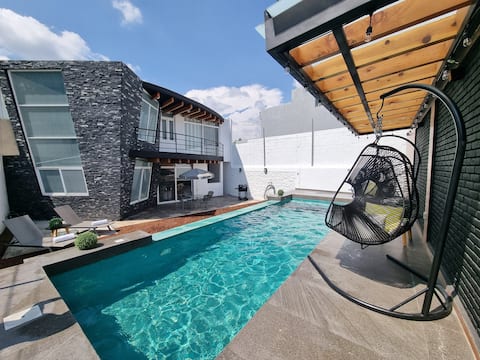
Centrally located Tonatico house with pool
Entire Place • 4 bedrooms
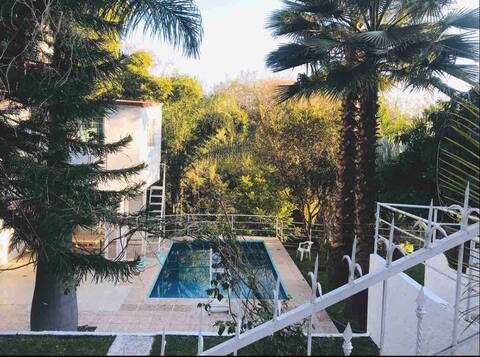
“Vamos a Tona” Villa Completa
Entire Place • 4 bedrooms
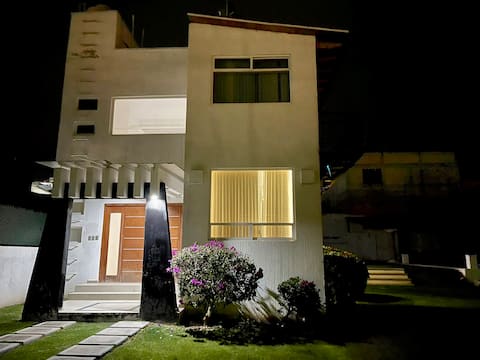
Casa Tonatico
Entire Place • 4 bedrooms

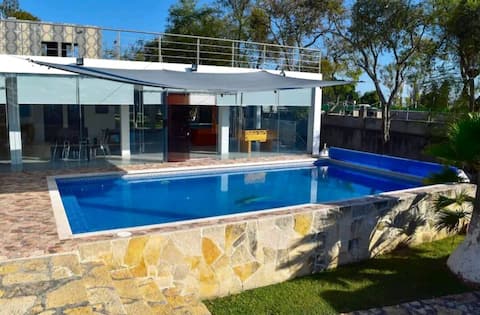
Perfect house to stay with the family in Tonatico
Entire Place • 4 bedrooms

“Vamos a Tona” Rest and Relaxation
Entire Place • 3 bedrooms
Amazing vacation home
Entire Place • 3 bedrooms
Note: Performance varies based on location, size, amenities, seasonality, and management quality. Data reflects the past 12 months.
Top Performing Airbnb Hosts in Tonatico (2025)
Learn from the best! This table showcases top-performing Airbnb hosts in Tonatico based on the number of properties managed and estimated total revenue over the past year. Analyze their scale and performance metrics.
| Host Name | Properties | Grossing Revenue | Stay Reviews | Avg Rating |
|---|---|---|---|---|
| Noe | 2 | $44,124 | 75 | 4.57/5.0 |
| José | 1 | $30,690 | 7 | 4.71/5.0 |
| Raquel | 1 | $22,338 | 15 | 4.47/5.0 |
| Chris | 1 | $22,264 | 17 | 4.65/5.0 |
| La Tija Azul | 1 | $20,036 | 1 | Not Rated |
| Ignacio | 1 | $15,690 | 115 | 4.71/5.0 |
| Luz | 1 | $9,128 | 36 | 4.72/5.0 |
| Edith | 1 | $8,433 | 5 | 4.80/5.0 |
| Luis | 2 | $6,798 | 67 | 4.79/5.0 |
| Roger | 2 | $5,290 | 45 | 4.94/5.0 |
Analyzing the strategies of top hosts, such as their property selection, pricing, and guest communication, can offer valuable lessons for optimizing your own Airbnb operations in Tonatico.
Dive Deeper: Advanced Tonatico STR Market Data (2025)
Ready to unlock more insights? AirROI provides access to advanced metrics and comprehensive Airbnb data for Tonatico. Explore detailed analytics beyond this report to refine your investment strategy, optimize pricing, and maximize your vacation rental profits.
Explore Advanced MetricsTonatico Short-Term Rental Market Composition (2025): Property & Room Types
Room Type Distribution
Property Type Distribution
Market Composition Insights for Tonatico
- The Tonatico Airbnb market composition is heavily skewed towards Entire Home/Apt listings, which make up 78.9% of the 19 active rentals. This indicates strong guest preference for privacy and space.
- Looking at the property type distribution in Tonatico, House properties are the most common (42.1%), reflecting the local real estate landscape.
- Houses represent a significant 42.1% portion, catering likely to families or larger groups.
- The presence of 21.1% Hotel/Boutique listings indicates integration with traditional hospitality.
Tonatico Airbnb Room Capacity Analysis (2025): Bedroom Distribution
Distribution of Listings by Number of Bedrooms
Room Capacity Insights for Tonatico
- The dominant room capacity in Tonatico is 1 bedroom listings, making up 31.6% of the market. This suggests a strong demand for properties suitable for couples or solo travelers.
- Together, 1 bedroom and 2 bedrooms properties represent 63.2% of the active Airbnb listings in Tonatico, indicating a high concentration in these sizes.
- A significant 36.9% of listings offer 3+ bedrooms, catering to larger groups and families seeking more space in Tonatico.
Tonatico Vacation Rental Guest Capacity Trends (2025)
Distribution of Listings by Guest Capacity
Guest Capacity Insights for Tonatico
- The most common guest capacity trend in Tonatico vacation rentals is listings accommodating 8+ guests (42.1%). This suggests the primary traveler segment is likely larger groups.
- Properties designed for 8+ guests and 4 guests dominate the Tonatico STR market, accounting for 68.4% of listings.
- 47.4% of properties accommodate 6+ guests, serving the market segment for larger families or group travel in Tonatico.
- On average, properties in Tonatico are equipped to host 5.3 guests.
Tonatico Airbnb Booking Patterns (2025): Available vs. Booked Days
Available Days Distribution
Booked Days Distribution
Booking Pattern Insights for Tonatico
- The most common availability pattern in Tonatico falls within the 271-366 days range, representing 73.7% of listings. This suggests many properties have significant open periods on their calendars.
- Approximately 100.0% of listings show high availability (181+ days open annually), indicating potential for increased bookings or specific owner usage patterns.
- For booked days, the 31-90 days range is most frequent in Tonatico (42.1%), reflecting common guest stay durations or potential owner blocking patterns.
Tonatico Airbnb Minimum Stay Requirements Analysis
Distribution of Listings by Minimum Night Requirement
1 Night
16 listings
84.2% of total
2 Nights
2 listings
10.5% of total
30+ Nights
1 listings
5.3% of total
Key Insights
- The most prevalent minimum stay requirement in Tonatico is 1 Night, adopted by 84.2% of listings. This highlights the market's preference for shorter, flexible bookings.
- A strong majority (94.7%) of the Tonatico Airbnb data shows acceptance of very short stays (1-2 nights), indicating a dynamic, high-turnover market.
Recommendations
- Align with the market by considering a 1 Night minimum stay, as 84.2% of Tonatico hosts use this setting.
- Explore offering discounts for stays of 30+ nights to attract the 5.3% of the market seeking extended stays.
- Adjust minimum nights based on seasonality – potentially shorter during low season and longer during peak demand periods in Tonatico.
Tonatico Airbnb Cancellation Policy Trends Analysis (2025)
Flexible
11 listings
57.9% of total
Moderate
5 listings
26.3% of total
Firm
2 listings
10.5% of total
Strict
1 listings
5.3% of total
Cancellation Policy Insights for Tonatico
- The prevailing Airbnb cancellation policy trend in Tonatico is Flexible, used by 57.9% of listings.
- The market strongly favors guest-friendly terms, with 84.2% of listings offering Flexible or Moderate policies. This suggests guests in Tonatico may expect booking flexibility.
- Strict cancellation policies are quite rare (5.3%), potentially making listings with this policy less competitive unless justified by high demand or property type.
Recommendations for Hosts
- Consider adopting a Flexible policy to align with the 57.9% market standard in Tonatico.
- Given the high prevalence of Flexible policies (57.9%), offering this can enhance booking appeal, especially during shoulder seasons.
- Using a Strict policy might deter some guests, as only 5.3% of listings use it. Evaluate if potential revenue protection outweighs possible lower booking rates.
- Regularly review your cancellation policy against competitors and market demand shifts in Tonatico.
Tonatico STR Booking Lead Time Analysis (2025)
Average Booking Lead Time by Month
Booking Lead Time Insights for Tonatico
- The overall average booking lead time for vacation rentals in Tonatico is 27 days.
- Guests book furthest in advance for stays during September (average 56 days), likely coinciding with peak travel demand or local events.
- The shortest booking windows occur for stays in February (average 8 days), indicating more last-minute travel plans during this time.
- Seasonally, Fall (29 days avg.) sees the longest lead times, while Summer (19 days avg.) has the shortest, reflecting typical travel planning cycles.
Recommendations for Hosts
- Use the overall average lead time (27 days) as a baseline for your pricing and availability strategy in Tonatico.
- For September stays, consider implementing length-of-stay discounts or slightly higher rates for bookings made less than 56 days out to capitalize on advance planning.
- During February, focus on last-minute booking availability and promotions, as guests book with very short notice (8 days avg.).
- Target marketing efforts for the Fall season well in advance (at least 29 days) to capture early planners.
- Monitor your own booking lead times against these Tonatico averages to identify opportunities for dynamic pricing adjustments.
Popular & Essential Airbnb Amenities in Tonatico (2025)
Amenity Prevalence
Amenity Insights for Tonatico
- Popular amenities like Wifi, Hot water, Kitchen are common but not universal. Offering these can provide a competitive edge.
- Warning: Wifi is not universally provided but is considered essential globally. Ensure reliable Wifi is offered.
Recommendations for Hosts
- Consider adding popular differentiators like Wifi or Hot water to increase appeal.
- Highlight unique or less common amenities you offer (e.g., hot tub, dedicated workspace, EV charger) in your listing description and photos.
- Regularly check competitor amenities in Tonatico to stay competitive.
Tonatico Airbnb Guest Demographics & Profile Analysis (2025)
Guest Profile Summary for Tonatico
- The typical guest profile for Airbnb in Tonatico consists of primarily domestic travelers (95%), often arriving from nearby Mexico City, typically belonging to the Post-2000s (Gen Z/Alpha) group (50%), primarily speaking Spanish or English.
- Domestic travelers account for 95.0% of guests.
- Key international markets include Mexico (95%) and United States (5%).
- Top languages spoken are Spanish (56%) followed by English (38%).
- A significant demographic segment is the Post-2000s (Gen Z/Alpha) group, representing 50% of guests.
Recommendations for Hosts
- Target domestic marketing efforts towards travelers from Mexico City and Toluca.
- Tailor amenities and listing descriptions to appeal to the dominant Post-2000s (Gen Z/Alpha) demographic (e.g., highlight fast WiFi, smart home features, local guides).
- Highlight unique local experiences or amenities relevant to the primary guest profile.
- Consider seasonal promotions aligned with peak travel times for key origin markets.
Nearby Short-Term Rental Market Comparison
How does the Tonatico Airbnb market stack up against its neighbors? Compare key performance metrics like average monthly revenue, ADR, and occupancy rates in surrounding areas to understand the broader regional STR landscape.
| Market | Active Properties | Monthly Revenue | Daily Rate | Avg. Occupancy |
|---|---|---|---|---|
| El Santuario | 45 | $2,651 | $447.37 | 26% |
| Yautepec de Zaragoza | 12 | $2,522 | $295.92 | 29% |
| Cerro Gordo | 42 | $2,499 | $434.78 | 23% |
| Tepeji del Rio de Ocampo | 12 | $2,167 | $335.49 | 25% |
| Rancho San Diego | 19 | $2,091 | $276.42 | 28% |
| Avandaro | 223 | $2,077 | $419.51 | 25% |
| Xalmolonco | 23 | $2,021 | $291.89 | 29% |
| La Ladrillera | 30 | $1,868 | $272.16 | 28% |
| Lomas de Cocoyoc | 138 | $1,718 | $252.98 | 28% |
| Atlatlahucan | 76 | $1,704 | $288.64 | 25% |