Reynosa Airbnb Market Analysis 2026: Short Term Rental Data & Vacation Rental Statistics in Tamaulipas, Mexico
Is Airbnb profitable in Reynosa in 2026? Explore comprehensive Airbnb analytics for Reynosa, Tamaulipas, Mexico to uncover income potential. This 2026 STR market report for Reynosa, based on AirROI data from February 2025 to January 2026, reveals key trends in the niche market of 164 active listings.
Whether you're considering an Airbnb investment in Reynosa, optimizing your existing vacation rental, or exploring rental arbitrage opportunities, understanding the Reynosa Airbnb data is crucial. Leveraging the low regulation environment is key to maximizing your short term rental income potential. Let's dive into the specifics.
Key Reynosa Airbnb Performance Metrics Overview
Monthly Airbnb Revenue Variations & Income Potential in Reynosa (2026)
Understanding the monthly revenue variations for Airbnb listings in Reynosa is key to maximizing your short term rental income potential. Seasonality significantly impacts earnings. Our analysis, based on data from the past 12 months, shows that the peak revenue month for STRs in Reynosa is typically December, while January often presents the lowest earnings, highlighting opportunities for strategic pricing adjustments during shoulder and low seasons. Explore the typical Airbnb income in Reynosa across different performance tiers:
- Best-in-class properties (Top 10%) achieve $1,114+ monthly, often utilizing dynamic pricing and superior guest experiences.
- Strong performing properties (Top 25%) earn $687 or more, indicating effective management and desirable locations/amenities.
- Typical properties (Median) generate around $341 per month, representing the average market performance.
- Entry-level properties (Bottom 25%) see earnings around $147, often with potential for optimization.
Average Monthly Airbnb Earnings Trend in Reynosa
Reynosa Airbnb Occupancy Rate Trends (2026)
Maximize your bookings by understanding the Reynosa STR occupancy trends. Seasonal demand shifts significantly influence how often properties are booked. Typically, Julysees the highest demand (peak season occupancy), while January experiences the lowest (low season). Effective strategies, like adjusting minimum stays or offering promotions, can boost occupancy during slower periods. Here's how different property tiers perform in Reynosa:
- Best-in-class properties (Top 10%) achieve 70%+ occupancy, indicating high desirability and potentially optimized availability.
- Strong performing properties (Top 25%) maintain 47% or higher occupancy, suggesting good market fit and guest satisfaction.
- Typical properties (Median) have an occupancy rate around 27%.
- Entry-level properties (Bottom 25%) average 12% occupancy, potentially facing higher vacancy.
Average Monthly Occupancy Rate Trend in Reynosa
Average Daily Rate (ADR) Airbnb Trends in Reynosa (2026)
Effective short term rental pricing strategy in Reynosa involves understanding monthly ADR fluctuations. The Average Daily Rate (ADR) for Airbnb in Reynosa typically peaks in December and dips lowest during March. Leveraging Airbnb dynamic pricing tools or strategies based on this seasonality can significantly boost revenue. Here's a look at the typical nightly rates achieved:
- Best-in-class properties (Top 10%) command rates of $77+ per night, often due to premium features or locations.
- Strong performing properties (Top 25%) achieve nightly rates of $56 or more.
- Typical properties (Median) charge around $42 per night.
- Entry-level properties (Bottom 25%) earn around $32 per night.
Average Daily Rate (ADR) Trend by Month in Reynosa
Get Live Reynosa Market Intelligence 👇

Explore Real-time Analytics
Airbnb Seasonality Analysis & Trends in Reynosa (2026)
Peak Season (December, July, June)
- Revenue averages $572 per month
- Occupancy rates average 35.5%
- Daily rates average $48
Shoulder Season
- Revenue averages $486 per month
- Occupancy maintains around 31.1%
- Daily rates hold near $48
Low Season (January, February, April)
- Revenue drops to average $423 per month
- Occupancy decreases to average 30.6%
- Daily rates adjust to average $46
Seasonality Insights for Reynosa
- The Airbnb seasonality in Reynosa shows moderate seasonality with distinct peak and low periods. While the sections above show seasonal averages, it's also insightful to look at the extremes:
- During the high season, the absolute peak month showcases Reynosa's highest earning potential, with monthly revenues capable of climbing to $625, occupancy reaching a high of 36.1%, and ADRs peaking at $53.
- Conversely, the slowest single month of the year, typically falling within the low season, marks the market's lowest point. In this month, revenue might dip to $418, occupancy could drop to 25.8%, and ADRs may adjust down to $42.
- Understanding both the seasonal averages and these monthly peaks and troughs in revenue, occupancy, and ADR is crucial for maximizing your Airbnb profit potential in Reynosa.
Seasonal Strategies for Maximizing Profit
- Peak Season: Maximize revenue through premium pricing and potentially longer minimum stays. Ensure high availability.
- Low Season: Offer competitive pricing, special promotions (e.g., extended stay discounts), and flexible cancellation policies. Target off-season travelers like remote workers or budget-conscious guests.
- Shoulder Seasons: Implement dynamic pricing that balances peak and low rates. Target weekend travelers or specific events. Offer slightly more flexible terms than peak season.
- Regularly analyze your own performance against these Reynosa seasonality benchmarks and adjust your pricing and availability strategy accordingly.
Best Areas for Airbnb Investment in Reynosa (2026)
Exploring the top neighborhoods for short-term rentals in Reynosa? This section highlights key areas, outlining why they are attractive for hosts and guests, along with notable local attractions. Consider these locations based on your target guest profile and investment strategy.
| Neighborhood / Area | Why Host Here? (Target Guests & Appeal) | Key Attractions & Landmarks |
|---|---|---|
| Centro Histórico | The historic center of Reynosa, rich in culture and history. It's a vibrant area with a mix of local shops, restaurants, and cultural sites, attracting tourists interested in local heritage. | Plaza Principal, Iglesia de Nuestra Señora de Guadalupe, Museo Hispanoamericano, Catedral de Reynosa, Teatro Principal |
| Reynosa Norte | A residential area popular among families and long-term visitors. Close to amenities and services, making it convenient for guests. It also offers a more local feel. | Parque de las Américas, Plaza Periférico, Centro Comercial Plaza Galerías, Universidad Politécnica de Reynosa, Cinemex |
| Las Fuentes | A family-friendly neighborhood known for its parks and green spaces. Great for travelers looking for a quieter environment while still being close to the city. | Parque Las Fuentes, Parque Zacatecas, Cocula, local restaurants and markets |
| San Juan | An emerging area that is gaining popularity due to new developments and restaurants. It's suitable for business travelers and families who need space. | Centro Comercial San Juan, local dining options, Reynosa Golf Club, Plaza San Juan |
| La Cañada | A suburban area with a mix of residential and commercial properties. It's growing in popularity for visitors looking for a peaceful stay with easy access to urban amenities. | Cerro del Piojo, Parque las Brisas, Cinemex Cañada, Reynosa Country Club |
| Pradera Dorada | A developing neighborhood that is becoming a hub for young professionals and families. Offers modern housing and accessibility to shopping and dining. | Plaza Pradera, local cafes and bistros, parks, fitness centers |
| El Anhelo | A relatively newer neighborhood that is attracting investments and families due to its modern facilities and community centers. Offers a suburban feel with urban conveniences. | Parque Anhelo, shopping areas, proximity to schools, restaurants |
| Margaritas | An area known for its affordability and access to local attractions, perfect for budget travelers and those seeking to experience daily life in Reynosa. | Las Margaritas Park, local churches, community events, street markets |
Understanding Airbnb License Requirements & STR Laws in Reynosa (2026)
While Reynosa, Tamaulipas, Mexico currently shows low STR regulations, specific Airbnb license requirements might still exist or change. Always verify the latest short term rental regulations and Airbnb license requirements directly with local government authorities for Reynosa to ensure full compliance before hosting.
(Source: AirROI data, 2026, based on 1% licensed listings)
Top Performing Airbnb Properties in Reynosa (2026)
Benchmark your potential! Explore examples of top-performing Airbnb properties in Reynosabased on Trailing Twelve Month (TTM) revenue. Analyze their characteristics, revenue, occupancy rate, and ADR to understand what drives success in this market.

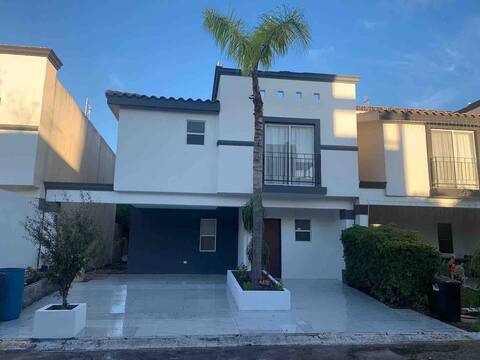
Modern House in a private residential area with a pool
Entire Place • N/A
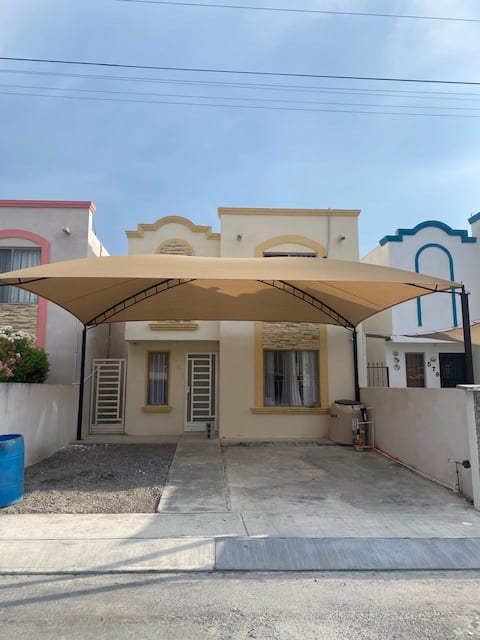
Comfortable, safe and private house
Entire Place • 3 bedrooms

White house
Entire Place • 3 bedrooms
Beautiful house in a private community with 3 bedrooms.
Entire Place • 3 bedrooms

Exclusive Place /10PX/8 Beds/ Wi-Fi / Parking
Entire Place • 3 bedrooms

Casa Tito's
Entire Place • 2 bedrooms
Note: Performance varies based on location, size, amenities, seasonality, and management quality. Data reflects the past 12 months.
Top Performing Airbnb Hosts in Reynosa (2026)
Learn from the best! This table showcases top-performing Airbnb hosts in Reynosa based on the number of properties managed and estimated total revenue over the past year. Analyze their scale and performance metrics.
| Host Name | Properties | Grossing Revenue | Stay Reviews | Avg Rating |
|---|---|---|---|---|
| Julian Rafael | 12 | $66,886 | 225 | 4.80/5.0 |
| Gustavo Adrian | 7 | $62,996 | 311 | 4.95/5.0 |
| Araceli | 2 | $19,673 | 31 | 4.89/5.0 |
| Demetrio | 5 | $18,692 | 172 | 4.84/5.0 |
| Liliana | 7 | $18,118 | 85 | 4.87/5.0 |
| Silvia | 2 | $18,093 | 176 | 4.88/5.0 |
| Casas Puertas | 7 | $17,408 | 468 | 4.58/5.0 |
| Eduardo | 5 | $17,263 | 632 | 4.93/5.0 |
| Nidia | 1 | $14,237 | 108 | 4.93/5.0 |
| Omar | 6 | $13,688 | 119 | 4.71/5.0 |
Analyzing the strategies of top hosts, such as their property selection, pricing, and guest communication, can offer valuable lessons for optimizing your own Airbnb operations in Reynosa.
Dive Deeper: Advanced Reynosa STR Market Data (2026)
Ready to unlock more insights? AirROI provides access to advanced metrics and comprehensive Airbnb data for Reynosa. Explore detailed analytics beyond this report to refine your investment strategy, optimize pricing, and maximize your vacation rental profits.
Explore Advanced MetricsReynosa Short-Term Rental Market Composition (2026): Property & Room Types
Room Type Distribution
Property Type Distribution
Market Composition Insights for Reynosa
- The Reynosa Airbnb market composition is heavily skewed towards Entire Home/Apt listings, which make up 85.4% of the 164 active rentals. This indicates strong guest preference for privacy and space.
- Looking at the property type distribution in Reynosa, House properties are the most common (54.3%), reflecting the local real estate landscape.
- Houses represent a significant 54.3% portion, catering likely to families or larger groups.
- The presence of 9.1% Hotel/Boutique listings indicates integration with traditional hospitality.
- Smaller segments like others (combined 2.4%) offer potential for unique stay experiences.
Reynosa Airbnb Room Capacity Analysis (2026): Bedroom Distribution
Distribution of Listings by Number of Bedrooms
Room Capacity Insights for Reynosa
- The dominant room capacity in Reynosa is 2 bedrooms listings, making up 37.8% of the market. This suggests a strong demand for properties suitable for couples or solo travelers.
- Together, 2 bedrooms and 1 bedroom properties represent 70.7% of the active Airbnb listings in Reynosa, indicating a high concentration in these sizes.
Reynosa Vacation Rental Guest Capacity Trends (2026)
Distribution of Listings by Guest Capacity
Guest Capacity Insights for Reynosa
- The most common guest capacity trend in Reynosa vacation rentals is listings accommodating 4 guests (29.3%). This suggests the primary traveler segment is likely small families or groups.
- Properties designed for 4 guests and 2 guests dominate the Reynosa STR market, accounting for 47.6% of listings.
- 31.7% of properties accommodate 6+ guests, serving the market segment for larger families or group travel in Reynosa.
- On average, properties in Reynosa are equipped to host 4.3 guests.
Reynosa Airbnb Booking Patterns (2026): Available vs. Booked Days
Available Days Distribution
Booked Days Distribution
Booking Pattern Insights for Reynosa
- The most common availability pattern in Reynosa falls within the 271-366 days range, representing 68.3% of listings. This suggests many properties have significant open periods on their calendars.
- Approximately 92.1% of listings show high availability (181+ days open annually), indicating potential for increased bookings or specific owner usage patterns.
- For booked days, the 31-90 days range is most frequent in Reynosa (42.1%), reflecting common guest stay durations or potential owner blocking patterns.
- A notable 8.5% of properties secure long booking periods (181+ days booked per year), highlighting successful long-term rental strategies or significant owner usage.
Reynosa Airbnb Minimum Stay Requirements Analysis
Distribution of Listings by Minimum Night Requirement
1 Night
93 listings
56.7% of total
2 Nights
24 listings
14.6% of total
3 Nights
9 listings
5.5% of total
4-6 Nights
3 listings
1.8% of total
7-29 Nights
1 listings
0.6% of total
30+ Nights
34 listings
20.7% of total
Key Insights
- The most prevalent minimum stay requirement in Reynosa is 1 Night, adopted by 56.7% of listings. This highlights the market's preference for shorter, flexible bookings.
- A strong majority (71.3%) of the Reynosa Airbnb data shows acceptance of very short stays (1-2 nights), indicating a dynamic, high-turnover market.
- A significant segment (20.7%) caters to monthly stays (30+ nights) in Reynosa, pointing to opportunities in the extended-stay market.
Recommendations
- Align with the market by considering a 1 Night minimum stay, as 56.7% of Reynosa hosts use this setting.
- Explore offering discounts for stays of 30+ nights to attract the 20.7% of the market seeking extended stays.
- Adjust minimum nights based on seasonality – potentially shorter during low season and longer during peak demand periods in Reynosa.
Reynosa Airbnb Cancellation Policy Trends Analysis (2026)
Flexible
91 listings
55.5% of total
Moderate
26 listings
15.9% of total
Firm
27 listings
16.5% of total
Strict
20 listings
12.2% of total
Cancellation Policy Insights for Reynosa
- The prevailing Airbnb cancellation policy trend in Reynosa is Flexible, used by 55.5% of listings.
- The market strongly favors guest-friendly terms, with 71.4% of listings offering Flexible or Moderate policies. This suggests guests in Reynosa may expect booking flexibility.
Recommendations for Hosts
- Consider adopting a Flexible policy to align with the 55.5% market standard in Reynosa.
- Given the high prevalence of Flexible policies (55.5%), offering this can enhance booking appeal, especially during shoulder seasons.
- Using a Strict policy might deter some guests, as only 12.2% of listings use it. Evaluate if potential revenue protection outweighs possible lower booking rates.
- Regularly review your cancellation policy against competitors and market demand shifts in Reynosa.
Reynosa STR Booking Lead Time Analysis (2026)
Average Booking Lead Time by Month
Booking Lead Time Insights for Reynosa
- The overall average booking lead time for vacation rentals in Reynosa is 13 days.
- Guests book furthest in advance for stays during July (average 29 days), likely coinciding with peak travel demand or local events.
- The shortest booking windows occur for stays in March (average 6 days), indicating more last-minute travel plans during this time.
- Seasonally, Summer (22 days avg.) sees the longest lead times, while Spring (8 days avg.) has the shortest, reflecting typical travel planning cycles.
Recommendations for Hosts
- Use the overall average lead time (13 days) as a baseline for your pricing and availability strategy in Reynosa.
- For July stays, consider implementing length-of-stay discounts or slightly higher rates for bookings made less than 29 days out to capitalize on advance planning.
- Target marketing efforts for the Summer season well in advance (at least 22 days) to capture early planners.
- Monitor your own booking lead times against these Reynosa averages to identify opportunities for dynamic pricing adjustments.
Popular & Essential Airbnb Amenities in Reynosa (2026)
Amenity Prevalence
Amenity Insights for Reynosa
- Essential amenities in Reynosa that guests expect include: Air conditioning, Wifi, TV. Lacking these (any) could significantly impact bookings.
- Popular amenities like Kitchen, Free parking on premises, Carbon monoxide alarm are common but not universal. Offering these can provide a competitive edge.
Recommendations for Hosts
- Ensure your listing includes all essential amenities for Reynosa: Air conditioning, Wifi, TV.
- Prioritize adding missing essentials: Wifi, TV.
- Consider adding popular differentiators like Kitchen or Free parking on premises to increase appeal.
- Highlight unique or less common amenities you offer (e.g., hot tub, dedicated workspace, EV charger) in your listing description and photos.
- Regularly check competitor amenities in Reynosa to stay competitive.
Reynosa Airbnb Guest Demographics & Profile Analysis (2026)
Guest Profile Summary for Reynosa
- The typical guest profile for Airbnb in Reynosa consists of primarily domestic travelers (79%), often arriving from nearby Reynosa, typically belonging to the Post-2000s (Gen Z/Alpha) group (50%), primarily speaking Spanish or English.
- Domestic travelers account for 79.1% of guests.
- Key international markets include Mexico (79.1%) and United States (19.6%).
- Top languages spoken are Spanish (59.6%) followed by English (34%).
- A significant demographic segment is the Post-2000s (Gen Z/Alpha) group, representing 50% of guests.
Recommendations for Hosts
- Target domestic marketing efforts towards travelers from Reynosa and Mexico City.
- Tailor amenities and listing descriptions to appeal to the dominant Post-2000s (Gen Z/Alpha) demographic (e.g., highlight fast WiFi, smart home features, local guides).
- Highlight unique local experiences or amenities relevant to the primary guest profile.
- Consider seasonal promotions aligned with peak travel times for key origin markets.
Nearby Short-Term Rental Market Comparison
How does the Reynosa Airbnb market stack up against its neighbors? Compare key performance metrics like average monthly revenue, ADR, and occupancy rates in surrounding areas to understand the broader regional STR landscape.
| Market | Active Properties | Monthly Revenue | Daily Rate | Avg. Occupancy |
|---|---|---|---|---|
| City-by-the Sea | 24 | $4,479 | $520.08 | 35% |
| Port Aransas | 2,361 | $3,422 | $437.85 | 34% |
| South Padre Island | 2,347 | $2,957 | $341.64 | 36% |
| Port Mansfield | 29 | $2,788 | $374.59 | 32% |
| Alton | 13 | $2,484 | $392.58 | 23% |
| Rio Hondo | 46 | $2,381 | $309.67 | 31% |
| Port Isabel | 249 | $2,138 | $253.87 | 38% |
| Portland | 10 | $2,123 | $239.57 | 50% |
| Corpus Christi | 1,950 | $2,047 | $224.99 | 39% |
| Kingsville | 16 | $2,008 | $152.10 | 46% |