Altamira Airbnb Market Analysis 2026: Short Term Rental Data & Vacation Rental Statistics in Tamaulipas, Mexico
Is Airbnb profitable in Altamira in 2026? Explore comprehensive Airbnb analytics for Altamira, Tamaulipas, Mexico to uncover income potential. This 2026 STR market report for Altamira, based on AirROI data from February 2025 to January 2026, reveals key trends in the niche market of 99 active listings.
Whether you're considering an Airbnb investment in Altamira, optimizing your existing vacation rental, or exploring rental arbitrage opportunities, understanding the Altamira Airbnb data is crucial. Leveraging the low regulation environment is key to maximizing your short term rental income potential. Let's dive into the specifics.
Key Altamira Airbnb Performance Metrics Overview
Monthly Airbnb Revenue Variations & Income Potential in Altamira (2026)
Understanding the monthly revenue variations for Airbnb listings in Altamira is key to maximizing your short term rental income potential. Seasonality significantly impacts earnings. Our analysis, based on data from the past 12 months, shows that the peak revenue month for STRs in Altamira is typically April, while January often presents the lowest earnings, highlighting opportunities for strategic pricing adjustments during shoulder and low seasons. Explore the typical Airbnb income in Altamira across different performance tiers:
- Best-in-class properties (Top 10%) achieve $3,498+ monthly, often utilizing dynamic pricing and superior guest experiences.
- Strong performing properties (Top 25%) earn $1,850 or more, indicating effective management and desirable locations/amenities.
- Typical properties (Median) generate around $716 per month, representing the average market performance.
- Entry-level properties (Bottom 25%) see earnings around $318, often with potential for optimization.
Average Monthly Airbnb Earnings Trend in Altamira
Altamira Airbnb Occupancy Rate Trends (2026)
Maximize your bookings by understanding the Altamira STR occupancy trends. Seasonal demand shifts significantly influence how often properties are booked. Typically, Aprilsees the highest demand (peak season occupancy), while January experiences the lowest (low season). Effective strategies, like adjusting minimum stays or offering promotions, can boost occupancy during slower periods. Here's how different property tiers perform in Altamira:
- Best-in-class properties (Top 10%) achieve 64%+ occupancy, indicating high desirability and potentially optimized availability.
- Strong performing properties (Top 25%) maintain 42% or higher occupancy, suggesting good market fit and guest satisfaction.
- Typical properties (Median) have an occupancy rate around 24%.
- Entry-level properties (Bottom 25%) average 13% occupancy, potentially facing higher vacancy.
Average Monthly Occupancy Rate Trend in Altamira
Average Daily Rate (ADR) Airbnb Trends in Altamira (2026)
Effective short term rental pricing strategy in Altamira involves understanding monthly ADR fluctuations. The Average Daily Rate (ADR) for Airbnb in Altamira typically peaks in January and dips lowest during March. Leveraging Airbnb dynamic pricing tools or strategies based on this seasonality can significantly boost revenue. Here's a look at the typical nightly rates achieved:
- Best-in-class properties (Top 10%) command rates of $339+ per night, often due to premium features or locations.
- Strong performing properties (Top 25%) achieve nightly rates of $259 or more.
- Typical properties (Median) charge around $83 per night.
- Entry-level properties (Bottom 25%) earn around $43 per night.
Average Daily Rate (ADR) Trend by Month in Altamira
Get Live Altamira Market Intelligence 👇

Explore Real-time Analytics
Airbnb Seasonality Analysis & Trends in Altamira (2026)
Peak Season (April, July, August)
- Revenue averages $1,869 per month
- Occupancy rates average 38.0%
- Daily rates average $150
Shoulder Season
- Revenue averages $1,316 per month
- Occupancy maintains around 29.3%
- Daily rates hold near $156
Low Season (January, February, November)
- Revenue drops to average $884 per month
- Occupancy decreases to average 24.4%
- Daily rates adjust to average $158
Seasonality Insights for Altamira
- The Airbnb seasonality in Altamira shows highly seasonal trends requiring careful strategy. While the sections above show seasonal averages, it's also insightful to look at the extremes:
- During the high season, the absolute peak month showcases Altamira's highest earning potential, with monthly revenues capable of climbing to $1,980, occupancy reaching a high of 41.7%, and ADRs peaking at $168.
- Conversely, the slowest single month of the year, typically falling within the low season, marks the market's lowest point. In this month, revenue might dip to $775, occupancy could drop to 16.5%, and ADRs may adjust down to $142.
- Understanding both the seasonal averages and these monthly peaks and troughs in revenue, occupancy, and ADR is crucial for maximizing your Airbnb profit potential in Altamira.
Seasonal Strategies for Maximizing Profit
- Peak Season: Maximize revenue through premium pricing and potentially longer minimum stays. Ensure high availability.
- Low Season: Offer competitive pricing, special promotions (e.g., extended stay discounts), and flexible cancellation policies. Target off-season travelers like remote workers or budget-conscious guests.
- Shoulder Seasons: Implement dynamic pricing that balances peak and low rates. Target weekend travelers or specific events. Offer slightly more flexible terms than peak season.
- Regularly analyze your own performance against these Altamira seasonality benchmarks and adjust your pricing and availability strategy accordingly.
Best Areas for Airbnb Investment in Altamira (2026)
Exploring the top neighborhoods for short-term rentals in Altamira? This section highlights key areas, outlining why they are attractive for hosts and guests, along with notable local attractions. Consider these locations based on your target guest profile and investment strategy.
| Neighborhood / Area | Why Host Here? (Target Guests & Appeal) | Key Attractions & Landmarks |
|---|---|---|
| Centro Histórico | The historic center of Altamira features colonial architecture and is a hub for local culture and commerce, attracting tourists interested in history and local cuisine. | Plaza de la Constitución, Museo de Historia, Templo de San Miguel, Palacio Municipal, Teatro Altamira |
| Playa Tesoro | Popular beach destination known for its beautiful coastline and recreational activities. Ideal for tourists looking for a coastal getaway with various water activities. | Tesoro Beach, Restaurants along the shore, Water sports rentals, Beach clubs, Scenic views |
| Laguna del Carpintero | A serene natural area great for outdoor enthusiasts, perfect for families and nature lovers seeking relaxation and recreational opportunities in a peaceful setting. | Laguna del Carpintero Park, Walking trails, Wildlife watching, Picnic areas, Kayak rentals |
| Estación de Altamira | A growing area with modern amenities and accessibility, attracting business travelers and those seeking convenient accommodations near transport links. | Shopping centers, Local restaurants, Public transport access, Fitness centers, Business services |
| Mexicana | This neighborhood offers a mix of residential and commercial options, drawing visitors looking for a local experience and easy access to services and entertainment. | Parks and recreational areas, Local shops, Street food vendors, Community events, Cultural attractions |
| Río Tamesí | A picturesque riverside area that's becoming increasingly popular for its natural beauty and opportunities for water sports, ideal for those seeking adventure. | Riverside parks, Fishing spots, Kayaking and canoeing, Scenic views along the river, Biking trails |
| Las Brisas | A vibrant coastal community with a friendly atmosphere, appealing to families and tourists looking for a laid-back beach experience with local charm. | Brisas Beach, Family-friendly activities, Local seafood restaurants, Games and recreational areas, Beach volleyball courts |
| Las Flores | Known for its residential appeal and nearby amenities, this area is suitable for travelers wanting a quieter stay while remaining close to the main attractions of Altamira. | Nearby markets, Community parks, Local cafes, Cultural experiences, Residential atmosphere |
Understanding Airbnb License Requirements & STR Laws in Altamira (2026)
While Altamira, Tamaulipas, Mexico currently shows low STR regulations, specific Airbnb license requirements might still exist or change. Always verify the latest short term rental regulations and Airbnb license requirements directly with local government authorities for Altamira to ensure full compliance before hosting.
(Source: AirROI data, 2026, finding no licensed listings among those analyzed)
Top Performing Airbnb Properties in Altamira (2026)
Benchmark your potential! Explore examples of top-performing Airbnb properties in Altamirabased on Trailing Twelve Month (TTM) revenue. Analyze their characteristics, revenue, occupancy rate, and ADR to understand what drives success in this market.
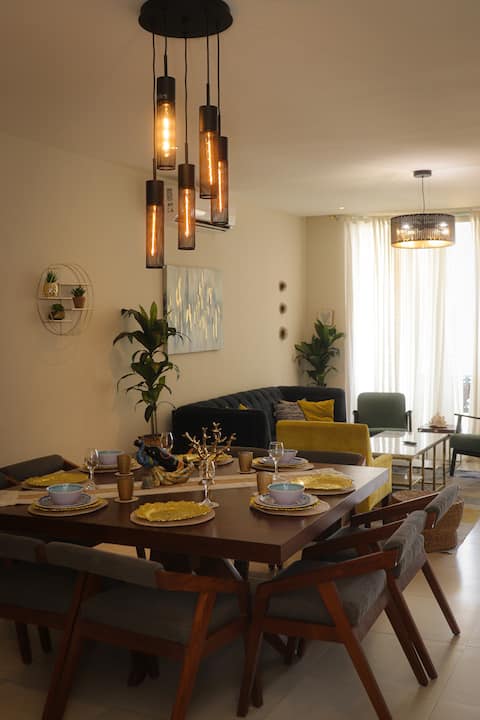
Beachfront apartment in Tampico
Entire Place • 2 bedrooms

A beautiful apartment with an ocean view
Entire Place • 2 bedrooms

House in Velamar Residential Complex
Entire Place • 3 bedrooms
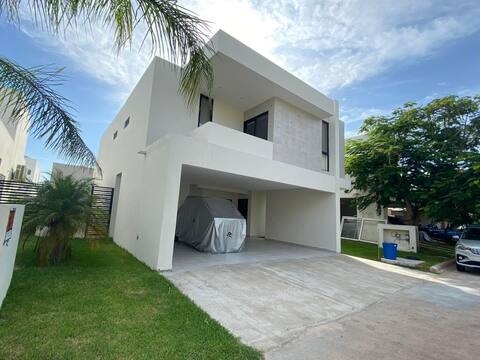
Beautiful and comfortable beach house!
Entire Place • 3 bedrooms

BEACH APARTMENT / VELAMAR - TAMPICO
Entire Place • 4 bedrooms

Beautiful apartment with ocean views. Velamar. Tampico.
Entire Place • 2 bedrooms
Note: Performance varies based on location, size, amenities, seasonality, and management quality. Data reflects the past 12 months.
Top Performing Airbnb Hosts in Altamira (2026)
Learn from the best! This table showcases top-performing Airbnb hosts in Altamira based on the number of properties managed and estimated total revenue over the past year. Analyze their scale and performance metrics.
| Host Name | Properties | Grossing Revenue | Stay Reviews | Avg Rating |
|---|---|---|---|---|
| Ivonne Janeth | 17 | $65,233 | 169 | 4.98/5.0 |
| Rene | 1 | $57,750 | 115 | 4.86/5.0 |
| Rolando | 3 | $47,699 | 120 | 4.89/5.0 |
| Leticia | 5 | $47,387 | 300 | 4.78/5.0 |
| Alejandro | 1 | $40,835 | 138 | 4.91/5.0 |
| Jessica | 1 | $39,286 | 16 | 4.75/5.0 |
| Anna Karolina | 1 | $39,204 | 274 | 4.92/5.0 |
| Arturo | 1 | $37,134 | 39 | 4.90/5.0 |
| Gerardo | 1 | $37,129 | 46 | 4.93/5.0 |
| Evelia | 2 | $36,420 | 48 | 4.90/5.0 |
Analyzing the strategies of top hosts, such as their property selection, pricing, and guest communication, can offer valuable lessons for optimizing your own Airbnb operations in Altamira.
Dive Deeper: Advanced Altamira STR Market Data (2026)
Ready to unlock more insights? AirROI provides access to advanced metrics and comprehensive Airbnb data for Altamira. Explore detailed analytics beyond this report to refine your investment strategy, optimize pricing, and maximize your vacation rental profits.
Explore Advanced MetricsAltamira Short-Term Rental Market Composition (2026): Property & Room Types
Room Type Distribution
Property Type Distribution
Market Composition Insights for Altamira
- The Altamira Airbnb market composition is heavily skewed towards Entire Home/Apt listings, which make up 82.8% of the 99 active rentals. This indicates strong guest preference for privacy and space.
- Looking at the property type distribution in Altamira, Apartment/Condo properties are the most common (43.4%), reflecting the local real estate landscape.
- Houses represent a significant 36.4% portion, catering likely to families or larger groups.
- The presence of 6.1% Hotel/Boutique listings indicates integration with traditional hospitality.
- Smaller segments like outdoor/unique (combined 1.0%) offer potential for unique stay experiences.
Altamira Airbnb Room Capacity Analysis (2026): Bedroom Distribution
Distribution of Listings by Number of Bedrooms
Room Capacity Insights for Altamira
- The dominant room capacity in Altamira is 2 bedrooms listings, making up 40.4% of the market. This suggests a strong demand for properties suitable for couples or solo travelers.
- Together, 2 bedrooms and 3 bedrooms properties represent 70.7% of the active Airbnb listings in Altamira, indicating a high concentration in these sizes.
- A significant 37.3% of listings offer 3+ bedrooms, catering to larger groups and families seeking more space in Altamira.
Altamira Vacation Rental Guest Capacity Trends (2026)
Distribution of Listings by Guest Capacity
Guest Capacity Insights for Altamira
- The most common guest capacity trend in Altamira vacation rentals is listings accommodating 8+ guests (48.5%). This suggests the primary traveler segment is likely larger groups.
- Properties designed for 8+ guests and 6 guests dominate the Altamira STR market, accounting for 65.7% of listings.
- 70.8% of properties accommodate 6+ guests, serving the market segment for larger families or group travel in Altamira.
- On average, properties in Altamira are equipped to host 6.0 guests.
Altamira Airbnb Booking Patterns (2026): Available vs. Booked Days
Available Days Distribution
Booked Days Distribution
Booking Pattern Insights for Altamira
- The most common availability pattern in Altamira falls within the 271-366 days range, representing 68.7% of listings. This suggests many properties have significant open periods on their calendars.
- Approximately 96.0% of listings show high availability (181+ days open annually), indicating potential for increased bookings or specific owner usage patterns.
- For booked days, the 31-90 days range is most frequent in Altamira (34.3%), reflecting common guest stay durations or potential owner blocking patterns.
- A notable 4.0% of properties secure long booking periods (181+ days booked per year), highlighting successful long-term rental strategies or significant owner usage.
Altamira Airbnb Minimum Stay Requirements Analysis
Distribution of Listings by Minimum Night Requirement
1 Night
29 listings
29.3% of total
2 Nights
52 listings
52.5% of total
3 Nights
3 listings
3% of total
4-6 Nights
1 listings
1% of total
30+ Nights
14 listings
14.1% of total
Key Insights
- The most prevalent minimum stay requirement in Altamira is 2 Nights, adopted by 52.5% of listings. This highlights the market's preference for shorter, flexible bookings.
- A strong majority (81.8%) of the Altamira Airbnb data shows acceptance of very short stays (1-2 nights), indicating a dynamic, high-turnover market.
- A significant segment (14.1%) caters to monthly stays (30+ nights) in Altamira, pointing to opportunities in the extended-stay market.
Recommendations
- Align with the market by considering a 2 Nights minimum stay, as 52.5% of Altamira hosts use this setting.
- If feasible, allowing 1-night stays, especially midweek or during low season, could capture last-minute bookings, as only 29.3% currently do.
- Explore offering discounts for stays of 30+ nights to attract the 14.1% of the market seeking extended stays.
- Adjust minimum nights based on seasonality – potentially shorter during low season and longer during peak demand periods in Altamira.
Altamira Airbnb Cancellation Policy Trends Analysis (2026)
Flexible
43 listings
43.4% of total
Moderate
26 listings
26.3% of total
Firm
25 listings
25.3% of total
Strict
5 listings
5.1% of total
Cancellation Policy Insights for Altamira
- The prevailing Airbnb cancellation policy trend in Altamira is Flexible, used by 43.4% of listings.
- There's a relatively balanced mix between guest-friendly (69.7%) and stricter (30.4%) policies, offering choices for different guest needs.
- Strict cancellation policies are quite rare (5.1%), potentially making listings with this policy less competitive unless justified by high demand or property type.
Recommendations for Hosts
- Consider adopting a Flexible policy to align with the 43.4% market standard in Altamira.
- Using a Strict policy might deter some guests, as only 5.1% of listings use it. Evaluate if potential revenue protection outweighs possible lower booking rates.
- Regularly review your cancellation policy against competitors and market demand shifts in Altamira.
Altamira STR Booking Lead Time Analysis (2026)
Average Booking Lead Time by Month
Booking Lead Time Insights for Altamira
- The overall average booking lead time for vacation rentals in Altamira is 25 days.
- Guests book furthest in advance for stays during April (average 34 days), likely coinciding with peak travel demand or local events.
- The shortest booking windows occur for stays in February (average 7 days), indicating more last-minute travel plans during this time.
- Seasonally, Summer (24 days avg.) sees the longest lead times, while Fall (10 days avg.) has the shortest, reflecting typical travel planning cycles.
Recommendations for Hosts
- Use the overall average lead time (25 days) as a baseline for your pricing and availability strategy in Altamira.
- During February, focus on last-minute booking availability and promotions, as guests book with very short notice (7 days avg.).
- Target marketing efforts for the Summer season well in advance (at least 24 days) to capture early planners.
- Monitor your own booking lead times against these Altamira averages to identify opportunities for dynamic pricing adjustments.
Popular & Essential Airbnb Amenities in Altamira (2026)
Amenity Prevalence
Amenity Insights for Altamira
- Essential amenities in Altamira that guests expect include: TV, Wifi, Air conditioning. Lacking these (any) could significantly impact bookings.
- Popular amenities like Free parking on premises, Kitchen, Hot water are common but not universal. Offering these can provide a competitive edge.
Recommendations for Hosts
- Ensure your listing includes all essential amenities for Altamira: TV, Wifi, Air conditioning.
- Prioritize adding missing essentials: TV, Wifi, Air conditioning.
- Consider adding popular differentiators like Free parking on premises or Kitchen to increase appeal.
- Highlight unique or less common amenities you offer (e.g., hot tub, dedicated workspace, EV charger) in your listing description and photos.
- Regularly check competitor amenities in Altamira to stay competitive.
Altamira Airbnb Guest Demographics & Profile Analysis (2026)
Guest Profile Summary for Altamira
- The typical guest profile for Airbnb in Altamira consists of primarily domestic travelers (91%), often arriving from nearby Monterrey, typically belonging to the Post-2000s (Gen Z/Alpha) group (50%), primarily speaking Spanish or English.
- Domestic travelers account for 91.3% of guests.
- Key international markets include Mexico (91.3%) and United States (6.7%).
- Top languages spoken are Spanish (62%) followed by English (31%).
- A significant demographic segment is the Post-2000s (Gen Z/Alpha) group, representing 50% of guests.
Recommendations for Hosts
- Target domestic marketing efforts towards travelers from Monterrey and Mexico City.
- Tailor amenities and listing descriptions to appeal to the dominant Post-2000s (Gen Z/Alpha) demographic (e.g., highlight fast WiFi, smart home features, local guides).
- Highlight unique local experiences or amenities relevant to the primary guest profile.
- Consider seasonal promotions aligned with peak travel times for key origin markets.
Nearby Short-Term Rental Market Comparison
How does the Altamira Airbnb market stack up against its neighbors? Compare key performance metrics like average monthly revenue, ADR, and occupancy rates in surrounding areas to understand the broader regional STR landscape.
| Market | Active Properties | Monthly Revenue | Daily Rate | Avg. Occupancy |
|---|---|---|---|---|
| Velamar | 12 | $1,474 | $286.53 | 24% |
| Terrenos del Lote "La Isla" | 39 | $990 | $139.28 | 24% |
| Ciudad Madero | 480 | $495 | $80.67 | 29% |
| Tampico | 423 | $468 | $66.05 | 33% |
| La Pesca | 10 | $310 | $132.57 | 17% |
| Xilitla | 145 | $222 | $71.84 | 16% |
| Axtla de Terrazas | 16 | $171 | $108.24 | 12% |
| Miramar | 18 | $142 | $48.50 | 28% |
| Huejutla de Reyes | 10 | $117 | $55.69 | 15% |