Naucalpan de Juárez Airbnb Market Analysis 2026: Short Term Rental Data & Vacation Rental Statistics in State of Mexico, Mexico
Is Airbnb profitable in Naucalpan de Juárez in 2026? Explore comprehensive Airbnb analytics for Naucalpan de Juárez, State of Mexico, Mexico to uncover income potential. This 2026 STR market report for Naucalpan de Juárez, based on AirROI data from February 2025 to January 2026, reveals key trends in the niche market of 166 active listings.
Whether you're considering an Airbnb investment in Naucalpan de Juárez, optimizing your existing vacation rental, or exploring rental arbitrage opportunities, understanding the Naucalpan de Juárez Airbnb data is crucial. Leveraging the low regulation environment is key to maximizing your short term rental income potential. Let's dive into the specifics.
Key Naucalpan de Juárez Airbnb Performance Metrics Overview
Monthly Airbnb Revenue Variations & Income Potential in Naucalpan de Juárez (2026)
Understanding the monthly revenue variations for Airbnb listings in Naucalpan de Juárez is key to maximizing your short term rental income potential. Seasonality significantly impacts earnings. Our analysis, based on data from the past 12 months, shows that the peak revenue month for STRs in Naucalpan de Juárez is typically December, while May often presents the lowest earnings, highlighting opportunities for strategic pricing adjustments during shoulder and low seasons. Explore the typical Airbnb income in Naucalpan de Juárez across different performance tiers:
- Best-in-class properties (Top 10%) achieve $1,754+ monthly, often utilizing dynamic pricing and superior guest experiences.
- Strong performing properties (Top 25%) earn $971 or more, indicating effective management and desirable locations/amenities.
- Typical properties (Median) generate around $490 per month, representing the average market performance.
- Entry-level properties (Bottom 25%) see earnings around $222, often with potential for optimization.
Average Monthly Airbnb Earnings Trend in Naucalpan de Juárez
Naucalpan de Juárez Airbnb Occupancy Rate Trends (2026)
Maximize your bookings by understanding the Naucalpan de Juárez STR occupancy trends. Seasonal demand shifts significantly influence how often properties are booked. Typically, Marchsees the highest demand (peak season occupancy), while January experiences the lowest (low season). Effective strategies, like adjusting minimum stays or offering promotions, can boost occupancy during slower periods. Here's how different property tiers perform in Naucalpan de Juárez:
- Best-in-class properties (Top 10%) achieve 82%+ occupancy, indicating high desirability and potentially optimized availability.
- Strong performing properties (Top 25%) maintain 63% or higher occupancy, suggesting good market fit and guest satisfaction.
- Typical properties (Median) have an occupancy rate around 37%.
- Entry-level properties (Bottom 25%) average 16% occupancy, potentially facing higher vacancy.
Average Monthly Occupancy Rate Trend in Naucalpan de Juárez
Average Daily Rate (ADR) Airbnb Trends in Naucalpan de Juárez (2026)
Effective short term rental pricing strategy in Naucalpan de Juárez involves understanding monthly ADR fluctuations. The Average Daily Rate (ADR) for Airbnb in Naucalpan de Juárez typically peaks in December and dips lowest during March. Leveraging Airbnb dynamic pricing tools or strategies based on this seasonality can significantly boost revenue. Here's a look at the typical nightly rates achieved:
- Best-in-class properties (Top 10%) command rates of $111+ per night, often due to premium features or locations.
- Strong performing properties (Top 25%) achieve nightly rates of $66 or more.
- Typical properties (Median) charge around $38 per night.
- Entry-level properties (Bottom 25%) earn around $27 per night.
Average Daily Rate (ADR) Trend by Month in Naucalpan de Juárez
Get Live Naucalpan de Juárez Market Intelligence 👇

Explore Real-time Analytics
Airbnb Seasonality Analysis & Trends in Naucalpan de Juárez (2026)
Peak Season (December, November, October)
- Revenue averages $1,109 per month
- Occupancy rates average 43.1%
- Daily rates average $63
Shoulder Season
- Revenue averages $945 per month
- Occupancy maintains around 41.9%
- Daily rates hold near $60
Low Season (May, June, September)
- Revenue drops to average $859 per month
- Occupancy decreases to average 37.1%
- Daily rates adjust to average $61
Seasonality Insights for Naucalpan de Juárez
- The Airbnb seasonality in Naucalpan de Juárez shows moderate seasonality with distinct peak and low periods. While the sections above show seasonal averages, it's also insightful to look at the extremes:
- During the high season, the absolute peak month showcases Naucalpan de Juárez's highest earning potential, with monthly revenues capable of climbing to $1,180, occupancy reaching a high of 45.9%, and ADRs peaking at $66.
- Conversely, the slowest single month of the year, typically falling within the low season, marks the market's lowest point. In this month, revenue might dip to $811, occupancy could drop to 30.1%, and ADRs may adjust down to $58.
- Understanding both the seasonal averages and these monthly peaks and troughs in revenue, occupancy, and ADR is crucial for maximizing your Airbnb profit potential in Naucalpan de Juárez.
Seasonal Strategies for Maximizing Profit
- Peak Season: Maximize revenue through premium pricing and potentially longer minimum stays. Ensure high availability.
- Low Season: Offer competitive pricing, special promotions (e.g., extended stay discounts), and flexible cancellation policies. Target off-season travelers like remote workers or budget-conscious guests.
- Shoulder Seasons: Implement dynamic pricing that balances peak and low rates. Target weekend travelers or specific events. Offer slightly more flexible terms than peak season.
- Regularly analyze your own performance against these Naucalpan de Juárez seasonality benchmarks and adjust your pricing and availability strategy accordingly.
Best Areas for Airbnb Investment in Naucalpan de Juárez (2026)
Exploring the top neighborhoods for short-term rentals in Naucalpan de Juárez? This section highlights key areas, outlining why they are attractive for hosts and guests, along with notable local attractions. Consider these locations based on your target guest profile and investment strategy.
| Neighborhood / Area | Why Host Here? (Target Guests & Appeal) | Key Attractions & Landmarks |
|---|---|---|
| Avenida de los Jardines | A bustling street lined with shops and eateries, popular among both locals and visitors. It offers a lively atmosphere and easy access to local attractions. | Parque Naucalli, Museo de la Ciudad de Naucalpan, Torres de Satélite, Plaza Satélite, Cinemex |
| Lomas Verdes | An upscale residential area that offers a quieter, more suburban feel while being close to amenities and attractions. Ideal for families and longer stays. | Centro Nacional de Artes, Parque de la Cañada, Cinemex, Plaza Lomas Verdes, Local markets |
| Naucalpan Centro | The historical and cultural heart of Naucalpan, featuring important landmarks and an authentic Mexican experience. Attracts visitors interested in culture and history. | La Catedral de Naucalpan, Antiguo Palacio Municipal, Mercado de San Bartolo, Museo Casa de la Cultura |
| Satélite | A modern and vibrant neighborhood known for its shopping centers and proximity to cultural sites. Popular with younger crowds and those seeking entertainment options. | Plaza Satélite, Teatro de la Ciudad, Galería de Arte Mexicano, Cinemex, Centro Cívico |
| Los Remedios | A serene area known for its natural parks and recreational opportunities, appealing to nature lovers and families seeking relaxation and outdoor activities. | Parque Nacional de los Remedios, Zona Arqueológica de Tenayuca, Museo del Chocolate, Sendero Ecoturístico |
| El Molinito | A charming neighborhood that offers a local experience with nearby markets and eateries. Great for travelers looking for authenticity and local culture. | Mercado de El Molinito, Restaurantes locales, Parque de la Amistad |
| San Lorenzo | A developing area that is becoming more popular with tourists and locals alike, offering good access to various local attractions and facilities. | Parque Arboledas, Plaza de San Lorenzo, Cafeterías locales |
| Naucalpan Norte | A bustling commercial district that draws visitors for its shopping and dining options, located near key transport routes for easy access to the rest of the city. | Centro Comercial Perinorte, Parque de los Ciervos, Cafés y restaurantes |
Understanding Airbnb License Requirements & STR Laws in Naucalpan de Juárez (2026)
While Naucalpan de Juárez, State of Mexico, Mexico currently shows low STR regulations, specific Airbnb license requirements might still exist or change. Always verify the latest short term rental regulations and Airbnb license requirements directly with local government authorities for Naucalpan de Juárez to ensure full compliance before hosting.
(Source: AirROI data, 2026, finding no licensed listings among those analyzed)
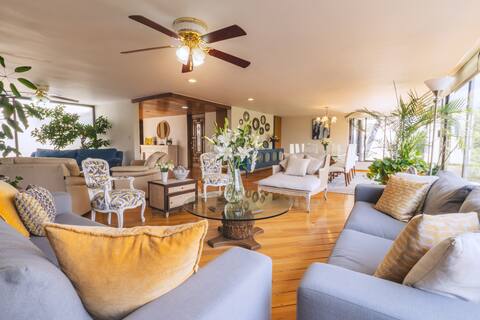
Top Performing Airbnb Properties in Naucalpan de Juárez (2026)
Benchmark your potential! Explore examples of top-performing Airbnb properties in Naucalpan de Juárezbased on Trailing Twelve Month (TTM) revenue. Analyze their characteristics, revenue, occupancy rate, and ADR to understand what drives success in this market.

Come & Dream in Quetzalcoatl`s Nest
Entire Place • 3 bedrooms

Dream in El Nido de Quetzalcóatl 7
Entire Place • 3 bedrooms

Perfect for Groups, Large Garden, Exclusive Suburb
Entire Place • 7 bedrooms
Amazing and spacious apartment, very nicely located!
Entire Place • 4 bedrooms

Beautiful house gardens & terraces
Entire Place • 7 bedrooms

Beautiful colonial house with a great location
Entire Place • 3 bedrooms
Note: Performance varies based on location, size, amenities, seasonality, and management quality. Data reflects the past 12 months.
Top Performing Airbnb Hosts in Naucalpan de Juárez (2026)
Learn from the best! This table showcases top-performing Airbnb hosts in Naucalpan de Juárez based on the number of properties managed and estimated total revenue over the past year. Analyze their scale and performance metrics.
| Host Name | Properties | Grossing Revenue | Stay Reviews | Avg Rating |
|---|---|---|---|---|
| Patricia | 2 | $303,318 | 909 | 4.95/5.0 |
| Raquel | 1 | $103,750 | 47 | 4.91/5.0 |
| Monica Maria | 3 | $52,842 | 388 | 4.90/5.0 |
| Guillermo Eduardo | 1 | $38,368 | 33 | 4.88/5.0 |
| Maria Roxana | 1 | $29,916 | 49 | 4.92/5.0 |
| Unity | 6 | $29,709 | 40 | 4.60/5.0 |
| Ulises | 1 | $29,580 | 87 | 4.99/5.0 |
| Alejandro | 1 | $28,466 | 8 | 5.00/5.0 |
| Ricardo | 1 | $25,941 | 49 | 4.98/5.0 |
| Jose Del Carmen | 1 | $21,934 | 125 | 4.90/5.0 |
Analyzing the strategies of top hosts, such as their property selection, pricing, and guest communication, can offer valuable lessons for optimizing your own Airbnb operations in Naucalpan de Juárez.
Dive Deeper: Advanced Naucalpan de Juárez STR Market Data (2026)
Ready to unlock more insights? AirROI provides access to advanced metrics and comprehensive Airbnb data for Naucalpan de Juárez. Explore detailed analytics beyond this report to refine your investment strategy, optimize pricing, and maximize your vacation rental profits.
Explore Advanced MetricsNaucalpan de Juárez Short-Term Rental Market Composition (2026): Property & Room Types
Room Type Distribution
Property Type Distribution
Market Composition Insights for Naucalpan de Juárez
- The Naucalpan de Juárez Airbnb market composition is heavily skewed towards Private Room listings, which make up 52.4% of the 166 active rentals. This indicates strong guest preference for privacy and space.
- Looking at the property type distribution in Naucalpan de Juárez, Apartment/Condo properties are the most common (50%), reflecting the local real estate landscape.
- Houses represent a significant 30.1% portion, catering likely to families or larger groups.
- The presence of 7.8% Hotel/Boutique listings indicates integration with traditional hospitality.
- Smaller segments like outdoor/unique (combined 3.0%) offer potential for unique stay experiences.
Naucalpan de Juárez Airbnb Room Capacity Analysis (2026): Bedroom Distribution
Distribution of Listings by Number of Bedrooms
Room Capacity Insights for Naucalpan de Juárez
- The dominant room capacity in Naucalpan de Juárez is 1 bedroom listings, making up 41% of the market. This suggests a strong demand for properties suitable for couples or solo travelers.
- Together, 1 bedroom and 2 bedrooms properties represent 51.8% of the active Airbnb listings in Naucalpan de Juárez, indicating a high concentration in these sizes.
- Listings with 3+ bedrooms (9.6%) represent a smaller niche, potentially indicating an underserved market for larger group accommodations in Naucalpan de Juárez.
Naucalpan de Juárez Vacation Rental Guest Capacity Trends (2026)
Distribution of Listings by Guest Capacity
Guest Capacity Insights for Naucalpan de Juárez
- The most common guest capacity trend in Naucalpan de Juárez vacation rentals is listings accommodating 2 guests (21.1%). This suggests the primary traveler segment is likely couples or solo travelers.
- Properties designed for 2 guests and 4 guests dominate the Naucalpan de Juárez STR market, accounting for 33.1% of listings.
- 11.4% of properties accommodate 6+ guests, serving the market segment for larger families or group travel in Naucalpan de Juárez.
- On average, properties in Naucalpan de Juárez are equipped to host 2.1 guests.
Naucalpan de Juárez Airbnb Booking Patterns (2026): Available vs. Booked Days
Available Days Distribution
Booked Days Distribution
Booking Pattern Insights for Naucalpan de Juárez
- The most common availability pattern in Naucalpan de Juárez falls within the 271-366 days range, representing 47% of listings. This suggests many properties have significant open periods on their calendars.
- Approximately 79.5% of listings show high availability (181+ days open annually), indicating potential for increased bookings or specific owner usage patterns.
- For booked days, the 91-180 days range is most frequent in Naucalpan de Juárez (30.7%), reflecting common guest stay durations or potential owner blocking patterns.
- A notable 24.1% of properties secure long booking periods (181+ days booked per year), highlighting successful long-term rental strategies or significant owner usage.
Naucalpan de Juárez Airbnb Minimum Stay Requirements Analysis
Distribution of Listings by Minimum Night Requirement
1 Night
81 listings
48.8% of total
2 Nights
34 listings
20.5% of total
3 Nights
6 listings
3.6% of total
4-6 Nights
9 listings
5.4% of total
7-29 Nights
3 listings
1.8% of total
30+ Nights
33 listings
19.9% of total
Key Insights
- The most prevalent minimum stay requirement in Naucalpan de Juárez is 1 Night, adopted by 48.8% of listings. This highlights the market's preference for shorter, flexible bookings.
- A strong majority (69.3%) of the Naucalpan de Juárez Airbnb data shows acceptance of very short stays (1-2 nights), indicating a dynamic, high-turnover market.
- A significant segment (19.9%) caters to monthly stays (30+ nights) in Naucalpan de Juárez, pointing to opportunities in the extended-stay market.
Recommendations
- Align with the market by considering a 1 Night minimum stay, as 48.8% of Naucalpan de Juárez hosts use this setting.
- Explore offering discounts for stays of 30+ nights to attract the 19.9% of the market seeking extended stays.
- Adjust minimum nights based on seasonality – potentially shorter during low season and longer during peak demand periods in Naucalpan de Juárez.
Naucalpan de Juárez Airbnb Cancellation Policy Trends Analysis (2026)
Limited
6 listings
3.6% of total
Flexible
68 listings
41% of total
Moderate
41 listings
24.7% of total
Firm
44 listings
26.5% of total
Strict
7 listings
4.2% of total
Cancellation Policy Insights for Naucalpan de Juárez
- The prevailing Airbnb cancellation policy trend in Naucalpan de Juárez is Flexible, used by 41% of listings.
- There's a relatively balanced mix between guest-friendly (65.7%) and stricter (30.7%) policies, offering choices for different guest needs.
- Strict cancellation policies are quite rare (4.2%), potentially making listings with this policy less competitive unless justified by high demand or property type.
Recommendations for Hosts
- Consider adopting a Flexible policy to align with the 41% market standard in Naucalpan de Juárez.
- Using a Strict policy might deter some guests, as only 4.2% of listings use it. Evaluate if potential revenue protection outweighs possible lower booking rates.
- Regularly review your cancellation policy against competitors and market demand shifts in Naucalpan de Juárez.
Naucalpan de Juárez STR Booking Lead Time Analysis (2026)
Average Booking Lead Time by Month
Booking Lead Time Insights for Naucalpan de Juárez
- The overall average booking lead time for vacation rentals in Naucalpan de Juárez is 23 days.
- Guests book furthest in advance for stays during October (average 30 days), likely coinciding with peak travel demand or local events.
- The shortest booking windows occur for stays in June (average 11 days), indicating more last-minute travel plans during this time.
- Seasonally, Fall (25 days avg.) sees the longest lead times, while Summer (17 days avg.) has the shortest, reflecting typical travel planning cycles.
Recommendations for Hosts
- Use the overall average lead time (23 days) as a baseline for your pricing and availability strategy in Naucalpan de Juárez.
- During June, focus on last-minute booking availability and promotions, as guests book with very short notice (11 days avg.).
- Target marketing efforts for the Fall season well in advance (at least 25 days) to capture early planners.
- Monitor your own booking lead times against these Naucalpan de Juárez averages to identify opportunities for dynamic pricing adjustments.
Popular & Essential Airbnb Amenities in Naucalpan de Juárez (2026)
Amenity Prevalence
Amenity Insights for Naucalpan de Juárez
- Essential amenities in Naucalpan de Juárez that guests expect include: Wifi. Lacking these (this) could significantly impact bookings.
- Popular amenities like TV, Hot water, Dedicated workspace are common but not universal. Offering these can provide a competitive edge.
Recommendations for Hosts
- Ensure your listing includes all essential amenities for Naucalpan de Juárez: Wifi.
- Prioritize adding missing essentials: Wifi.
- Consider adding popular differentiators like TV or Hot water to increase appeal.
- Highlight unique or less common amenities you offer (e.g., hot tub, dedicated workspace, EV charger) in your listing description and photos.
- Regularly check competitor amenities in Naucalpan de Juárez to stay competitive.
Naucalpan de Juárez Airbnb Guest Demographics & Profile Analysis (2026)
Guest Profile Summary for Naucalpan de Juárez
- The typical guest profile for Airbnb in Naucalpan de Juárez consists of primarily domestic travelers (78%), often arriving from nearby Mexico City, typically belonging to the Post-2000s (Gen Z/Alpha) group (50%), primarily speaking Spanish or English.
- Domestic travelers account for 77.6% of guests.
- Key international markets include Mexico (77.6%) and United States (13%).
- Top languages spoken are Spanish (48.7%) followed by English (39.8%).
- A significant demographic segment is the Post-2000s (Gen Z/Alpha) group, representing 50% of guests.
Recommendations for Hosts
- Target domestic marketing efforts towards travelers from Mexico City and Santiago de Querétaro.
- Tailor amenities and listing descriptions to appeal to the dominant Post-2000s (Gen Z/Alpha) demographic (e.g., highlight fast WiFi, smart home features, local guides).
- Highlight unique local experiences or amenities relevant to the primary guest profile.
- Consider seasonal promotions aligned with peak travel times for key origin markets.
Nearby Short-Term Rental Market Comparison
How does the Naucalpan de Juárez Airbnb market stack up against its neighbors? Compare key performance metrics like average monthly revenue, ADR, and occupancy rates in surrounding areas to understand the broader regional STR landscape.
| Market | Active Properties | Monthly Revenue | Daily Rate | Avg. Occupancy |
|---|---|---|---|---|
| El Santuario | 44 | $2,583 | $420.27 | 25% |
| Cerro Gordo | 38 | $2,183 | $438.64 | 21% |
| Tepeji del Rio de Ocampo | 11 | $2,125 | $315.80 | 27% |
| Yautepec de Zaragoza | 16 | $2,032 | $269.32 | 26% |
| Xalmolonco | 24 | $1,944 | $281.85 | 28% |
| Avandaro | 212 | $1,892 | $411.24 | 24% |
| Rancho San Diego | 21 | $1,707 | $276.31 | 26% |
| Lomas de Cocoyoc | 137 | $1,662 | $258.05 | 28% |
| La Tortuga | 71 | $1,658 | $239.12 | 28% |
| La Ladrillera | 28 | $1,655 | $277.53 | 26% |