Los Mochis Airbnb Market Analysis 2026: Short Term Rental Data & Vacation Rental Statistics in Sinaloa, Mexico
Is Airbnb profitable in Los Mochis in 2026? Explore comprehensive Airbnb analytics for Los Mochis, Sinaloa, Mexico to uncover income potential. This 2026 STR market report for Los Mochis, based on AirROI data from February 2025 to January 2026, reveals key trends in the market of 329 active listings.
Whether you're considering an Airbnb investment in Los Mochis, optimizing your existing vacation rental, or exploring rental arbitrage opportunities, understanding the Los Mochis Airbnb data is crucial. Leveraging the low regulation environment is key to maximizing your short term rental income potential. Let's dive into the specifics.
Key Los Mochis Airbnb Performance Metrics Overview
Monthly Airbnb Revenue Variations & Income Potential in Los Mochis (2026)
Understanding the monthly revenue variations for Airbnb listings in Los Mochis is key to maximizing your short term rental income potential. Seasonality significantly impacts earnings. Our analysis, based on data from the past 12 months, shows that the peak revenue month for STRs in Los Mochis is typically December, while June often presents the lowest earnings, highlighting opportunities for strategic pricing adjustments during shoulder and low seasons. Explore the typical Airbnb income in Los Mochis across different performance tiers:
- Best-in-class properties (Top 10%) achieve $1,016+ monthly, often utilizing dynamic pricing and superior guest experiences.
- Strong performing properties (Top 25%) earn $667 or more, indicating effective management and desirable locations/amenities.
- Typical properties (Median) generate around $366 per month, representing the average market performance.
- Entry-level properties (Bottom 25%) see earnings around $189, often with potential for optimization.
Average Monthly Airbnb Earnings Trend in Los Mochis
Los Mochis Airbnb Occupancy Rate Trends (2026)
Maximize your bookings by understanding the Los Mochis STR occupancy trends. Seasonal demand shifts significantly influence how often properties are booked. Typically, Decembersees the highest demand (peak season occupancy), while January experiences the lowest (low season). Effective strategies, like adjusting minimum stays or offering promotions, can boost occupancy during slower periods. Here's how different property tiers perform in Los Mochis:
- Best-in-class properties (Top 10%) achieve 72%+ occupancy, indicating high desirability and potentially optimized availability.
- Strong performing properties (Top 25%) maintain 52% or higher occupancy, suggesting good market fit and guest satisfaction.
- Typical properties (Median) have an occupancy rate around 30%.
- Entry-level properties (Bottom 25%) average 15% occupancy, potentially facing higher vacancy.
Average Monthly Occupancy Rate Trend in Los Mochis
Average Daily Rate (ADR) Airbnb Trends in Los Mochis (2026)
Effective short term rental pricing strategy in Los Mochis involves understanding monthly ADR fluctuations. The Average Daily Rate (ADR) for Airbnb in Los Mochis typically peaks in December and dips lowest during April. Leveraging Airbnb dynamic pricing tools or strategies based on this seasonality can significantly boost revenue. Here's a look at the typical nightly rates achieved:
- Best-in-class properties (Top 10%) command rates of $91+ per night, often due to premium features or locations.
- Strong performing properties (Top 25%) achieve nightly rates of $56 or more.
- Typical properties (Median) charge around $40 per night.
- Entry-level properties (Bottom 25%) earn around $28 per night.
Average Daily Rate (ADR) Trend by Month in Los Mochis
Get Live Los Mochis Market Intelligence 👇

Explore Real-time Analytics
Airbnb Seasonality Analysis & Trends in Los Mochis (2026)
Peak Season (December, November, April)
- Revenue averages $627 per month
- Occupancy rates average 41.0%
- Daily rates average $51
Shoulder Season
- Revenue averages $486 per month
- Occupancy maintains around 35.2%
- Daily rates hold near $50
Low Season (May, June, September)
- Revenue drops to average $407 per month
- Occupancy decreases to average 30.2%
- Daily rates adjust to average $50
Seasonality Insights for Los Mochis
- The Airbnb seasonality in Los Mochis shows highly seasonal trends requiring careful strategy. While the sections above show seasonal averages, it's also insightful to look at the extremes:
- During the high season, the absolute peak month showcases Los Mochis's highest earning potential, with monthly revenues capable of climbing to $774, occupancy reaching a high of 46.5%, and ADRs peaking at $55.
- Conversely, the slowest single month of the year, typically falling within the low season, marks the market's lowest point. In this month, revenue might dip to $406, occupancy could drop to 28.4%, and ADRs may adjust down to $46.
- Understanding both the seasonal averages and these monthly peaks and troughs in revenue, occupancy, and ADR is crucial for maximizing your Airbnb profit potential in Los Mochis.
Seasonal Strategies for Maximizing Profit
- Peak Season: Maximize revenue through premium pricing and potentially longer minimum stays. Ensure high availability.
- Low Season: Offer competitive pricing, special promotions (e.g., extended stay discounts), and flexible cancellation policies. Target off-season travelers like remote workers or budget-conscious guests.
- Shoulder Seasons: Implement dynamic pricing that balances peak and low rates. Target weekend travelers or specific events. Offer slightly more flexible terms than peak season.
- Regularly analyze your own performance against these Los Mochis seasonality benchmarks and adjust your pricing and availability strategy accordingly.
Best Areas for Airbnb Investment in Los Mochis (2026)
Exploring the top neighborhoods for short-term rentals in Los Mochis? This section highlights key areas, outlining why they are attractive for hosts and guests, along with notable local attractions. Consider these locations based on your target guest profile and investment strategy.
| Neighborhood / Area | Why Host Here? (Target Guests & Appeal) | Key Attractions & Landmarks |
|---|---|---|
| Centro | The heart of Los Mochis, offering historical sites, dining, and shopping. A cultural hub with easy access to various attractions makes it ideal for tourists. | N/A |
| Plaza de la Libertad | A vibrant area known for its lively atmosphere, restaurants, and local shops. Great for travelers looking to experience local culture and cuisine. | N/A |
| Parque Sinaloa | A large public park that offers green spaces, playgrounds, and walking paths. A popular spot for families and those looking to enjoy outdoor activities. | N/A |
| Los Mochis Marina | Beautiful waterfront area perfect for those interested in boating and fishing. Attracts visitors seeking relaxation and water activities. | N/A |
| El Faro | Fantastic location for visitors interested in local history and architecture, with the iconic lighthouse as a landmark. | N/A |
| Cinemex Los Mochis | Central location for entertainment, popular with tourists looking for leisure activities, including films and dining options nearby. | N/A |
| Estadio Emilio Ibarra Almada | Home to local sports events, attracting sports enthusiasts and fans, providing a unique local experience. | N/A |
| Las Villa's | A residential area that offers a more local living experience, attractive for families and long-term visitors wanting to explore beyond typical tourist spots. | N/A |
Understanding Airbnb License Requirements & STR Laws in Los Mochis (2026)
While Los Mochis, Sinaloa, Mexico currently shows low STR regulations, specific Airbnb license requirements might still exist or change. Always verify the latest short term rental regulations and Airbnb license requirements directly with local government authorities for Los Mochis to ensure full compliance before hosting.
(Source: AirROI data, 2026, based on 0% licensed listings)
Top Performing Airbnb Properties in Los Mochis (2026)
Benchmark your potential! Explore examples of top-performing Airbnb properties in Los Mochisbased on Trailing Twelve Month (TTM) revenue. Analyze their characteristics, revenue, occupancy rate, and ADR to understand what drives success in this market.

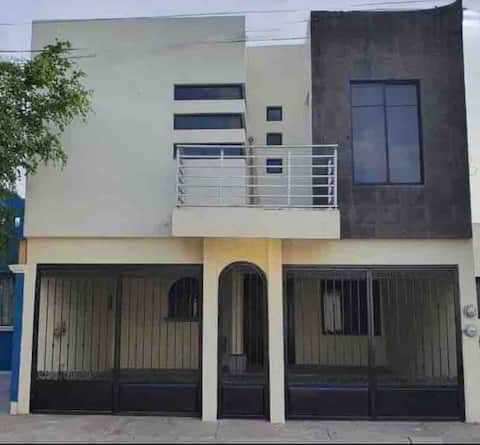
House in Residential Area | Controlled Access | Topolobamp
Entire Place • 4 bedrooms
Casa Jade. We bill!
Entire Place • 4 bedrooms
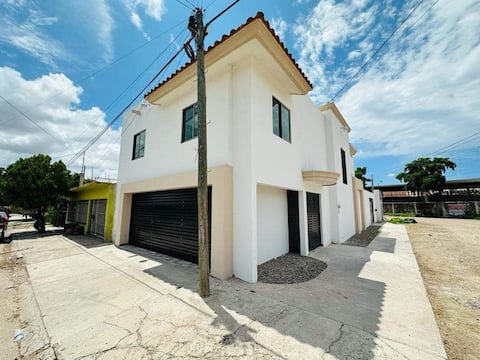
Excellent family stay.
Entire Place • 5 bedrooms

CASA INGENIO Deep Inside Los Mochis
Entire Place • 3 bedrooms
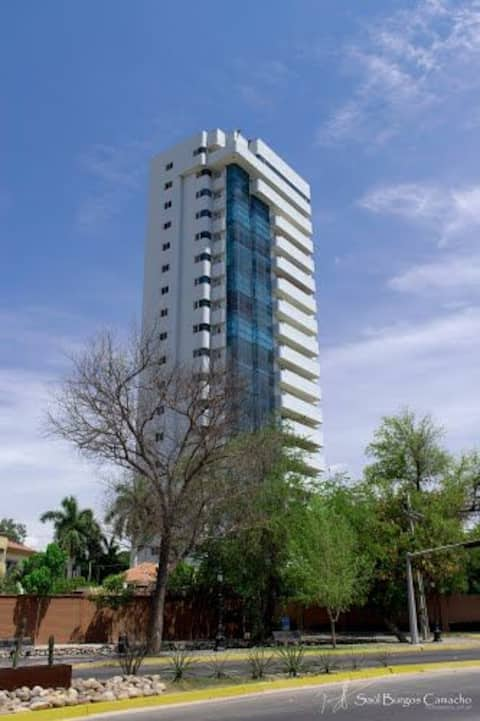
Condominium 401. Torre San Bernardo Los Mochis Sin
Entire Place • 4 bedrooms
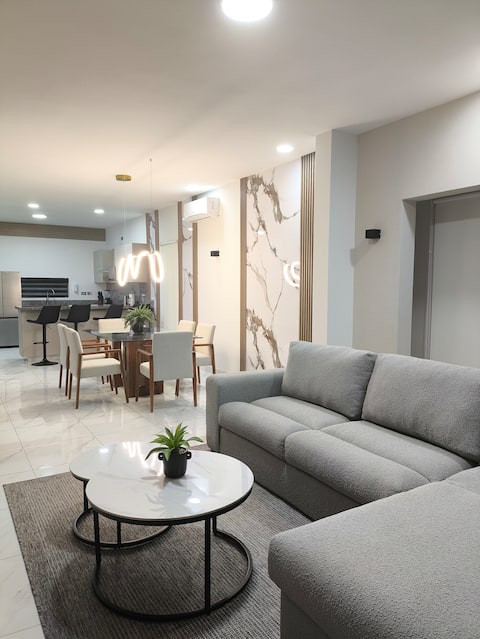
Luxury apartment in Viñedos #04
Entire Place • 2 bedrooms
Note: Performance varies based on location, size, amenities, seasonality, and management quality. Data reflects the past 12 months.
Top Performing Airbnb Hosts in Los Mochis (2026)
Learn from the best! This table showcases top-performing Airbnb hosts in Los Mochis based on the number of properties managed and estimated total revenue over the past year. Analyze their scale and performance metrics.
| Host Name | Properties | Grossing Revenue | Stay Reviews | Avg Rating |
|---|---|---|---|---|
| Ernesto | 15 | $108,969 | 2336 | 4.95/5.0 |
| Ernesto | 11 | $64,035 | 1026 | 4.85/5.0 |
| Nicolas | 6 | $49,311 | 379 | 4.89/5.0 |
| Arturo | 6 | $48,390 | 425 | 4.76/5.0 |
| Luis | 14 | $36,560 | 860 | 4.87/5.0 |
| Azucena | 5 | $34,750 | 322 | 4.86/5.0 |
| Bernardo X | 4 | $29,181 | 108 | 4.82/5.0 |
| Melissa | 3 | $24,713 | 291 | 4.94/5.0 |
| Jose Alfredo | 3 | $24,085 | 296 | 4.92/5.0 |
| Maria | 2 | $23,597 | 147 | 4.88/5.0 |
Analyzing the strategies of top hosts, such as their property selection, pricing, and guest communication, can offer valuable lessons for optimizing your own Airbnb operations in Los Mochis.
Dive Deeper: Advanced Los Mochis STR Market Data (2026)
Ready to unlock more insights? AirROI provides access to advanced metrics and comprehensive Airbnb data for Los Mochis. Explore detailed analytics beyond this report to refine your investment strategy, optimize pricing, and maximize your vacation rental profits.
Explore Advanced MetricsLos Mochis Short-Term Rental Market Composition (2026): Property & Room Types
Room Type Distribution
Property Type Distribution
Market Composition Insights for Los Mochis
- The Los Mochis Airbnb market composition is heavily skewed towards Entire Home/Apt listings, which make up 89.7% of the 329 active rentals. This indicates strong guest preference for privacy and space.
- Looking at the property type distribution in Los Mochis, Apartment/Condo properties are the most common (51.1%), reflecting the local real estate landscape.
- Houses represent a significant 43.2% portion, catering likely to families or larger groups.
- Smaller segments like hotel/boutique, others (combined 5.7%) offer potential for unique stay experiences.
Los Mochis Airbnb Room Capacity Analysis (2026): Bedroom Distribution
Distribution of Listings by Number of Bedrooms
Room Capacity Insights for Los Mochis
- The dominant room capacity in Los Mochis is 1 bedroom listings, making up 42.9% of the market. This suggests a strong demand for properties suitable for couples or solo travelers.
- Together, 1 bedroom and 2 bedrooms properties represent 74.5% of the active Airbnb listings in Los Mochis, indicating a high concentration in these sizes.
- A significant 20.7% of listings offer 3+ bedrooms, catering to larger groups and families seeking more space in Los Mochis.
Los Mochis Vacation Rental Guest Capacity Trends (2026)
Distribution of Listings by Guest Capacity
Guest Capacity Insights for Los Mochis
- The most common guest capacity trend in Los Mochis vacation rentals is listings accommodating 2 guests (29.2%). This suggests the primary traveler segment is likely couples or solo travelers.
- Properties designed for 2 guests and 4 guests dominate the Los Mochis STR market, accounting for 52.0% of listings.
- 27.3% of properties accommodate 6+ guests, serving the market segment for larger families or group travel in Los Mochis.
- On average, properties in Los Mochis are equipped to host 4.0 guests.
Los Mochis Airbnb Booking Patterns (2026): Available vs. Booked Days
Available Days Distribution
Booked Days Distribution
Booking Pattern Insights for Los Mochis
- The most common availability pattern in Los Mochis falls within the 271-366 days range, representing 55.3% of listings. This suggests many properties have significant open periods on their calendars.
- Approximately 88.7% of listings show high availability (181+ days open annually), indicating potential for increased bookings or specific owner usage patterns.
- For booked days, the 91-180 days range is most frequent in Los Mochis (35%), reflecting common guest stay durations or potential owner blocking patterns.
- A notable 11.8% of properties secure long booking periods (181+ days booked per year), highlighting successful long-term rental strategies or significant owner usage.
Los Mochis Airbnb Minimum Stay Requirements Analysis
Distribution of Listings by Minimum Night Requirement
1 Night
193 listings
58.7% of total
2 Nights
76 listings
23.1% of total
3 Nights
5 listings
1.5% of total
4-6 Nights
1 listings
0.3% of total
30+ Nights
54 listings
16.4% of total
Key Insights
- The most prevalent minimum stay requirement in Los Mochis is 1 Night, adopted by 58.7% of listings. This highlights the market's preference for shorter, flexible bookings.
- A strong majority (81.8%) of the Los Mochis Airbnb data shows acceptance of very short stays (1-2 nights), indicating a dynamic, high-turnover market.
- A significant segment (16.4%) caters to monthly stays (30+ nights) in Los Mochis, pointing to opportunities in the extended-stay market.
Recommendations
- Align with the market by considering a 1 Night minimum stay, as 58.7% of Los Mochis hosts use this setting.
- Explore offering discounts for stays of 30+ nights to attract the 16.4% of the market seeking extended stays.
- Adjust minimum nights based on seasonality – potentially shorter during low season and longer during peak demand periods in Los Mochis.
Los Mochis Airbnb Cancellation Policy Trends Analysis (2026)
Limited
10 listings
3% of total
Flexible
190 listings
57.9% of total
Moderate
73 listings
22.3% of total
Firm
51 listings
15.5% of total
Strict
4 listings
1.2% of total
Cancellation Policy Insights for Los Mochis
- The prevailing Airbnb cancellation policy trend in Los Mochis is Flexible, used by 57.9% of listings.
- The market strongly favors guest-friendly terms, with 80.2% of listings offering Flexible or Moderate policies. This suggests guests in Los Mochis may expect booking flexibility.
- Strict cancellation policies are quite rare (1.2%), potentially making listings with this policy less competitive unless justified by high demand or property type.
Recommendations for Hosts
- Consider adopting a Flexible policy to align with the 57.9% market standard in Los Mochis.
- Given the high prevalence of Flexible policies (57.9%), offering this can enhance booking appeal, especially during shoulder seasons.
- Using a Strict policy might deter some guests, as only 1.2% of listings use it. Evaluate if potential revenue protection outweighs possible lower booking rates.
- Regularly review your cancellation policy against competitors and market demand shifts in Los Mochis.
Los Mochis STR Booking Lead Time Analysis (2026)
Average Booking Lead Time by Month
Booking Lead Time Insights for Los Mochis
- The overall average booking lead time for vacation rentals in Los Mochis is 20 days.
- Guests book furthest in advance for stays during December (average 30 days), likely coinciding with peak travel demand or local events.
- The shortest booking windows occur for stays in June (average 10 days), indicating more last-minute travel plans during this time.
- Seasonally, Winter (19 days avg.) sees the longest lead times, while Summer (14 days avg.) has the shortest, reflecting typical travel planning cycles.
Recommendations for Hosts
- Use the overall average lead time (20 days) as a baseline for your pricing and availability strategy in Los Mochis.
- During June, focus on last-minute booking availability and promotions, as guests book with very short notice (10 days avg.).
- Target marketing efforts for the Winter season well in advance (at least 19 days) to capture early planners.
- Monitor your own booking lead times against these Los Mochis averages to identify opportunities for dynamic pricing adjustments.
Popular & Essential Airbnb Amenities in Los Mochis (2026)
Amenity Prevalence
Amenity Insights for Los Mochis
- Essential amenities in Los Mochis that guests expect include: Wifi, Air conditioning, TV. Lacking these (any) could significantly impact bookings.
- Popular amenities like Kitchen, Hot water, Dishes and silverware are common but not universal. Offering these can provide a competitive edge.
Recommendations for Hosts
- Ensure your listing includes all essential amenities for Los Mochis: Wifi, Air conditioning, TV.
- Prioritize adding missing essentials: Wifi, Air conditioning, TV.
- Consider adding popular differentiators like Kitchen or Hot water to increase appeal.
- Highlight unique or less common amenities you offer (e.g., hot tub, dedicated workspace, EV charger) in your listing description and photos.
- Regularly check competitor amenities in Los Mochis to stay competitive.
Los Mochis Airbnb Guest Demographics & Profile Analysis (2026)
Guest Profile Summary for Los Mochis
- The typical guest profile for Airbnb in Los Mochis consists of primarily domestic travelers (86%), often arriving from nearby Culiacán, typically belonging to the Post-2000s (Gen Z/Alpha) group (50%), primarily speaking Spanish or English.
- Domestic travelers account for 86.2% of guests.
- Key international markets include Mexico (86.2%) and United States (11.1%).
- Top languages spoken are Spanish (60.3%) followed by English (34.6%).
- A significant demographic segment is the Post-2000s (Gen Z/Alpha) group, representing 50% of guests.
Recommendations for Hosts
- Target domestic marketing efforts towards travelers from Culiacán and Los Mochis.
- Tailor amenities and listing descriptions to appeal to the dominant Post-2000s (Gen Z/Alpha) demographic (e.g., highlight fast WiFi, smart home features, local guides).
- Highlight unique local experiences or amenities relevant to the primary guest profile.
- Consider seasonal promotions aligned with peak travel times for key origin markets.
Nearby Short-Term Rental Market Comparison
How does the Los Mochis Airbnb market stack up against its neighbors? Compare key performance metrics like average monthly revenue, ADR, and occupancy rates in surrounding areas to understand the broader regional STR landscape.
| Market | Active Properties | Monthly Revenue | Daily Rate | Avg. Occupancy |
|---|---|---|---|---|
| La Ventana | 144 | $1,326 | $183.36 | 31% |
| El Sargento | 262 | $905 | $153.87 | 30% |
| Camahuiroa | 10 | $577 | $298.19 | 17% |
| Sinaloa | 11 | $301 | $114.42 | 16% |
| Guasave | 45 | $298 | $49.47 | 30% |
| Guamúchil | 10 | $272 | $41.55 | 26% |
| El Fuerte | 32 | $233 | $66.20 | 22% |
| Nuevo Altata | 116 | $229 | $109.82 | 16% |
| Altata | 15 | $213 | $119.98 | 17% |
| Culiacán Rosales | 413 | $212 | $48.55 | 26% |