Tamasopo Airbnb Market Analysis 2026: Short Term Rental Data & Vacation Rental Statistics in San Luis Potosí, Mexico
Is Airbnb profitable in Tamasopo in 2026? Explore comprehensive Airbnb analytics for Tamasopo, San Luis Potosí, Mexico to uncover income potential. This 2026 STR market report for Tamasopo, based on AirROI data from February 2025 to January 2026, reveals key trends in the niche market of 95 active listings.
Whether you're considering an Airbnb investment in Tamasopo, optimizing your existing vacation rental, or exploring rental arbitrage opportunities, understanding the Tamasopo Airbnb data is crucial. Leveraging the low regulation environment is key to maximizing your short term rental income potential. Let's dive into the specifics.
Key Tamasopo Airbnb Performance Metrics Overview
Monthly Airbnb Revenue Variations & Income Potential in Tamasopo (2026)
Understanding the monthly revenue variations for Airbnb listings in Tamasopo is key to maximizing your short term rental income potential. Seasonality significantly impacts earnings. Our analysis, based on data from the past 12 months, shows that the peak revenue month for STRs in Tamasopo is typically April, while March often presents the lowest earnings, highlighting opportunities for strategic pricing adjustments during shoulder and low seasons. Explore the typical Airbnb income in Tamasopo across different performance tiers:
- Best-in-class properties (Top 10%) achieve $1,777+ monthly, often utilizing dynamic pricing and superior guest experiences.
- Strong performing properties (Top 25%) earn $772 or more, indicating effective management and desirable locations/amenities.
- Typical properties (Median) generate around $301 per month, representing the average market performance.
- Entry-level properties (Bottom 25%) see earnings around $133, often with potential for optimization.
Average Monthly Airbnb Earnings Trend in Tamasopo
Tamasopo Airbnb Occupancy Rate Trends (2026)
Maximize your bookings by understanding the Tamasopo STR occupancy trends. Seasonal demand shifts significantly influence how often properties are booked. Typically, Aprilsees the highest demand (peak season occupancy), while January experiences the lowest (low season). Effective strategies, like adjusting minimum stays or offering promotions, can boost occupancy during slower periods. Here's how different property tiers perform in Tamasopo:
- Best-in-class properties (Top 10%) achieve 41%+ occupancy, indicating high desirability and potentially optimized availability.
- Strong performing properties (Top 25%) maintain 25% or higher occupancy, suggesting good market fit and guest satisfaction.
- Typical properties (Median) have an occupancy rate around 15%.
- Entry-level properties (Bottom 25%) average 8% occupancy, potentially facing higher vacancy.
Average Monthly Occupancy Rate Trend in Tamasopo
Average Daily Rate (ADR) Airbnb Trends in Tamasopo (2026)
Effective short term rental pricing strategy in Tamasopo involves understanding monthly ADR fluctuations. The Average Daily Rate (ADR) for Airbnb in Tamasopo typically peaks in January and dips lowest during March. Leveraging Airbnb dynamic pricing tools or strategies based on this seasonality can significantly boost revenue. Here's a look at the typical nightly rates achieved:
- Best-in-class properties (Top 10%) command rates of $195+ per night, often due to premium features or locations.
- Strong performing properties (Top 25%) achieve nightly rates of $116 or more.
- Typical properties (Median) charge around $62 per night.
- Entry-level properties (Bottom 25%) earn around $41 per night.
Average Daily Rate (ADR) Trend by Month in Tamasopo
Get Live Tamasopo Market Intelligence 👇

Explore Real-time Analytics
Airbnb Seasonality Analysis & Trends in Tamasopo (2026)
Peak Season (April, June, August)
- Revenue averages $935 per month
- Occupancy rates average 26.8%
- Daily rates average $95
Shoulder Season
- Revenue averages $680 per month
- Occupancy maintains around 17.6%
- Daily rates hold near $104
Low Season (February, March, November)
- Revenue drops to average $480 per month
- Occupancy decreases to average 15.4%
- Daily rates adjust to average $95
Seasonality Insights for Tamasopo
- The Airbnb seasonality in Tamasopo shows highly seasonal trends requiring careful strategy. While the sections above show seasonal averages, it's also insightful to look at the extremes:
- During the high season, the absolute peak month showcases Tamasopo's highest earning potential, with monthly revenues capable of climbing to $1,153, occupancy reaching a high of 37.5%, and ADRs peaking at $115.
- Conversely, the slowest single month of the year, typically falling within the low season, marks the market's lowest point. In this month, revenue might dip to $449, occupancy could drop to 13.2%, and ADRs may adjust down to $87.
- Understanding both the seasonal averages and these monthly peaks and troughs in revenue, occupancy, and ADR is crucial for maximizing your Airbnb profit potential in Tamasopo.
Seasonal Strategies for Maximizing Profit
- Peak Season: Maximize revenue through premium pricing and potentially longer minimum stays. Ensure high availability.
- Low Season: Offer competitive pricing, special promotions (e.g., extended stay discounts), and flexible cancellation policies. Target off-season travelers like remote workers or budget-conscious guests.
- Shoulder Seasons: Implement dynamic pricing that balances peak and low rates. Target weekend travelers or specific events. Offer slightly more flexible terms than peak season.
- Regularly analyze your own performance against these Tamasopo seasonality benchmarks and adjust your pricing and availability strategy accordingly.
Best Areas for Airbnb Investment in Tamasopo (2026)
Exploring the top neighborhoods for short-term rentals in Tamasopo? This section highlights key areas, outlining why they are attractive for hosts and guests, along with notable local attractions. Consider these locations based on your target guest profile and investment strategy.
| Neighborhood / Area | Why Host Here? (Target Guests & Appeal) | Key Attractions & Landmarks |
|---|---|---|
| Cascadas de Tamasopo | A stunning natural attraction featuring beautiful waterfalls and lush surroundings, ideal for nature lovers and adventure seekers. | Cascadas de Tamasopo, Cueva del Diablo, Parque de Aventura, naturaleza virgen, actividades al aire libre |
| Sótano de las Huahuas | A unique cave system popular for its distinctive formations and wildlife, offering an adventurous experience for tourists interested in caving and exploration. | Sótano de las Huahuas, avistamiento de aves, exploración de cuevas |
| El Puente de Dios | An incredible natural bridge and swimming area that draws visitors for its crystal-clear waters and beautiful scenery, perfect for relaxation and outdoor activities. | El Puente de Dios, piscina natural, senderismo, naturaleza |
| Cañon del Sumidero | A breathtaking canyon that provides thrilling boat rides and stunning vistas, making it a popular destination for adventurous travelers. | Cañon del Sumidero, paseos en bote, paisajes impresionantes |
| Misión de Tamasopo | A historical site that showcases the local culture and colonial architecture, attracting tourists interested in history and heritage. | Misión de Tamasopo, arquitectura colonial, cultura local |
| La Huasteca Potosina | A region known for its breathtaking landscapes and rich cultural heritage, suitable for ecotourism and adventure sports. | La Huasteca Potosina, actividades ecoturísticas, paisajes naturales |
| Grutas de la Cueva de la Virgen | An underground cavern system that features impressive stalactites and stalagmites, offering a mystical experience for visitors. | Grutas de la Cueva de la Virgen, formaciones geológicas, turismo de aventura |
| San Luis Potosí Centro | The capital city offers vibrant cultural experiences, local cuisine, and historical sites, attracting both leisure and business travelers. | Centro Histórico, Teatro de la Paz, museos locales, plazas y parque, gastronomía |
Understanding Airbnb License Requirements & STR Laws in Tamasopo (2026)
While Tamasopo, San Luis Potosí, Mexico currently shows low STR regulations, specific Airbnb license requirements might still exist or change. Always verify the latest short term rental regulations and Airbnb license requirements directly with local government authorities for Tamasopo to ensure full compliance before hosting.
(Source: AirROI data, 2026, finding no licensed listings among those analyzed)
Top Performing Airbnb Properties in Tamasopo (2026)
Benchmark your potential! Explore examples of top-performing Airbnb properties in Tamasopobased on Trailing Twelve Month (TTM) revenue. Analyze their characteristics, revenue, occupancy rate, and ADR to understand what drives success in this market.
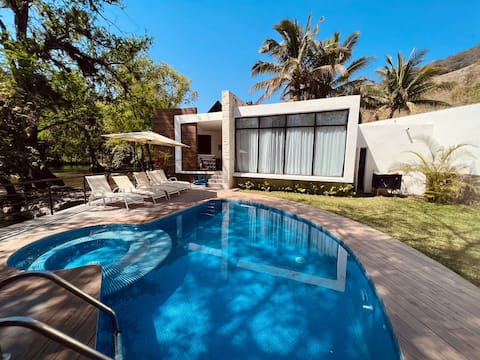
Luxury riverfront suites in Tamasopo SLP
Entire Place • 3 bedrooms

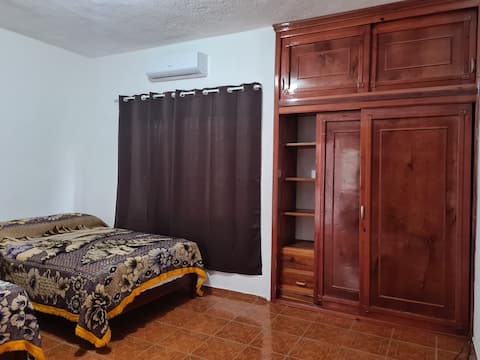
Finca Los Abuelos
Entire Place • 4 bedrooms

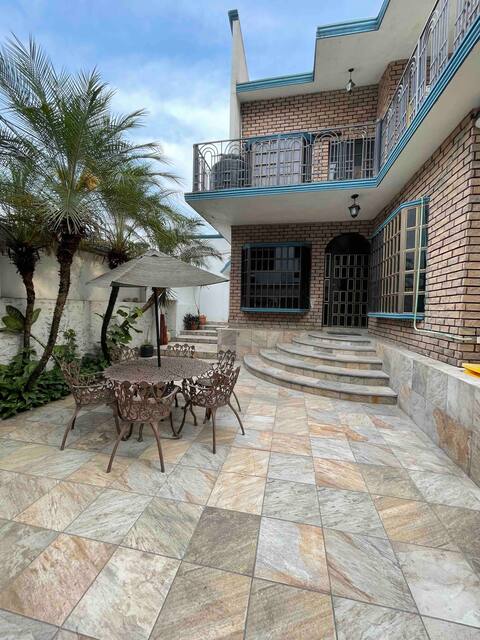
Casa Rodríguez
Entire Place • 3 bedrooms

Casa Don Alfredo, excellent location
Entire Place • 3 bedrooms
casa hidalgo
Entire Place • 4 bedrooms
Colinas de Tamasopo House
Entire Place • 5 bedrooms
Note: Performance varies based on location, size, amenities, seasonality, and management quality. Data reflects the past 12 months.
Top Performing Airbnb Hosts in Tamasopo (2026)
Learn from the best! This table showcases top-performing Airbnb hosts in Tamasopo based on the number of properties managed and estimated total revenue over the past year. Analyze their scale and performance metrics.
| Host Name | Properties | Grossing Revenue | Stay Reviews | Avg Rating |
|---|---|---|---|---|
| Verónica | 1 | $75,530 | 7 | 4.00/5.0 |
| Arantxa | 1 | $37,173 | 19 | 5.00/5.0 |
| Joel De Jesus | 10 | $31,356 | 515 | 4.70/5.0 |
| Luis | 4 | $31,258 | 117 | 4.79/5.0 |
| Isari | 1 | $23,421 | 89 | 4.89/5.0 |
| Lenel | 2 | $21,932 | 49 | 4.74/5.0 |
| Alberto | 1 | $20,431 | 55 | 4.82/5.0 |
| Oscar | 1 | $20,072 | 55 | 4.45/5.0 |
| Juan De Dios | 1 | $19,928 | 10 | 4.80/5.0 |
| Araceli | 5 | $16,980 | 85 | 4.73/5.0 |
Analyzing the strategies of top hosts, such as their property selection, pricing, and guest communication, can offer valuable lessons for optimizing your own Airbnb operations in Tamasopo.
Dive Deeper: Advanced Tamasopo STR Market Data (2026)
Ready to unlock more insights? AirROI provides access to advanced metrics and comprehensive Airbnb data for Tamasopo. Explore detailed analytics beyond this report to refine your investment strategy, optimize pricing, and maximize your vacation rental profits.
Explore Advanced MetricsTamasopo Short-Term Rental Market Composition (2026): Property & Room Types
Room Type Distribution
Property Type Distribution
Market Composition Insights for Tamasopo
- The Tamasopo Airbnb market composition is heavily skewed towards Private Room listings, which make up 64.2% of the 95 active rentals. This indicates strong guest preference for privacy and space.
- Looking at the property type distribution in Tamasopo, Hotel/Boutique properties are the most common (38.9%), reflecting the local real estate landscape.
- Houses represent a significant 34.7% portion, catering likely to families or larger groups.
- The presence of 38.9% Hotel/Boutique listings indicates integration with traditional hospitality.
- Smaller segments like others (combined 1.1%) offer potential for unique stay experiences.
Tamasopo Airbnb Room Capacity Analysis (2026): Bedroom Distribution
Distribution of Listings by Number of Bedrooms
Room Capacity Insights for Tamasopo
- The dominant room capacity in Tamasopo is 1 bedroom listings, making up 50.5% of the market. This suggests a strong demand for properties suitable for couples or solo travelers.
- Together, 1 bedroom and 2 bedrooms properties represent 65.2% of the active Airbnb listings in Tamasopo, indicating a high concentration in these sizes.
- With over half the market (50.5%) consisting of studios or 1-bedroom units, Tamasopo is particularly well-suited for individuals or couples.
- A significant 22.2% of listings offer 3+ bedrooms, catering to larger groups and families seeking more space in Tamasopo.
Tamasopo Vacation Rental Guest Capacity Trends (2026)
Distribution of Listings by Guest Capacity
Guest Capacity Insights for Tamasopo
- The most common guest capacity trend in Tamasopo vacation rentals is listings accommodating 4 guests (32.6%). This suggests the primary traveler segment is likely small families or groups.
- Properties designed for 4 guests and 8+ guests dominate the Tamasopo STR market, accounting for 63.1% of listings.
- 37.9% of properties accommodate 6+ guests, serving the market segment for larger families or group travel in Tamasopo.
- On average, properties in Tamasopo are equipped to host 4.7 guests.
Tamasopo Airbnb Booking Patterns (2026): Available vs. Booked Days
Available Days Distribution
Booked Days Distribution
Booking Pattern Insights for Tamasopo
- The most common availability pattern in Tamasopo falls within the 271-366 days range, representing 86.3% of listings. This suggests many properties have significant open periods on their calendars.
- Approximately 98.9% of listings show high availability (181+ days open annually), indicating potential for increased bookings or specific owner usage patterns.
- For booked days, the 1-30 days range is most frequent in Tamasopo (49.5%), reflecting common guest stay durations or potential owner blocking patterns.
- A notable 1.1% of properties secure long booking periods (181+ days booked per year), highlighting successful long-term rental strategies or significant owner usage.
Tamasopo Airbnb Minimum Stay Requirements Analysis
Distribution of Listings by Minimum Night Requirement
1 Night
84 listings
88.4% of total
2 Nights
5 listings
5.3% of total
30+ Nights
6 listings
6.3% of total
Key Insights
- The most prevalent minimum stay requirement in Tamasopo is 1 Night, adopted by 88.4% of listings. This highlights the market's preference for shorter, flexible bookings.
- A strong majority (93.7%) of the Tamasopo Airbnb data shows acceptance of very short stays (1-2 nights), indicating a dynamic, high-turnover market.
Recommendations
- Align with the market by considering a 1 Night minimum stay, as 88.4% of Tamasopo hosts use this setting.
- Explore offering discounts for stays of 30+ nights to attract the 6.3% of the market seeking extended stays.
- Adjust minimum nights based on seasonality – potentially shorter during low season and longer during peak demand periods in Tamasopo.
Tamasopo Airbnb Cancellation Policy Trends Analysis (2026)
Flexible
50 listings
52.6% of total
Moderate
22 listings
23.2% of total
Firm
17 listings
17.9% of total
Strict
6 listings
6.3% of total
Cancellation Policy Insights for Tamasopo
- The prevailing Airbnb cancellation policy trend in Tamasopo is Flexible, used by 52.6% of listings.
- The market strongly favors guest-friendly terms, with 75.8% of listings offering Flexible or Moderate policies. This suggests guests in Tamasopo may expect booking flexibility.
- Strict cancellation policies are quite rare (6.3%), potentially making listings with this policy less competitive unless justified by high demand or property type.
Recommendations for Hosts
- Consider adopting a Flexible policy to align with the 52.6% market standard in Tamasopo.
- Given the high prevalence of Flexible policies (52.6%), offering this can enhance booking appeal, especially during shoulder seasons.
- Using a Strict policy might deter some guests, as only 6.3% of listings use it. Evaluate if potential revenue protection outweighs possible lower booking rates.
- Regularly review your cancellation policy against competitors and market demand shifts in Tamasopo.
Tamasopo STR Booking Lead Time Analysis (2026)
Average Booking Lead Time by Month
Booking Lead Time Insights for Tamasopo
- The overall average booking lead time for vacation rentals in Tamasopo is 32 days.
- Guests book furthest in advance for stays during May (average 64 days), likely coinciding with peak travel demand or local events.
- The shortest booking windows occur for stays in February (average 8 days), indicating more last-minute travel plans during this time.
- Seasonally, Spring (41 days avg.) sees the longest lead times, while Winter (17 days avg.) has the shortest, reflecting typical travel planning cycles.
Recommendations for Hosts
- Use the overall average lead time (32 days) as a baseline for your pricing and availability strategy in Tamasopo.
- For May stays, consider implementing length-of-stay discounts or slightly higher rates for bookings made less than 64 days out to capitalize on advance planning.
- During February, focus on last-minute booking availability and promotions, as guests book with very short notice (8 days avg.).
- Target marketing efforts for the Spring season well in advance (at least 41 days) to capture early planners.
- Monitor your own booking lead times against these Tamasopo averages to identify opportunities for dynamic pricing adjustments.
Popular & Essential Airbnb Amenities in Tamasopo (2026)
Amenity Prevalence
Amenity Insights for Tamasopo
- Essential amenities in Tamasopo that guests expect include: Air conditioning, Wifi. Lacking these (any) could significantly impact bookings.
- Popular amenities like Free parking on premises, Hot water, TV are common but not universal. Offering these can provide a competitive edge.
Recommendations for Hosts
- Ensure your listing includes all essential amenities for Tamasopo: Air conditioning, Wifi.
- Prioritize adding missing essentials: Wifi.
- Consider adding popular differentiators like Free parking on premises or Hot water to increase appeal.
- Highlight unique or less common amenities you offer (e.g., hot tub, dedicated workspace, EV charger) in your listing description and photos.
- Regularly check competitor amenities in Tamasopo to stay competitive.
Tamasopo Airbnb Guest Demographics & Profile Analysis (2026)
Guest Profile Summary for Tamasopo
- The typical guest profile for Airbnb in Tamasopo consists of primarily domestic travelers (85%), often arriving from nearby San Luis Potosi, typically belonging to the Post-2000s (Gen Z/Alpha) group (50%), primarily speaking Spanish or English.
- Domestic travelers account for 85.3% of guests.
- Key international markets include Mexico (85.3%) and United States (10.1%).
- Top languages spoken are Spanish (53.5%) followed by English (35.6%).
- A significant demographic segment is the Post-2000s (Gen Z/Alpha) group, representing 50% of guests.
Recommendations for Hosts
- Target domestic marketing efforts towards travelers from San Luis Potosi and Santiago de Querétaro.
- Tailor amenities and listing descriptions to appeal to the dominant Post-2000s (Gen Z/Alpha) demographic (e.g., highlight fast WiFi, smart home features, local guides).
- Highlight unique local experiences or amenities relevant to the primary guest profile.
- Consider seasonal promotions aligned with peak travel times for key origin markets.
Nearby Short-Term Rental Market Comparison
How does the Tamasopo Airbnb market stack up against its neighbors? Compare key performance metrics like average monthly revenue, ADR, and occupancy rates in surrounding areas to understand the broader regional STR landscape.
| Market | Active Properties | Monthly Revenue | Daily Rate | Avg. Occupancy |
|---|---|---|---|---|
| La Tortuga | 71 | $1,658 | $239.12 | 28% |
| Alcocer | 11 | $1,642 | $271.32 | 21% |
| San Miguel de Allende | 2,169 | $1,470 | $194.10 | 32% |
| Tzibantzá | 12 | $1,298 | $232.99 | 23% |
| Ezequiel Montes | 33 | $1,096 | $137.22 | 23% |
| Cañajo | 40 | $1,005 | $144.20 | 28% |
| Fraccionamiento Zirándaro | 10 | $1,002 | $101.05 | 34% |
| San Miguel | 11 | $998 | $120.23 | 25% |
| Tequisquiapan | 375 | $996 | $157.05 | 25% |
| Pinal de Amoles | 50 | $972 | $122.11 | 32% |