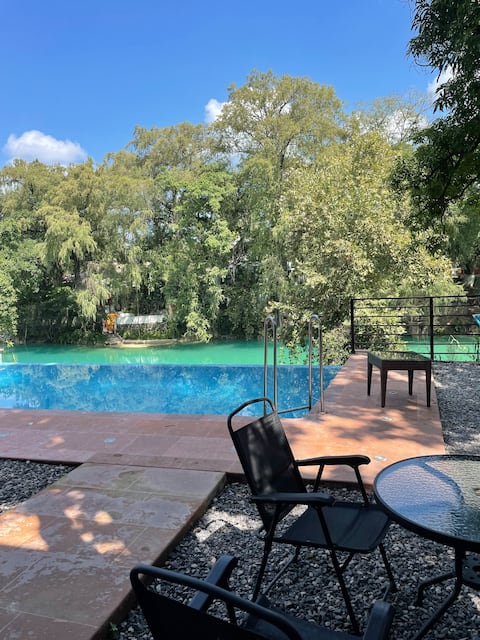
El Naranjo Airbnb Market Analysis 2026: Short Term Rental Data & Vacation Rental Statistics in San Luis Potosí, Mexico
Is Airbnb profitable in El Naranjo in 2026? Explore comprehensive Airbnb analytics for El Naranjo, San Luis Potosí, Mexico to uncover income potential. This 2026 STR market report for El Naranjo, based on AirROI data from February 2025 to January 2026, reveals key trends in the niche market of 28 active listings.
Whether you're considering an Airbnb investment in El Naranjo, optimizing your existing vacation rental, or exploring rental arbitrage opportunities, understanding the El Naranjo Airbnb data is crucial. Leveraging the low regulation environment is key to maximizing your short term rental income potential. Let's dive into the specifics.
Key El Naranjo Airbnb Performance Metrics Overview
Monthly Airbnb Revenue Variations & Income Potential in El Naranjo (2026)
Understanding the monthly revenue variations for Airbnb listings in El Naranjo is key to maximizing your short term rental income potential. Seasonality significantly impacts earnings. Our analysis, based on data from the past 12 months, shows that the peak revenue month for STRs in El Naranjo is typically April, while February often presents the lowest earnings, highlighting opportunities for strategic pricing adjustments during shoulder and low seasons. Explore the typical Airbnb income in El Naranjo across different performance tiers:
- Best-in-class properties (Top 10%) achieve $1,458+ monthly, often utilizing dynamic pricing and superior guest experiences.
- Strong performing properties (Top 25%) earn $617 or more, indicating effective management and desirable locations/amenities.
- Typical properties (Median) generate around $276 per month, representing the average market performance.
- Entry-level properties (Bottom 25%) see earnings around $118, often with potential for optimization.
Average Monthly Airbnb Earnings Trend in El Naranjo
El Naranjo Airbnb Occupancy Rate Trends (2026)
Maximize your bookings by understanding the El Naranjo STR occupancy trends. Seasonal demand shifts significantly influence how often properties are booked. Typically, Aprilsees the highest demand (peak season occupancy), while January experiences the lowest (low season). Effective strategies, like adjusting minimum stays or offering promotions, can boost occupancy during slower periods. Here's how different property tiers perform in El Naranjo:
- Best-in-class properties (Top 10%) achieve 39%+ occupancy, indicating high desirability and potentially optimized availability.
- Strong performing properties (Top 25%) maintain 27% or higher occupancy, suggesting good market fit and guest satisfaction.
- Typical properties (Median) have an occupancy rate around 14%.
- Entry-level properties (Bottom 25%) average 7% occupancy, potentially facing higher vacancy.
Average Monthly Occupancy Rate Trend in El Naranjo
Average Daily Rate (ADR) Airbnb Trends in El Naranjo (2026)
Effective short term rental pricing strategy in El Naranjo involves understanding monthly ADR fluctuations. The Average Daily Rate (ADR) for Airbnb in El Naranjo typically peaks in December and dips lowest during February. Leveraging Airbnb dynamic pricing tools or strategies based on this seasonality can significantly boost revenue. Here's a look at the typical nightly rates achieved:
- Best-in-class properties (Top 10%) command rates of $171+ per night, often due to premium features or locations.
- Strong performing properties (Top 25%) achieve nightly rates of $81 or more.
- Typical properties (Median) charge around $55 per night.
- Entry-level properties (Bottom 25%) earn around $41 per night.
Average Daily Rate (ADR) Trend by Month in El Naranjo
Get Live El Naranjo Market Intelligence 👇

Explore Real-time Analytics
Airbnb Seasonality Analysis & Trends in El Naranjo (2026)
Peak Season (April, June, May)
- Revenue averages $953 per month
- Occupancy rates average 25.9%
- Daily rates average $97
Shoulder Season
- Revenue averages $652 per month
- Occupancy maintains around 18.1%
- Daily rates hold near $106
Low Season (January, February, September)
- Revenue drops to average $387 per month
- Occupancy decreases to average 12.8%
- Daily rates adjust to average $107
Seasonality Insights for El Naranjo
- The Airbnb seasonality in El Naranjo shows highly seasonal trends requiring careful strategy. While the sections above show seasonal averages, it's also insightful to look at the extremes:
- During the high season, the absolute peak month showcases El Naranjo's highest earning potential, with monthly revenues capable of climbing to $1,022, occupancy reaching a high of 34.9%, and ADRs peaking at $116.
- Conversely, the slowest single month of the year, typically falling within the low season, marks the market's lowest point. In this month, revenue might dip to $342, occupancy could drop to 9.5%, and ADRs may adjust down to $94.
- Understanding both the seasonal averages and these monthly peaks and troughs in revenue, occupancy, and ADR is crucial for maximizing your Airbnb profit potential in El Naranjo.
Seasonal Strategies for Maximizing Profit
- Peak Season: Maximize revenue through premium pricing and potentially longer minimum stays. Ensure high availability.
- Low Season: Offer competitive pricing, special promotions (e.g., extended stay discounts), and flexible cancellation policies. Target off-season travelers like remote workers or budget-conscious guests.
- Shoulder Seasons: Implement dynamic pricing that balances peak and low rates. Target weekend travelers or specific events. Offer slightly more flexible terms than peak season.
- Regularly analyze your own performance against these El Naranjo seasonality benchmarks and adjust your pricing and availability strategy accordingly.
Best Areas for Airbnb Investment in El Naranjo (2026)
Exploring the top neighborhoods for short-term rentals in El Naranjo? This section highlights key areas, outlining why they are attractive for hosts and guests, along with notable local attractions. Consider these locations based on your target guest profile and investment strategy.
| Neighborhood / Area | Why Host Here? (Target Guests & Appeal) | Key Attractions & Landmarks |
|---|---|---|
| El Naranjo Central | The heart of El Naranjo, known for its charm and access to local culture. This area is perfect for travelers wanting to experience the authentic lifestyle of San Luis Potosí. | Plaza Principal, Local Markets, Church of El Naranjo, Cultural Events |
| Sierra Madre Vista | Stunning views and proximity to nature make this location ideal for outdoor enthusiasts and those looking to escape the city. | Sierra Madre Mountains, Hiking Trails, Nature Parks, Bird Watching |
| Lago de El Naranjo | A picturesque lake location that attracts visitors for recreational activities such as fishing, boating and picnicking. | Lakeside Activities, Fishing Spots, Scenic Views, Picnic Areas |
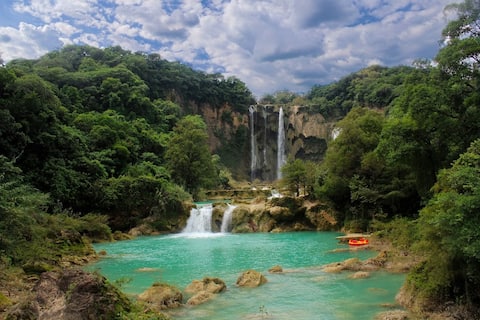
| Cascadas de El Naranjo | Famous for its waterfalls, this area is popular with nature lovers and those looking for adventure activities like hiking and photography. | El Naranjo Waterfalls, Eco-Tourism, Hiking Trails, Photography Spots |
| Local Artisans District | This area highlights local craftsmanship and culture, perfect for visitors interested in authentic local souvenirs and arts. | Artisan Workshops, Handcrafted Goods, Cultural Festivals, Local Cuisine |
| San Luis Potosí City Center | Though a bit of a distance, the city center is a major urban area for business, culture, and nightlife and attracts many visitors. | Historic Center, Museums, Shopping Districts, Restaurants |
| Wildlife Sanctuaries | Ideal for tourists wanting to experience the diverse local flora and fauna, perfect for eco-friendly travel and discovery. | Wildlife Watching, Nature Trails, Educational Tours, Conservation Areas |
| Recreational Parks | Great family-friendly areas for relaxation and play, these parks attract visitors looking to unwind and enjoy family activities. | Playgrounds, Picnic Areas, Sports Facilities, Entertainment Events |
Understanding Airbnb License Requirements & STR Laws in El Naranjo (2026)
While El Naranjo, San Luis Potosí, Mexico currently shows low STR regulations, specific Airbnb license requirements might still exist or change. Always verify the latest short term rental regulations and Airbnb license requirements directly with local government authorities for El Naranjo to ensure full compliance before hosting.
(Source: AirROI data, 2026, finding no licensed listings among those analyzed)
Top Performing Airbnb Properties in El Naranjo (2026)
Benchmark your potential! Explore examples of top-performing Airbnb properties in El Naranjobased on Trailing Twelve Month (TTM) revenue. Analyze their characteristics, revenue, occupancy rate, and ADR to understand what drives success in this market.
Casa de Campo: "El Naranjo" Hotel Taya
Entire Place • 4 bedrooms

Casa Rio Bonito
Entire Place • 3 bedrooms

El Naranjo" Tayha Hotel (Calabaza)
Private Room • 1 bedroom
House in the Cascada, Huasteca Potosina, SLP
Entire Place • 5 bedrooms
Casa Naranjo
Private Room • 6 bedrooms

El Naranjo Hotel (Yaca)
Entire Place • 1 bedroom
Note: Performance varies based on location, size, amenities, seasonality, and management quality. Data reflects the past 12 months.
Top Performing Airbnb Hosts in El Naranjo (2026)
Learn from the best! This table showcases top-performing Airbnb hosts in El Naranjo based on the number of properties managed and estimated total revenue over the past year. Analyze their scale and performance metrics.
| Host Name | Properties | Grossing Revenue | Stay Reviews | Avg Rating |
|---|---|---|---|---|
| De | 3 | $74,462 | 168 | 4.82/5.0 |
| Uriel | 5 | $15,238 | 280 | 4.72/5.0 |
| Mary | 4 | $12,808 | 36 | 4.48/5.0 |
| Nidia | 1 | $10,491 | 72 | 4.60/5.0 |
| Pedro | 1 | $10,121 | 2 | Not Rated |
| Marisa | 1 | $4,933 | 12 | 4.67/5.0 |
| Sergio | 1 | $4,779 | 24 | 4.92/5.0 |
| David H | 1 | $4,163 | 89 | 4.83/5.0 |
| Polo | 1 | $3,955 | 6 | 5.00/5.0 |
| Roman | 2 | $3,285 | 8 | 4.80/5.0 |
Analyzing the strategies of top hosts, such as their property selection, pricing, and guest communication, can offer valuable lessons for optimizing your own Airbnb operations in El Naranjo.
Dive Deeper: Advanced El Naranjo STR Market Data (2026)
Ready to unlock more insights? AirROI provides access to advanced metrics and comprehensive Airbnb data for El Naranjo. Explore detailed analytics beyond this report to refine your investment strategy, optimize pricing, and maximize your vacation rental profits.
Explore Advanced MetricsEl Naranjo Short-Term Rental Market Composition (2026): Property & Room Types
Room Type Distribution
Property Type Distribution
Market Composition Insights for El Naranjo
- The El Naranjo Airbnb market composition is heavily skewed towards Private Room listings, which make up 50% of the 28 active rentals. This indicates strong guest preference for privacy and space.
- Looking at the property type distribution in El Naranjo, House properties are the most common (42.9%), reflecting the local real estate landscape.
- Houses represent a significant 42.9% portion, catering likely to families or larger groups.
- The presence of 17.9% Hotel/Boutique listings indicates integration with traditional hospitality.
- Smaller segments like outdoor/unique (combined 3.6%) offer potential for unique stay experiences.
El Naranjo Airbnb Room Capacity Analysis (2026): Bedroom Distribution
Distribution of Listings by Number of Bedrooms
Room Capacity Insights for El Naranjo
- The dominant room capacity in El Naranjo is 1 bedroom listings, making up 50% of the market. This suggests a strong demand for properties suitable for couples or solo travelers.
- Together, 1 bedroom and 2 bedrooms properties represent 60.7% of the active Airbnb listings in El Naranjo, indicating a high concentration in these sizes.
El Naranjo Vacation Rental Guest Capacity Trends (2026)
Distribution of Listings by Guest Capacity
Guest Capacity Insights for El Naranjo
- The most common guest capacity trend in El Naranjo vacation rentals is listings accommodating 4 guests (32.1%). This suggests the primary traveler segment is likely small families or groups.
- Properties designed for 4 guests and 8+ guests dominate the El Naranjo STR market, accounting for 50.0% of listings.
- 32.2% of properties accommodate 6+ guests, serving the market segment for larger families or group travel in El Naranjo.
- On average, properties in El Naranjo are equipped to host 3.9 guests.
El Naranjo Airbnb Booking Patterns (2026): Available vs. Booked Days
Available Days Distribution
Booked Days Distribution
Booking Pattern Insights for El Naranjo
- The most common availability pattern in El Naranjo falls within the 271-366 days range, representing 78.6% of listings. This suggests many properties have significant open periods on their calendars.
- Approximately 100.0% of listings show high availability (181+ days open annually), indicating potential for increased bookings or specific owner usage patterns.
- For booked days, the 1-30 days range is most frequent in El Naranjo (39.3%), reflecting common guest stay durations or potential owner blocking patterns.
El Naranjo Airbnb Minimum Stay Requirements Analysis
Distribution of Listings by Minimum Night Requirement
1 Night
25 listings
89.3% of total
2 Nights
3 listings
10.7% of total
Key Insights
- The most prevalent minimum stay requirement in El Naranjo is 1 Night, adopted by 89.3% of listings. This highlights the market's preference for shorter, flexible bookings.
- A strong majority (100.0%) of the El Naranjo Airbnb data shows acceptance of very short stays (1-2 nights), indicating a dynamic, high-turnover market.
Recommendations
- Align with the market by considering a 1 Night minimum stay, as 89.3% of El Naranjo hosts use this setting.
- Adjust minimum nights based on seasonality – potentially shorter during low season and longer during peak demand periods in El Naranjo.
El Naranjo Airbnb Cancellation Policy Trends Analysis (2026)
Flexible
6 listings
21.4% of total
Moderate
8 listings
28.6% of total
Firm
11 listings
39.3% of total
Strict
3 listings
10.7% of total
Cancellation Policy Insights for El Naranjo
- The prevailing Airbnb cancellation policy trend in El Naranjo is Firm, used by 39.3% of listings.
- There's a relatively balanced mix between guest-friendly (50.0%) and stricter (50.0%) policies, offering choices for different guest needs.
Recommendations for Hosts
- Consider adopting a Firm policy to align with the 39.3% market standard in El Naranjo.
- Using a Strict policy might deter some guests, as only 10.7% of listings use it. Evaluate if potential revenue protection outweighs possible lower booking rates.
- Regularly review your cancellation policy against competitors and market demand shifts in El Naranjo.
El Naranjo STR Booking Lead Time Analysis (2026)
Average Booking Lead Time by Month
Booking Lead Time Insights for El Naranjo
- The overall average booking lead time for vacation rentals in El Naranjo is 26 days.
- Guests book furthest in advance for stays during November (average 42 days), likely coinciding with peak travel demand or local events.
- The shortest booking windows occur for stays in October (average 17 days), indicating more last-minute travel plans during this time.
- Seasonally, Spring (32 days avg.) sees the longest lead times, while Summer (20 days avg.) has the shortest, reflecting typical travel planning cycles.
Recommendations for Hosts
- Use the overall average lead time (26 days) as a baseline for your pricing and availability strategy in El Naranjo.
- For November stays, consider implementing length-of-stay discounts or slightly higher rates for bookings made less than 42 days out to capitalize on advance planning.
- Target marketing efforts for the Spring season well in advance (at least 32 days) to capture early planners.
- Monitor your own booking lead times against these El Naranjo averages to identify opportunities for dynamic pricing adjustments.
Popular & Essential Airbnb Amenities in El Naranjo (2026)
Amenity Prevalence
Amenity Insights for El Naranjo
- Essential amenities in El Naranjo that guests expect include: Air conditioning. Lacking these (this) could significantly impact bookings.
- Popular amenities like Free parking on premises, Wifi, Hot water are common but not universal. Offering these can provide a competitive edge.
- Warning: Wifi is not universally provided but is considered essential globally. Ensure reliable Wifi is offered.
Recommendations for Hosts
- Ensure your listing includes all essential amenities for El Naranjo: Air conditioning.
- Prioritize adding missing essentials: Air conditioning.
- Consider adding popular differentiators like Free parking on premises or Wifi to increase appeal.
- Highlight unique or less common amenities you offer (e.g., hot tub, dedicated workspace, EV charger) in your listing description and photos.
- Regularly check competitor amenities in El Naranjo to stay competitive.
El Naranjo Airbnb Guest Demographics & Profile Analysis (2026)
Guest Profile Summary for El Naranjo
- The typical guest profile for Airbnb in El Naranjo consists of primarily domestic travelers (76%), often arriving from nearby Mexico City, typically belonging to the Post-2000s (Gen Z/Alpha) group (50%), primarily speaking Spanish or English.
- Domestic travelers account for 76.1% of guests.
- Key international markets include Mexico (76.1%) and United States (19.6%).
- Top languages spoken are Spanish (61%) followed by English (32.9%).
- A significant demographic segment is the Post-2000s (Gen Z/Alpha) group, representing 50% of guests.
Recommendations for Hosts
- Target domestic marketing efforts towards travelers from Mexico City and San Luis Potosí.
- Tailor amenities and listing descriptions to appeal to the dominant Post-2000s (Gen Z/Alpha) demographic (e.g., highlight fast WiFi, smart home features, local guides).
- Highlight unique local experiences or amenities relevant to the primary guest profile.
- Consider seasonal promotions aligned with peak travel times for key origin markets.
Nearby Short-Term Rental Market Comparison
How does the El Naranjo Airbnb market stack up against its neighbors? Compare key performance metrics like average monthly revenue, ADR, and occupancy rates in surrounding areas to understand the broader regional STR landscape.
| Market | Active Properties | Monthly Revenue | Daily Rate | Avg. Occupancy |
|---|---|---|---|---|
| Pinal de Amoles | 50 | $972 | $122.11 | 32% |
| El Refugio | 13 | $595 | $53.44 | 31% |
| Real de Catorce | 68 | $472 | $98.47 | 19% |
| Tamasopo | 95 | $450 | $94.98 | 19% |
| San Luis Potosí City | 762 | $399 | $47.48 | 36% |
| Ciudad Valles | 433 | $394 | $69.06 | 26% |
| Aquismón | 25 | $370 | $143.83 | 15% |
| Los Gómez | 13 | $362 | $36.44 | 35% |
| Ciudad Fernández | 18 | $352 | $97.80 | 20% |
| Mineral de Pozos | 22 | $351 | $103.72 | 14% |