San Juan del Río Airbnb Market Analysis 2026: Short Term Rental Data & Vacation Rental Statistics in Querétaro, Mexico
Is Airbnb profitable in San Juan del Río in 2026? Explore comprehensive Airbnb analytics for San Juan del Río, Querétaro, Mexico to uncover income potential. This 2026 STR market report for San Juan del Río, based on AirROI data from February 2025 to January 2026, reveals key trends in the niche market of 146 active listings.
Whether you're considering an Airbnb investment in San Juan del Río, optimizing your existing vacation rental, or exploring rental arbitrage opportunities, understanding the San Juan del Río Airbnb data is crucial. Leveraging the low regulation environment is key to maximizing your short term rental income potential. Let's dive into the specifics.
Key San Juan del Río Airbnb Performance Metrics Overview
Monthly Airbnb Revenue Variations & Income Potential in San Juan del Río (2026)
Understanding the monthly revenue variations for Airbnb listings in San Juan del Río is key to maximizing your short term rental income potential. Seasonality significantly impacts earnings. Our analysis, based on data from the past 12 months, shows that the peak revenue month for STRs in San Juan del Río is typically December, while January often presents the lowest earnings, highlighting opportunities for strategic pricing adjustments during shoulder and low seasons. Explore the typical Airbnb income in San Juan del Río across different performance tiers:
- Best-in-class properties (Top 10%) achieve $1,780+ monthly, often utilizing dynamic pricing and superior guest experiences.
- Strong performing properties (Top 25%) earn $911 or more, indicating effective management and desirable locations/amenities.
- Typical properties (Median) generate around $432 per month, representing the average market performance.
- Entry-level properties (Bottom 25%) see earnings around $183, often with potential for optimization.
Average Monthly Airbnb Earnings Trend in San Juan del Río
San Juan del Río Airbnb Occupancy Rate Trends (2026)
Maximize your bookings by understanding the San Juan del Río STR occupancy trends. Seasonal demand shifts significantly influence how often properties are booked. Typically, Februarysees the highest demand (peak season occupancy), while January experiences the lowest (low season). Effective strategies, like adjusting minimum stays or offering promotions, can boost occupancy during slower periods. Here's how different property tiers perform in San Juan del Río:
- Best-in-class properties (Top 10%) achieve 70%+ occupancy, indicating high desirability and potentially optimized availability.
- Strong performing properties (Top 25%) maintain 49% or higher occupancy, suggesting good market fit and guest satisfaction.
- Typical properties (Median) have an occupancy rate around 27%.
- Entry-level properties (Bottom 25%) average 12% occupancy, potentially facing higher vacancy.
Average Monthly Occupancy Rate Trend in San Juan del Río
Average Daily Rate (ADR) Airbnb Trends in San Juan del Río (2026)
Effective short term rental pricing strategy in San Juan del Río involves understanding monthly ADR fluctuations. The Average Daily Rate (ADR) for Airbnb in San Juan del Río typically peaks in September and dips lowest during February. Leveraging Airbnb dynamic pricing tools or strategies based on this seasonality can significantly boost revenue. Here's a look at the typical nightly rates achieved:
- Best-in-class properties (Top 10%) command rates of $187+ per night, often due to premium features or locations.
- Strong performing properties (Top 25%) achieve nightly rates of $77 or more.
- Typical properties (Median) charge around $48 per night.
- Entry-level properties (Bottom 25%) earn around $34 per night.
Average Daily Rate (ADR) Trend by Month in San Juan del Río
Get Live San Juan del Río Market Intelligence 👇

Explore Real-time Analytics
Airbnb Seasonality Analysis & Trends in San Juan del Río (2026)
Peak Season (December, August, April)
- Revenue averages $952 per month
- Occupancy rates average 34.3%
- Daily rates average $85
Shoulder Season
- Revenue averages $785 per month
- Occupancy maintains around 32.8%
- Daily rates hold near $85
Low Season (January, February, September)
- Revenue drops to average $649 per month
- Occupancy decreases to average 30.7%
- Daily rates adjust to average $85
Seasonality Insights for San Juan del Río
- The Airbnb seasonality in San Juan del Río shows moderate seasonality with distinct peak and low periods. While the sections above show seasonal averages, it's also insightful to look at the extremes:
- During the high season, the absolute peak month showcases San Juan del Río's highest earning potential, with monthly revenues capable of climbing to $1,055, occupancy reaching a high of 37.9%, and ADRs peaking at $87.
- Conversely, the slowest single month of the year, typically falling within the low season, marks the market's lowest point. In this month, revenue might dip to $579, occupancy could drop to 23.8%, and ADRs may adjust down to $81.
- Understanding both the seasonal averages and these monthly peaks and troughs in revenue, occupancy, and ADR is crucial for maximizing your Airbnb profit potential in San Juan del Río.
Seasonal Strategies for Maximizing Profit
- Peak Season: Maximize revenue through premium pricing and potentially longer minimum stays. Ensure high availability.
- Low Season: Offer competitive pricing, special promotions (e.g., extended stay discounts), and flexible cancellation policies. Target off-season travelers like remote workers or budget-conscious guests.
- Shoulder Seasons: Implement dynamic pricing that balances peak and low rates. Target weekend travelers or specific events. Offer slightly more flexible terms than peak season.
- Regularly analyze your own performance against these San Juan del Río seasonality benchmarks and adjust your pricing and availability strategy accordingly.
Best Areas for Airbnb Investment in San Juan del Río (2026)
Exploring the top neighborhoods for short-term rentals in San Juan del Río? This section highlights key areas, outlining why they are attractive for hosts and guests, along with notable local attractions. Consider these locations based on your target guest profile and investment strategy.
| Neighborhood / Area | Why Host Here? (Target Guests & Appeal) | Key Attractions & Landmarks |
|---|---|---|
| Centro Histórico | The historic center of San Juan del Río, rich in colonial architecture and cultural significance. Ideal for travelers interested in history and local culture. | Parroquia de San Juan Bautista, Museo Histórico”,“Plaza de la Constitución, Teatro de la Ciudad, Arcos del Río San Juan |
| San Fernando | A residential area that combines modern living with proximity to the city's key amenities. Popular with families and long-term visitors. | Parque San Fernando, Centro Comercial San Felipe, Local markets, Restaurants and cafes |
| La Virgen | A lively neighborhood known for its vibrant community and local events. Great for hosting guests who want an authentic experience of San Juan del Río. | Calle de la Virgen, Local eateries, Cultural festivals, Parks and gardens |
| Balcón de Juriquilla | An upscale area near the outskirts known for its luxurious homes and serene environment. Suitable for higher-end tourists looking for comfort. | Juriquilla's lakes, Golf courses, Shopping centers, Nature trails |
| Las Águilas | A developing neighborhood with growing amenities, attracts young professionals and those looking for affordable stays. | Local grocery stores, Nearby parks, Educational institutions |
| San Pedro | Close to nature and outdoor activities, this region suits tourists interested in adventure and ecotourism. | Nature reserves, Hiking trails, Camping areas, Rivers |
| El Cerrito | Offers scenic views and a peaceful environment, perfect for those looking to escape the city's hustle and bustle. | Cerrito de la Paz, Outdoor sporting events, Scenic lookout points |
| Zaragoza | Known for its convenient access to transportation and commercial areas, making it ideal for business travelers and short stays. | Bus terminals, Commercial centers, Restaurants and shops |
Understanding Airbnb License Requirements & STR Laws in San Juan del Río (2026)
While San Juan del Río, Querétaro, Mexico currently shows low STR regulations, specific Airbnb license requirements might still exist or change. Always verify the latest short term rental regulations and Airbnb license requirements directly with local government authorities for San Juan del Río to ensure full compliance before hosting.
(Source: AirROI data, 2026, finding no licensed listings among those analyzed)
Top Performing Airbnb Properties in San Juan del Río (2026)
Benchmark your potential! Explore examples of top-performing Airbnb properties in San Juan del Ríobased on Trailing Twelve Month (TTM) revenue. Analyze their characteristics, revenue, occupancy rate, and ADR to understand what drives success in this market.
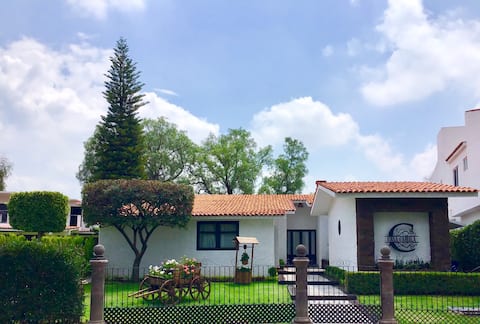
Casa Camila, Country Residence
Entire Place • 9 bedrooms
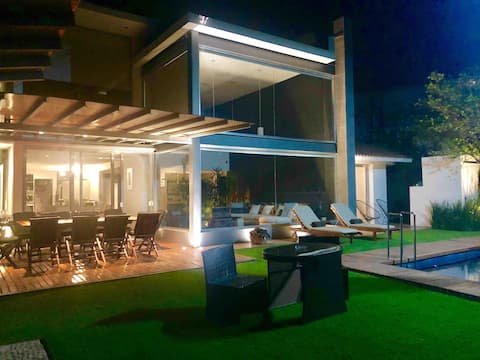
Lake House, Beautiful and modern residence
Entire Place • 4 bedrooms

Cozy house in San Gil with a lake view
Entire Place • 4 bedrooms
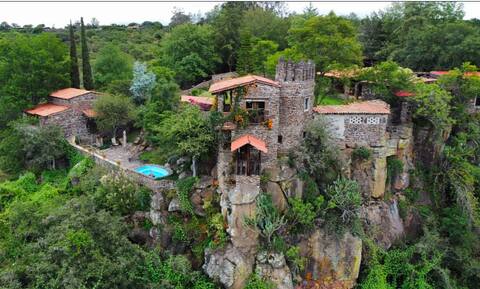
Rancho el Barranco, the ideal rest
Private Room • 9 bedrooms

El Parián Farm
Entire Place • 9 bedrooms

House in San Juan del Rio with a swimming pool and Temazcal.
Entire Place • 5 bedrooms
Note: Performance varies based on location, size, amenities, seasonality, and management quality. Data reflects the past 12 months.
Top Performing Airbnb Hosts in San Juan del Río (2026)
Learn from the best! This table showcases top-performing Airbnb hosts in San Juan del Río based on the number of properties managed and estimated total revenue over the past year. Analyze their scale and performance metrics.
| Host Name | Properties | Grossing Revenue | Stay Reviews | Avg Rating |
|---|---|---|---|---|
| Vane | 2 | $134,673 | 262 | 4.80/5.0 |
| Mario | 7 | $79,814 | 867 | 4.90/5.0 |
| Monica | 1 | $46,621 | 116 | 4.84/5.0 |
| Monica | 1 | $45,988 | 19 | 5.00/5.0 |
| Maria Andrea | 1 | $37,301 | 38 | 4.89/5.0 |
| Miriam Merit | 1 | $31,915 | 32 | 4.69/5.0 |
| Andres | 1 | $30,054 | 74 | 4.50/5.0 |
| Rosalía Y Eduardo | 1 | $24,847 | 28 | 4.61/5.0 |
| Andrea | 1 | $20,903 | 67 | 4.91/5.0 |
| Medea | 1 | $19,971 | 15 | 4.80/5.0 |
Analyzing the strategies of top hosts, such as their property selection, pricing, and guest communication, can offer valuable lessons for optimizing your own Airbnb operations in San Juan del Río.
Dive Deeper: Advanced San Juan del Río STR Market Data (2026)
Ready to unlock more insights? AirROI provides access to advanced metrics and comprehensive Airbnb data for San Juan del Río. Explore detailed analytics beyond this report to refine your investment strategy, optimize pricing, and maximize your vacation rental profits.
Explore Advanced MetricsSan Juan del Río Short-Term Rental Market Composition (2026): Property & Room Types
Room Type Distribution
Property Type Distribution
Market Composition Insights for San Juan del Río
- The San Juan del Río Airbnb market composition is heavily skewed towards Entire Home/Apt listings, which make up 82.9% of the 146 active rentals. This indicates strong guest preference for privacy and space.
- Looking at the property type distribution in San Juan del Río, House properties are the most common (75.3%), reflecting the local real estate landscape.
- Houses represent a significant 75.3% portion, catering likely to families or larger groups.
- The presence of 5.5% Hotel/Boutique listings indicates integration with traditional hospitality.
- Smaller segments like outdoor/unique, others (combined 3.4%) offer potential for unique stay experiences.
San Juan del Río Airbnb Room Capacity Analysis (2026): Bedroom Distribution
Distribution of Listings by Number of Bedrooms
Room Capacity Insights for San Juan del Río
- The dominant room capacity in San Juan del Río is 3 bedrooms listings, making up 35.6% of the market. This suggests a strong demand for properties suitable for families or small groups.
- Together, 3 bedrooms and 2 bedrooms properties represent 59.6% of the active Airbnb listings in San Juan del Río, indicating a high concentration in these sizes.
- A significant 50.0% of listings offer 3+ bedrooms, catering to larger groups and families seeking more space in San Juan del Río.
San Juan del Río Vacation Rental Guest Capacity Trends (2026)
Distribution of Listings by Guest Capacity
Guest Capacity Insights for San Juan del Río
- The most common guest capacity trend in San Juan del Río vacation rentals is listings accommodating 8+ guests (25.3%). This suggests the primary traveler segment is likely larger groups.
- Properties designed for 8+ guests and 6 guests dominate the San Juan del Río STR market, accounting for 43.8% of listings.
- 50.6% of properties accommodate 6+ guests, serving the market segment for larger families or group travel in San Juan del Río.
- On average, properties in San Juan del Río are equipped to host 5.0 guests.
San Juan del Río Airbnb Booking Patterns (2026): Available vs. Booked Days
Available Days Distribution
Booked Days Distribution
Booking Pattern Insights for San Juan del Río
- The most common availability pattern in San Juan del Río falls within the 271-366 days range, representing 61% of listings. This suggests many properties have significant open periods on their calendars.
- Approximately 89.1% of listings show high availability (181+ days open annually), indicating potential for increased bookings or specific owner usage patterns.
- For booked days, the 31-90 days range is most frequent in San Juan del Río (37.7%), reflecting common guest stay durations or potential owner blocking patterns.
- A notable 12.3% of properties secure long booking periods (181+ days booked per year), highlighting successful long-term rental strategies or significant owner usage.
San Juan del Río Airbnb Minimum Stay Requirements Analysis
Distribution of Listings by Minimum Night Requirement
1 Night
76 listings
52.1% of total
2 Nights
46 listings
31.5% of total
3 Nights
2 listings
1.4% of total
4-6 Nights
1 listings
0.7% of total
7-29 Nights
1 listings
0.7% of total
30+ Nights
20 listings
13.7% of total
Key Insights
- The most prevalent minimum stay requirement in San Juan del Río is 1 Night, adopted by 52.1% of listings. This highlights the market's preference for shorter, flexible bookings.
- A strong majority (83.6%) of the San Juan del Río Airbnb data shows acceptance of very short stays (1-2 nights), indicating a dynamic, high-turnover market.
- A significant segment (13.7%) caters to monthly stays (30+ nights) in San Juan del Río, pointing to opportunities in the extended-stay market.
Recommendations
- Align with the market by considering a 1 Night minimum stay, as 52.1% of San Juan del Río hosts use this setting.
- Explore offering discounts for stays of 30+ nights to attract the 13.7% of the market seeking extended stays.
- Adjust minimum nights based on seasonality – potentially shorter during low season and longer during peak demand periods in San Juan del Río.
San Juan del Río Airbnb Cancellation Policy Trends Analysis (2026)
Limited
2 listings
1.4% of total
Flexible
58 listings
39.7% of total
Moderate
56 listings
38.4% of total
Firm
22 listings
15.1% of total
Strict
8 listings
5.5% of total
Cancellation Policy Insights for San Juan del Río
- The prevailing Airbnb cancellation policy trend in San Juan del Río is Flexible, used by 39.7% of listings.
- The market strongly favors guest-friendly terms, with 78.1% of listings offering Flexible or Moderate policies. This suggests guests in San Juan del Río may expect booking flexibility.
- Strict cancellation policies are quite rare (5.5%), potentially making listings with this policy less competitive unless justified by high demand or property type.
Recommendations for Hosts
- Consider adopting a Flexible policy to align with the 39.7% market standard in San Juan del Río.
- Using a Strict policy might deter some guests, as only 5.5% of listings use it. Evaluate if potential revenue protection outweighs possible lower booking rates.
- Regularly review your cancellation policy against competitors and market demand shifts in San Juan del Río.
San Juan del Río STR Booking Lead Time Analysis (2026)
Average Booking Lead Time by Month
Booking Lead Time Insights for San Juan del Río
- The overall average booking lead time for vacation rentals in San Juan del Río is 15 days.
- Guests book furthest in advance for stays during July (average 23 days), likely coinciding with peak travel demand or local events.
- The shortest booking windows occur for stays in February (average 9 days), indicating more last-minute travel plans during this time.
- Seasonally, Summer (16 days avg.) sees the longest lead times, while Winter (14 days avg.) has the shortest, reflecting typical travel planning cycles.
Recommendations for Hosts
- Use the overall average lead time (15 days) as a baseline for your pricing and availability strategy in San Juan del Río.
- Target marketing efforts for the Summer season well in advance (at least 16 days) to capture early planners.
- Monitor your own booking lead times against these San Juan del Río averages to identify opportunities for dynamic pricing adjustments.
Popular & Essential Airbnb Amenities in San Juan del Río (2026)
Amenity Prevalence
Amenity Insights for San Juan del Río
- Essential amenities in San Juan del Río that guests expect include: Wifi. Lacking these (this) could significantly impact bookings.
- Popular amenities like Kitchen, TV, Hot water are common but not universal. Offering these can provide a competitive edge.
Recommendations for Hosts
- Ensure your listing includes all essential amenities for San Juan del Río: Wifi.
- Prioritize adding missing essentials: Wifi.
- Consider adding popular differentiators like Kitchen or TV to increase appeal.
- Highlight unique or less common amenities you offer (e.g., hot tub, dedicated workspace, EV charger) in your listing description and photos.
- Regularly check competitor amenities in San Juan del Río to stay competitive.
San Juan del Río Airbnb Guest Demographics & Profile Analysis (2026)
Guest Profile Summary for San Juan del Río
- The typical guest profile for Airbnb in San Juan del Río consists of primarily domestic travelers (92%), often arriving from nearby Mexico City, typically belonging to the Post-2000s (Gen Z/Alpha) group (50%), primarily speaking Spanish or English.
- Domestic travelers account for 91.9% of guests.
- Key international markets include Mexico (91.9%) and United States (4.9%).
- Top languages spoken are Spanish (58.3%) followed by English (34%).
- A significant demographic segment is the Post-2000s (Gen Z/Alpha) group, representing 50% of guests.
Recommendations for Hosts
- Target domestic marketing efforts towards travelers from Mexico City and Santiago de Querétaro.
- Tailor amenities and listing descriptions to appeal to the dominant Post-2000s (Gen Z/Alpha) demographic (e.g., highlight fast WiFi, smart home features, local guides).
- Highlight unique local experiences or amenities relevant to the primary guest profile.
- Consider seasonal promotions aligned with peak travel times for key origin markets.
Nearby Short-Term Rental Market Comparison
How does the San Juan del Río Airbnb market stack up against its neighbors? Compare key performance metrics like average monthly revenue, ADR, and occupancy rates in surrounding areas to understand the broader regional STR landscape.
| Market | Active Properties | Monthly Revenue | Daily Rate | Avg. Occupancy |
|---|---|---|---|---|
| El Santuario | 44 | $2,583 | $420.27 | 25% |
| Cerro Gordo | 38 | $2,183 | $438.64 | 21% |
| Tepeji del Rio de Ocampo | 11 | $2,125 | $315.80 | 27% |
| Avandaro | 212 | $1,892 | $411.24 | 24% |
| La Tortuga | 71 | $1,658 | $239.12 | 28% |
| Alcocer | 11 | $1,642 | $271.32 | 21% |
| San Miguel de Allende | 2,169 | $1,470 | $194.10 | 32% |
| Ejido San Gaspar | 43 | $1,386 | $267.18 | 20% |
| Cuauhtémoc | 13 | $1,344 | $93.02 | 54% |
| Juárez | 44 | $1,317 | $98.72 | 54% |