San Joaquín Airbnb Market Analysis 2026: Short Term Rental Data & Vacation Rental Statistics in Querétaro, Mexico
Is Airbnb profitable in San Joaquín in 2026? Explore comprehensive Airbnb analytics for San Joaquín, Querétaro, Mexico to uncover income potential. This 2026 STR market report for San Joaquín, based on AirROI data from February 2025 to January 2026, reveals key trends in the niche market of 41 active listings.
Whether you're considering an Airbnb investment in San Joaquín, optimizing your existing vacation rental, or exploring rental arbitrage opportunities, understanding the San Joaquín Airbnb data is crucial. Leveraging the low regulation environment is key to maximizing your short term rental income potential. Let's dive into the specifics.
Key San Joaquín Airbnb Performance Metrics Overview
Monthly Airbnb Revenue Variations & Income Potential in San Joaquín (2026)
Understanding the monthly revenue variations for Airbnb listings in San Joaquín is key to maximizing your short term rental income potential. Seasonality significantly impacts earnings. Our analysis, based on data from the past 12 months, shows that the peak revenue month for STRs in San Joaquín is typically December, while June often presents the lowest earnings, highlighting opportunities for strategic pricing adjustments during shoulder and low seasons. Explore the typical Airbnb income in San Joaquín across different performance tiers:
- Best-in-class properties (Top 10%) achieve $965+ monthly, often utilizing dynamic pricing and superior guest experiences.
- Strong performing properties (Top 25%) earn $586 or more, indicating effective management and desirable locations/amenities.
- Typical properties (Median) generate around $299 per month, representing the average market performance.
- Entry-level properties (Bottom 25%) see earnings around $137, often with potential for optimization.
Average Monthly Airbnb Earnings Trend in San Joaquín
San Joaquín Airbnb Occupancy Rate Trends (2026)
Maximize your bookings by understanding the San Joaquín STR occupancy trends. Seasonal demand shifts significantly influence how often properties are booked. Typically, Octobersees the highest demand (peak season occupancy), while June experiences the lowest (low season). Effective strategies, like adjusting minimum stays or offering promotions, can boost occupancy during slower periods. Here's how different property tiers perform in San Joaquín:
- Best-in-class properties (Top 10%) achieve 35%+ occupancy, indicating high desirability and potentially optimized availability.
- Strong performing properties (Top 25%) maintain 21% or higher occupancy, suggesting good market fit and guest satisfaction.
- Typical properties (Median) have an occupancy rate around 14%.
- Entry-level properties (Bottom 25%) average 7% occupancy, potentially facing higher vacancy.
Average Monthly Occupancy Rate Trend in San Joaquín
Average Daily Rate (ADR) Airbnb Trends in San Joaquín (2026)
Effective short term rental pricing strategy in San Joaquín involves understanding monthly ADR fluctuations. The Average Daily Rate (ADR) for Airbnb in San Joaquín typically peaks in January and dips lowest during February. Leveraging Airbnb dynamic pricing tools or strategies based on this seasonality can significantly boost revenue. Here's a look at the typical nightly rates achieved:
- Best-in-class properties (Top 10%) command rates of $130+ per night, often due to premium features or locations.
- Strong performing properties (Top 25%) achieve nightly rates of $102 or more.
- Typical properties (Median) charge around $73 per night.
- Entry-level properties (Bottom 25%) earn around $57 per night.
Average Daily Rate (ADR) Trend by Month in San Joaquín
Get Live San Joaquín Market Intelligence 👇

Explore Real-time Analytics
Airbnb Seasonality Analysis & Trends in San Joaquín (2026)
Peak Season (December, October, August)
- Revenue averages $658 per month
- Occupancy rates average 23.3%
- Daily rates average $86
Shoulder Season
- Revenue averages $383 per month
- Occupancy maintains around 16.8%
- Daily rates hold near $79
Low Season (January, May, June)
- Revenue drops to average $253 per month
- Occupancy decreases to average 9.7%
- Daily rates adjust to average $83
Seasonality Insights for San Joaquín
- The Airbnb seasonality in San Joaquín shows highly seasonal trends requiring careful strategy. While the sections above show seasonal averages, it's also insightful to look at the extremes:
- During the high season, the absolute peak month showcases San Joaquín's highest earning potential, with monthly revenues capable of climbing to $713, occupancy reaching a high of 27.8%, and ADRs peaking at $90.
- Conversely, the slowest single month of the year, typically falling within the low season, marks the market's lowest point. In this month, revenue might dip to $231, occupancy could drop to 8.7%, and ADRs may adjust down to $72.
- Understanding both the seasonal averages and these monthly peaks and troughs in revenue, occupancy, and ADR is crucial for maximizing your Airbnb profit potential in San Joaquín.
Seasonal Strategies for Maximizing Profit
- Peak Season: Maximize revenue through premium pricing and potentially longer minimum stays. Ensure high availability.
- Low Season: Offer competitive pricing, special promotions (e.g., extended stay discounts), and flexible cancellation policies. Target off-season travelers like remote workers or budget-conscious guests.
- Shoulder Seasons: Implement dynamic pricing that balances peak and low rates. Target weekend travelers or specific events. Offer slightly more flexible terms than peak season.
- Regularly analyze your own performance against these San Joaquín seasonality benchmarks and adjust your pricing and availability strategy accordingly.
Best Areas for Airbnb Investment in San Joaquín (2026)
Exploring the top neighborhoods for short-term rentals in San Joaquín? This section highlights key areas, outlining why they are attractive for hosts and guests, along with notable local attractions. Consider these locations based on your target guest profile and investment strategy.
| Neighborhood / Area | Why Host Here? (Target Guests & Appeal) | Key Attractions & Landmarks |
|---|---|---|
| Centro Histórico | The historical downtown of Querétaro, known for its colonial architecture and rich history. Attracts tourists interested in culture and history, making it a great location for Airbnb hosting. | Querétaro Cathedral, Plaza de Armas, Aqueduct of Querétaro, Museo de Arte, Parque de la Familia |
| Juriquilla | An upscale residential area with a blend of modern living and nature. Popular with families and long-term visitors seeking a more peaceful environment, yet close to amenities. | Juriquilla Golf Club, Antea Lifestyle Center, Laguna de Ojo de Agua, Universidad Anáhuac Querétaro, Cerro de las Campanas |
| El Marqués | A growing area close to Querétaro city with new developments and a mix of urban and suburban living. Attractive to business travelers and those visiting local industry. | Teatro de la Ciudad, Plaza El Marqués, Paseo Arcos, Parque Industrial El Marqués, Centro Interactivo Pepper |
| Querétaro Centro Sur | A vibrant area known for its shopping, dining, and entertainment options. This area is ideal for tourists looking for convenience and accessibility in Querétaro. | Plaza Boulevares, Cinemex Querétaro, Parque Alameda, Centro Comercial Querétaro, Tigres de Querétaro stadium |
| San Sebastián | A traditional neighborhood that offers a local experience with markets and street food. Great for cultural immersion and attracting adventurous tourists. | Mercado de San Sebastián, Plaza de La Constitución, Calle de los Abanicos, Templo de San Sebastián, Barrio de La Cruz |
| Los Arcos | A neighborhood famous for its monumental arch and vibrant nightlife. Great for younger travelers and those looking for an active social life during their stay. | Arcos del Querétaro, Calle 5 de Febrero, Plaza de Toros, restaurantes y bares, Plaza de La Libertad |
| Alameda | A historical park area surrounded by restaurants and cultural spaces. Ideal for tourists looking to relax and enjoy local cuisine and events. | Alameda Miguel Hidalgo, Centro Cultural Pedro Medina, crafter's market, Teatro de la Ciudad, Palacio de Gobierno |
| Balvanera | A residential area popular with expats and professionals due to its modern amenities and community feel. Attractive for long-term stays. | Balvanera Polo & Country Club, Parque Balvanera, Club de Golf, local restaurants, shopping centers |
Understanding Airbnb License Requirements & STR Laws in San Joaquín (2026)
While San Joaquín, Querétaro, Mexico currently shows low STR regulations, specific Airbnb license requirements might still exist or change. Always verify the latest short term rental regulations and Airbnb license requirements directly with local government authorities for San Joaquín to ensure full compliance before hosting.
(Source: AirROI data, 2026, finding no licensed listings among those analyzed)
Top Performing Airbnb Properties in San Joaquín (2026)
Benchmark your potential! Explore examples of top-performing Airbnb properties in San Joaquínbased on Trailing Twelve Month (TTM) revenue. Analyze their characteristics, revenue, occupancy rate, and ADR to understand what drives success in this market.
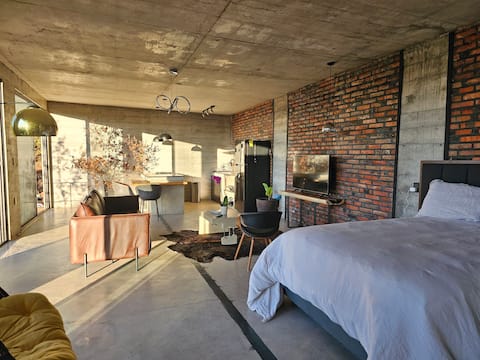
loft casa toluquilla
Entire Place • 1 bedroom
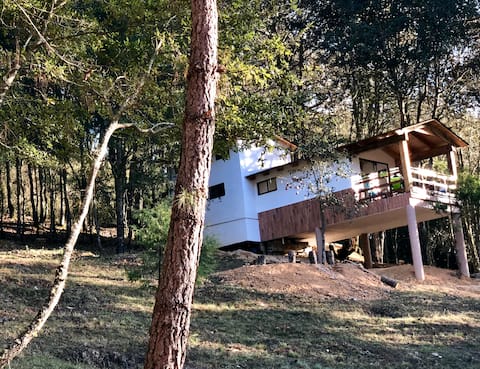
Bosques de San Joaquín (Cabin I)
Entire Place • 2 bedrooms
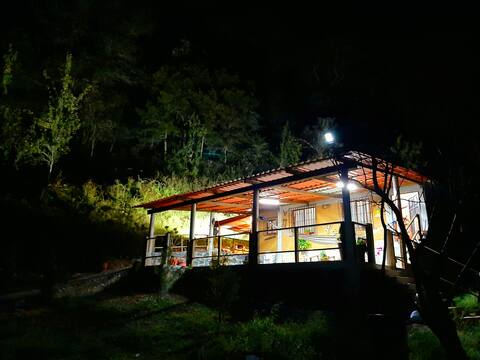
El Rincón de Ranas
Entire Place • 3 bedrooms

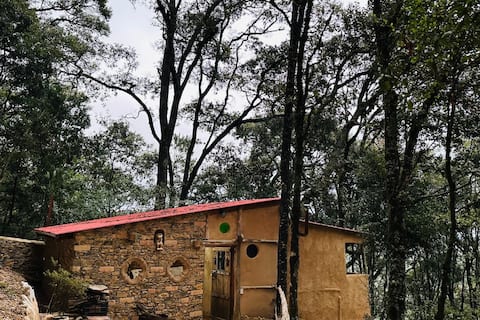
Bosques de San Joaquín (Cabin II)
Entire Place • 2 bedrooms
Cabaña la Rana/El Bosque de las Ranas
Entire Place • 1 bedroom

Country House with WiFi, Parking and Grill
Entire Place • 3 bedrooms
Note: Performance varies based on location, size, amenities, seasonality, and management quality. Data reflects the past 12 months.
Top Performing Airbnb Hosts in San Joaquín (2026)
Learn from the best! This table showcases top-performing Airbnb hosts in San Joaquín based on the number of properties managed and estimated total revenue over the past year. Analyze their scale and performance metrics.
| Host Name | Properties | Grossing Revenue | Stay Reviews | Avg Rating |
|---|---|---|---|---|
| Antonio Salvador | 8 | $35,373 | 856 | 4.91/5.0 |
| Sandra | 2 | $20,153 | 327 | 4.87/5.0 |
| Victor Manuel | 2 | $17,300 | 311 | 4.80/5.0 |
| Alex Ortiz | 1 | $15,222 | 82 | 4.99/5.0 |
| Pedro | 3 | $12,096 | 282 | 4.86/5.0 |
| Karina | 2 | $8,042 | 47 | 4.99/5.0 |
| Ruth | 7 | $7,836 | 193 | 4.73/5.0 |
| Ma Magdalena | 3 | $6,016 | 59 | 4.45/5.0 |
| Dulce Maria | 2 | $5,857 | 10 | 5.00/5.0 |
| Nancy | 1 | $4,882 | 31 | 4.94/5.0 |
Analyzing the strategies of top hosts, such as their property selection, pricing, and guest communication, can offer valuable lessons for optimizing your own Airbnb operations in San Joaquín.
Dive Deeper: Advanced San Joaquín STR Market Data (2026)
Ready to unlock more insights? AirROI provides access to advanced metrics and comprehensive Airbnb data for San Joaquín. Explore detailed analytics beyond this report to refine your investment strategy, optimize pricing, and maximize your vacation rental profits.
Explore Advanced MetricsSan Joaquín Short-Term Rental Market Composition (2026): Property & Room Types
Room Type Distribution
Property Type Distribution
Market Composition Insights for San Joaquín
- The San Joaquín Airbnb market composition is heavily skewed towards Entire Home/Apt listings, which make up 61% of the 41 active rentals. This indicates strong guest preference for privacy and space.
- However, a notable 39% share for Private Rooms suggests opportunities for budget-conscious travelers or hosts renting out spare rooms.
- Looking at the property type distribution in San Joaquín, Outdoor/Unique properties are the most common (46.3%), reflecting the local real estate landscape.
- Houses represent a significant 17.1% portion, catering likely to families or larger groups.
- The presence of 14.6% Hotel/Boutique listings indicates integration with traditional hospitality.
- Smaller segments like others, unique stays (combined 7.3%) offer potential for unique stay experiences.
San Joaquín Airbnb Room Capacity Analysis (2026): Bedroom Distribution
Distribution of Listings by Number of Bedrooms
Room Capacity Insights for San Joaquín
- The dominant room capacity in San Joaquín is 1 bedroom listings, making up 46.3% of the market. This suggests a strong demand for properties suitable for couples or solo travelers.
- Together, 1 bedroom and 2 bedrooms properties represent 68.3% of the active Airbnb listings in San Joaquín, indicating a high concentration in these sizes.
San Joaquín Vacation Rental Guest Capacity Trends (2026)
Distribution of Listings by Guest Capacity
Guest Capacity Insights for San Joaquín
- The most common guest capacity trend in San Joaquín vacation rentals is listings accommodating 2 guests (34.1%). This suggests the primary traveler segment is likely couples or solo travelers.
- Properties designed for 2 guests and 4 guests dominate the San Joaquín STR market, accounting for 53.6% of listings.
- 26.8% of properties accommodate 6+ guests, serving the market segment for larger families or group travel in San Joaquín.
- On average, properties in San Joaquín are equipped to host 3.5 guests.
San Joaquín Airbnb Booking Patterns (2026): Available vs. Booked Days
Available Days Distribution
Booked Days Distribution
Booking Pattern Insights for San Joaquín
- The most common availability pattern in San Joaquín falls within the 271-366 days range, representing 92.7% of listings. This suggests many properties have significant open periods on their calendars.
- Approximately 100.0% of listings show high availability (181+ days open annually), indicating potential for increased bookings or specific owner usage patterns.
- For booked days, the 31-90 days range is most frequent in San Joaquín (43.9%), reflecting common guest stay durations or potential owner blocking patterns.
San Joaquín Airbnb Minimum Stay Requirements Analysis
Distribution of Listings by Minimum Night Requirement
1 Night
40 listings
97.6% of total
30+ Nights
1 listings
2.4% of total
Key Insights
- The most prevalent minimum stay requirement in San Joaquín is 1 Night, adopted by 97.6% of listings. This highlights the market's preference for shorter, flexible bookings.
- A strong majority (97.6%) of the San Joaquín Airbnb data shows acceptance of very short stays (1-2 nights), indicating a dynamic, high-turnover market.
- Dedicated monthly rentals (30+ nights) represent a small niche (2.4%), possibly an untapped area for hosts.
Recommendations
- Align with the market by considering a 1 Night minimum stay, as 97.6% of San Joaquín hosts use this setting.
- Adjust minimum nights based on seasonality – potentially shorter during low season and longer during peak demand periods in San Joaquín.
San Joaquín Airbnb Cancellation Policy Trends Analysis (2026)
Flexible
8 listings
19.5% of total
Moderate
20 listings
48.8% of total
Firm
7 listings
17.1% of total
Strict
6 listings
14.6% of total
Cancellation Policy Insights for San Joaquín
- The prevailing Airbnb cancellation policy trend in San Joaquín is Moderate, used by 48.8% of listings.
- There's a relatively balanced mix between guest-friendly (68.3%) and stricter (31.7%) policies, offering choices for different guest needs.
Recommendations for Hosts
- Consider adopting a Moderate policy to align with the 48.8% market standard in San Joaquín.
- Using a Strict policy might deter some guests, as only 14.6% of listings use it. Evaluate if potential revenue protection outweighs possible lower booking rates.
- Regularly review your cancellation policy against competitors and market demand shifts in San Joaquín.
San Joaquín STR Booking Lead Time Analysis (2026)
Average Booking Lead Time by Month
Booking Lead Time Insights for San Joaquín
- The overall average booking lead time for vacation rentals in San Joaquín is 20 days.
- Guests book furthest in advance for stays during April (average 36 days), likely coinciding with peak travel demand or local events.
- The shortest booking windows occur for stays in June (average 5 days), indicating more last-minute travel plans during this time.
- Seasonally, Spring (28 days avg.) sees the longest lead times, while Summer (12 days avg.) has the shortest, reflecting typical travel planning cycles.
Recommendations for Hosts
- Use the overall average lead time (20 days) as a baseline for your pricing and availability strategy in San Joaquín.
- For April stays, consider implementing length-of-stay discounts or slightly higher rates for bookings made less than 36 days out to capitalize on advance planning.
- During June, focus on last-minute booking availability and promotions, as guests book with very short notice (5 days avg.).
- Target marketing efforts for the Spring season well in advance (at least 28 days) to capture early planners.
- Monitor your own booking lead times against these San Joaquín averages to identify opportunities for dynamic pricing adjustments.
Popular & Essential Airbnb Amenities in San Joaquín (2026)
Amenity Prevalence
Amenity Insights for San Joaquín
- Popular amenities like Hot water, Shampoo, Free parking on premises are common but not universal. Offering these can provide a competitive edge.
- Warning: Wifi is not universally provided but is considered essential globally. Ensure reliable Wifi is offered.
Recommendations for Hosts
- Consider adding popular differentiators like Hot water or Shampoo to increase appeal.
- Highlight unique or less common amenities you offer (e.g., hot tub, dedicated workspace, EV charger) in your listing description and photos.
- Regularly check competitor amenities in San Joaquín to stay competitive.
San Joaquín Airbnb Guest Demographics & Profile Analysis (2026)
Guest Profile Summary for San Joaquín
- The typical guest profile for Airbnb in San Joaquín consists of primarily domestic travelers (92%), often arriving from nearby Santiago de Querétaro, typically belonging to the Post-2000s (Gen Z/Alpha) group (50%), primarily speaking Spanish or English.
- Domestic travelers account for 91.9% of guests.
- Key international markets include Mexico (91.9%) and United States (5.6%).
- Top languages spoken are Spanish (49.5%) followed by English (38%).
- A significant demographic segment is the Post-2000s (Gen Z/Alpha) group, representing 50% of guests.
Recommendations for Hosts
- Target domestic marketing efforts towards travelers from Santiago de Querétaro and Mexico City.
- Tailor amenities and listing descriptions to appeal to the dominant Post-2000s (Gen Z/Alpha) demographic (e.g., highlight fast WiFi, smart home features, local guides).
- Highlight unique local experiences or amenities relevant to the primary guest profile.
- Consider seasonal promotions aligned with peak travel times for key origin markets.
Nearby Short-Term Rental Market Comparison
How does the San Joaquín Airbnb market stack up against its neighbors? Compare key performance metrics like average monthly revenue, ADR, and occupancy rates in surrounding areas to understand the broader regional STR landscape.
| Market | Active Properties | Monthly Revenue | Daily Rate | Avg. Occupancy |
|---|---|---|---|---|
| El Santuario | 44 | $2,583 | $420.27 | 25% |
| Cerro Gordo | 38 | $2,183 | $438.64 | 21% |
| Tepeji del Rio de Ocampo | 11 | $2,125 | $315.80 | 27% |
| Avandaro | 212 | $1,892 | $411.24 | 24% |
| La Tortuga | 71 | $1,658 | $239.12 | 28% |
| Alcocer | 11 | $1,642 | $271.32 | 21% |
| San Miguel de Allende | 2,169 | $1,470 | $194.10 | 32% |
| Ejido San Gaspar | 43 | $1,386 | $267.18 | 20% |
| Cuauhtémoc | 13 | $1,344 | $93.02 | 54% |
| Juárez | 44 | $1,317 | $98.72 | 54% |