Ezequiel Montes Airbnb Market Analysis 2026: Short Term Rental Data & Vacation Rental Statistics in Querétaro, Mexico
Is Airbnb profitable in Ezequiel Montes in 2026? Explore comprehensive Airbnb analytics for Ezequiel Montes, Querétaro, Mexico to uncover income potential. This 2026 STR market report for Ezequiel Montes, based on AirROI data from February 2025 to January 2026, reveals key trends in the niche market of 33 active listings.
Whether you're considering an Airbnb investment in Ezequiel Montes, optimizing your existing vacation rental, or exploring rental arbitrage opportunities, understanding the Ezequiel Montes Airbnb data is crucial. Leveraging the low regulation environment is key to maximizing your short term rental income potential. Let's dive into the specifics.
Key Ezequiel Montes Airbnb Performance Metrics Overview
Monthly Airbnb Revenue Variations & Income Potential in Ezequiel Montes (2026)
Understanding the monthly revenue variations for Airbnb listings in Ezequiel Montes is key to maximizing your short term rental income potential. Seasonality significantly impacts earnings. Our analysis, based on data from the past 12 months, shows that the peak revenue month for STRs in Ezequiel Montes is typically December, while February often presents the lowest earnings, highlighting opportunities for strategic pricing adjustments during shoulder and low seasons. Explore the typical Airbnb income in Ezequiel Montes across different performance tiers:
- Best-in-class properties (Top 10%) achieve $4,847+ monthly, often utilizing dynamic pricing and superior guest experiences.
- Strong performing properties (Top 25%) earn $938 or more, indicating effective management and desirable locations/amenities.
- Typical properties (Median) generate around $370 per month, representing the average market performance.
- Entry-level properties (Bottom 25%) see earnings around $171, often with potential for optimization.
Average Monthly Airbnb Earnings Trend in Ezequiel Montes
Ezequiel Montes Airbnb Occupancy Rate Trends (2026)
Maximize your bookings by understanding the Ezequiel Montes STR occupancy trends. Seasonal demand shifts significantly influence how often properties are booked. Typically, Augustsees the highest demand (peak season occupancy), while June experiences the lowest (low season). Effective strategies, like adjusting minimum stays or offering promotions, can boost occupancy during slower periods. Here's how different property tiers perform in Ezequiel Montes:
- Best-in-class properties (Top 10%) achieve 50%+ occupancy, indicating high desirability and potentially optimized availability.
- Strong performing properties (Top 25%) maintain 32% or higher occupancy, suggesting good market fit and guest satisfaction.
- Typical properties (Median) have an occupancy rate around 17%.
- Entry-level properties (Bottom 25%) average 9% occupancy, potentially facing higher vacancy.
Average Monthly Occupancy Rate Trend in Ezequiel Montes
Average Daily Rate (ADR) Airbnb Trends in Ezequiel Montes (2026)
Effective short term rental pricing strategy in Ezequiel Montes involves understanding monthly ADR fluctuations. The Average Daily Rate (ADR) for Airbnb in Ezequiel Montes typically peaks in December and dips lowest during April. Leveraging Airbnb dynamic pricing tools or strategies based on this seasonality can significantly boost revenue. Here's a look at the typical nightly rates achieved:
- Best-in-class properties (Top 10%) command rates of $398+ per night, often due to premium features or locations.
- Strong performing properties (Top 25%) achieve nightly rates of $206 or more.
- Typical properties (Median) charge around $63 per night.
- Entry-level properties (Bottom 25%) earn around $46 per night.
Average Daily Rate (ADR) Trend by Month in Ezequiel Montes
Get Live Ezequiel Montes Market Intelligence 👇

Explore Real-time Analytics
Airbnb Seasonality Analysis & Trends in Ezequiel Montes (2026)
Peak Season (December, July, August)
- Revenue averages $1,734 per month
- Occupancy rates average 30.7%
- Daily rates average $146
Shoulder Season
- Revenue averages $1,243 per month
- Occupancy maintains around 22.0%
- Daily rates hold near $142
Low Season (February, May, June)
- Revenue drops to average $908 per month
- Occupancy decreases to average 18.4%
- Daily rates adjust to average $139
Seasonality Insights for Ezequiel Montes
- The Airbnb seasonality in Ezequiel Montes shows highly seasonal trends requiring careful strategy. While the sections above show seasonal averages, it's also insightful to look at the extremes:
- During the high season, the absolute peak month showcases Ezequiel Montes's highest earning potential, with monthly revenues capable of climbing to $1,958, occupancy reaching a high of 31.2%, and ADRs peaking at $149.
- Conversely, the slowest single month of the year, typically falling within the low season, marks the market's lowest point. In this month, revenue might dip to $849, occupancy could drop to 18.3%, and ADRs may adjust down to $137.
- Understanding both the seasonal averages and these monthly peaks and troughs in revenue, occupancy, and ADR is crucial for maximizing your Airbnb profit potential in Ezequiel Montes.
Seasonal Strategies for Maximizing Profit
- Peak Season: Maximize revenue through premium pricing and potentially longer minimum stays. Ensure high availability.
- Low Season: Offer competitive pricing, special promotions (e.g., extended stay discounts), and flexible cancellation policies. Target off-season travelers like remote workers or budget-conscious guests.
- Shoulder Seasons: Implement dynamic pricing that balances peak and low rates. Target weekend travelers or specific events. Offer slightly more flexible terms than peak season.
- Regularly analyze your own performance against these Ezequiel Montes seasonality benchmarks and adjust your pricing and availability strategy accordingly.
Best Areas for Airbnb Investment in Ezequiel Montes (2026)
Exploring the top neighborhoods for short-term rentals in Ezequiel Montes? This section highlights key areas, outlining why they are attractive for hosts and guests, along with notable local attractions. Consider these locations based on your target guest profile and investment strategy.
| Neighborhood / Area | Why Host Here? (Target Guests & Appeal) | Key Attractions & Landmarks |
|---|---|---|
| Centro Histórico | Ezequiel Montes' historic center offers charming colonial architecture and a cultural vibe. Ideal for tourists wanting to experience local traditions, crafts, and foods. | Templo de San Pedro, Plaza de la Constitución, Museo de la Revolución, Mercado Municipal, Feria del Elote |
| Bernal | Bernal is known for its stunning monolith and is a UNESCO World Heritage site. It's great for nature lovers and those interested in hiking and scenic views. | Peña de Bernal, Ecoturismo, Parque Natural, San Sebastián Bernal, Cultural events |
| San Pedro Ahuacatlán | This area features stunning natural landscapes and is popular for relaxation and retreat stays. It's appealing for visitors looking for tranquility. | Cascadas de Ahuacatlán, Rutas de senderismo, Pueblo mágico, Miradores naturales, Turismo rural |
| La Raza | La Raza offers a more local vibe and is perfect for visitors wanting an authentic experience of everyday life in Ezequiel Montes. | Parque La Raza, Ferias locales, Comida típica, Vida nocturna local, Eventos culturales |
| Zona Centro | The central zone is close to amenities and popular for short stays due to its convenience and access to the local lifestyle. | Cafeterías, Restaurantes locales, Plaza principal, Tiendas de artesanías, Eventos comunitarios |
| El Aguacate | Known for its agricultural surroundings and rural charm, El Aguacate is growing in popularity among travelers seeking a rustic escape. | Visitas a huertos, Caminatas, Turismo agroturístico, Naturaleza local, Pueblos cercanos |
| La Huerta | A quaint neighborhood that offers beautiful gardens and a tranquil environment, appealing for those looking for a peaceful retreat close to nature. | Jardines locales, Rutas de ciclismo, Actividades al aire libre, Visitas a granjas, Eventos comunitarios |
| Sierra Gorda | The Sierra Gorda region is known for its biodiversity and outdoor activities, attracting ecotourism and adventure enthusiasts. | Reserva de la Biosfera, Caminatas, Ciclismo de montaña, Avistamiento de aves, Actividades al aire libre |
Understanding Airbnb License Requirements & STR Laws in Ezequiel Montes (2026)
While Ezequiel Montes, Querétaro, Mexico currently shows low STR regulations, specific Airbnb license requirements might still exist or change. Always verify the latest short term rental regulations and Airbnb license requirements directly with local government authorities for Ezequiel Montes to ensure full compliance before hosting.
(Source: AirROI data, 2026, finding no licensed listings among those analyzed)
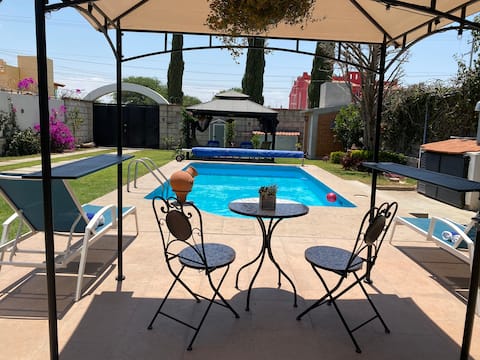
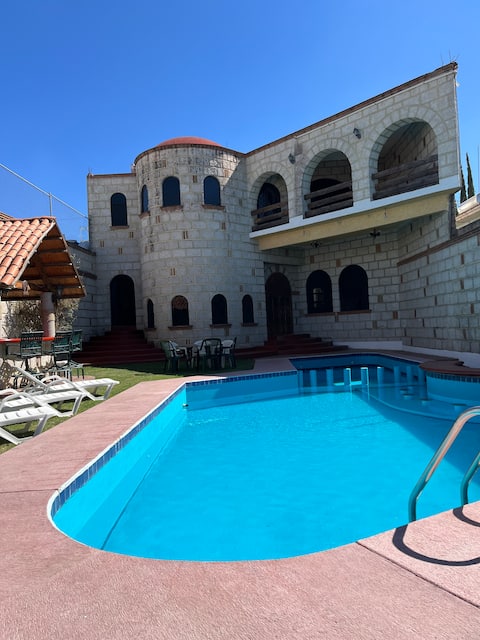
Top Performing Airbnb Properties in Ezequiel Montes (2026)
Benchmark your potential! Explore examples of top-performing Airbnb properties in Ezequiel Montesbased on Trailing Twelve Month (TTM) revenue. Analyze their characteristics, revenue, occupancy rate, and ADR to understand what drives success in this market.

Casa de Campo El Queretano with Thermal Water
Entire Place • 5 bedrooms
Tequisquiapan, Bernal, Chalet with Pool, Vineyards
Entire Place • 4 bedrooms

Casa de Campo El Tikal with thermal water
Entire Place • 5 bedrooms
Vineyard house
Entire Place • 7 bedrooms

Casa Dalia
Entire Place • 5 bedrooms

Tequisquiapan Entre Viñedos
Entire Place • 5 bedrooms
Note: Performance varies based on location, size, amenities, seasonality, and management quality. Data reflects the past 12 months.
Top Performing Airbnb Hosts in Ezequiel Montes (2026)
Learn from the best! This table showcases top-performing Airbnb hosts in Ezequiel Montes based on the number of properties managed and estimated total revenue over the past year. Analyze their scale and performance metrics.
| Host Name | Properties | Grossing Revenue | Stay Reviews | Avg Rating |
|---|---|---|---|---|
| Ernesto | 2 | $129,682 | 174 | 4.93/5.0 |
| César Francisco | 1 | $62,572 | 200 | 4.96/5.0 |
| Pamela Yosandy | 4 | $60,382 | 163 | 4.57/5.0 |
| Iván Jair | 1 | $53,756 | 292 | 4.91/5.0 |
| Alex Ortiz | 5 | $35,359 | 885 | 4.87/5.0 |
| Oscar | 1 | $28,480 | 95 | 4.81/5.0 |
| Toño | 5 | $21,376 | 499 | 4.82/5.0 |
| Ana Rosa | 3 | $15,579 | 197 | 4.72/5.0 |
| Miriam | 5 | $13,709 | 83 | 4.38/5.0 |
| Lupita | 1 | $3,581 | 132 | 4.89/5.0 |
Analyzing the strategies of top hosts, such as their property selection, pricing, and guest communication, can offer valuable lessons for optimizing your own Airbnb operations in Ezequiel Montes.
Dive Deeper: Advanced Ezequiel Montes STR Market Data (2026)
Ready to unlock more insights? AirROI provides access to advanced metrics and comprehensive Airbnb data for Ezequiel Montes. Explore detailed analytics beyond this report to refine your investment strategy, optimize pricing, and maximize your vacation rental profits.
Explore Advanced MetricsEzequiel Montes Short-Term Rental Market Composition (2026): Property & Room Types
Room Type Distribution
Property Type Distribution
Market Composition Insights for Ezequiel Montes
- The Ezequiel Montes Airbnb market composition is heavily skewed towards Entire Home/Apt listings, which make up 60.6% of the 33 active rentals. This indicates strong guest preference for privacy and space.
- However, a notable 39.4% share for Private Rooms suggests opportunities for budget-conscious travelers or hosts renting out spare rooms.
- Looking at the property type distribution in Ezequiel Montes, House properties are the most common (39.4%), reflecting the local real estate landscape.
- Houses represent a significant 39.4% portion, catering likely to families or larger groups.
- The presence of 15.2% Hotel/Boutique listings indicates integration with traditional hospitality.
Ezequiel Montes Airbnb Room Capacity Analysis (2026): Bedroom Distribution
Distribution of Listings by Number of Bedrooms
Room Capacity Insights for Ezequiel Montes
- The dominant room capacity in Ezequiel Montes is 1 bedroom listings, making up 33.3% of the market. This suggests a strong demand for properties suitable for couples or solo travelers.
- Together, 1 bedroom and 2 bedrooms properties represent 57.5% of the active Airbnb listings in Ezequiel Montes, indicating a high concentration in these sizes.
- A significant 27.3% of listings offer 3+ bedrooms, catering to larger groups and families seeking more space in Ezequiel Montes.
Ezequiel Montes Vacation Rental Guest Capacity Trends (2026)
Distribution of Listings by Guest Capacity
Guest Capacity Insights for Ezequiel Montes
- The most common guest capacity trend in Ezequiel Montes vacation rentals is listings accommodating 4 guests (30.3%). This suggests the primary traveler segment is likely small families or groups.
- Properties designed for 4 guests and 8+ guests dominate the Ezequiel Montes STR market, accounting for 57.6% of listings.
- 33.4% of properties accommodate 6+ guests, serving the market segment for larger families or group travel in Ezequiel Montes.
- On average, properties in Ezequiel Montes are equipped to host 4.3 guests.
Ezequiel Montes Airbnb Booking Patterns (2026): Available vs. Booked Days
Available Days Distribution
Booked Days Distribution
Booking Pattern Insights for Ezequiel Montes
- The most common availability pattern in Ezequiel Montes falls within the 271-366 days range, representing 72.7% of listings. This suggests many properties have significant open periods on their calendars.
- Approximately 93.9% of listings show high availability (181+ days open annually), indicating potential for increased bookings or specific owner usage patterns.
- For booked days, the 31-90 days range is most frequent in Ezequiel Montes (39.4%), reflecting common guest stay durations or potential owner blocking patterns.
- A notable 6.0% of properties secure long booking periods (181+ days booked per year), highlighting successful long-term rental strategies or significant owner usage.
Ezequiel Montes Airbnb Minimum Stay Requirements Analysis
Distribution of Listings by Minimum Night Requirement
1 Night
26 listings
78.8% of total
2 Nights
5 listings
15.2% of total
30+ Nights
2 listings
6.1% of total
Key Insights
- The most prevalent minimum stay requirement in Ezequiel Montes is 1 Night, adopted by 78.8% of listings. This highlights the market's preference for shorter, flexible bookings.
- A strong majority (94.0%) of the Ezequiel Montes Airbnb data shows acceptance of very short stays (1-2 nights), indicating a dynamic, high-turnover market.
Recommendations
- Align with the market by considering a 1 Night minimum stay, as 78.8% of Ezequiel Montes hosts use this setting.
- Explore offering discounts for stays of 30+ nights to attract the 6.1% of the market seeking extended stays.
- Adjust minimum nights based on seasonality – potentially shorter during low season and longer during peak demand periods in Ezequiel Montes.
Ezequiel Montes Airbnb Cancellation Policy Trends Analysis (2026)
Flexible
16 listings
48.5% of total
Moderate
7 listings
21.2% of total
Firm
3 listings
9.1% of total
Strict
7 listings
21.2% of total
Cancellation Policy Insights for Ezequiel Montes
- The prevailing Airbnb cancellation policy trend in Ezequiel Montes is Flexible, used by 48.5% of listings.
- There's a relatively balanced mix between guest-friendly (69.7%) and stricter (30.3%) policies, offering choices for different guest needs.
Recommendations for Hosts
- Consider adopting a Flexible policy to align with the 48.5% market standard in Ezequiel Montes.
- Regularly review your cancellation policy against competitors and market demand shifts in Ezequiel Montes.
Ezequiel Montes STR Booking Lead Time Analysis (2026)
Average Booking Lead Time by Month
Booking Lead Time Insights for Ezequiel Montes
- The overall average booking lead time for vacation rentals in Ezequiel Montes is 23 days.
- Guests book furthest in advance for stays during May (average 56 days), likely coinciding with peak travel demand or local events.
- The shortest booking windows occur for stays in February (average 7 days), indicating more last-minute travel plans during this time.
- Seasonally, Spring (32 days avg.) sees the longest lead times, while Fall (17 days avg.) has the shortest, reflecting typical travel planning cycles.
Recommendations for Hosts
- Use the overall average lead time (23 days) as a baseline for your pricing and availability strategy in Ezequiel Montes.
- For May stays, consider implementing length-of-stay discounts or slightly higher rates for bookings made less than 56 days out to capitalize on advance planning.
- During February, focus on last-minute booking availability and promotions, as guests book with very short notice (7 days avg.).
- Target marketing efforts for the Spring season well in advance (at least 32 days) to capture early planners.
- Monitor your own booking lead times against these Ezequiel Montes averages to identify opportunities for dynamic pricing adjustments.
Popular & Essential Airbnb Amenities in Ezequiel Montes (2026)
Amenity Prevalence
Amenity Insights for Ezequiel Montes
- Popular amenities like Wifi, Hot water, Shampoo are common but not universal. Offering these can provide a competitive edge.
- Warning: Wifi is not universally provided but is considered essential globally. Ensure reliable Wifi is offered.
Recommendations for Hosts
- Consider adding popular differentiators like Wifi or Hot water to increase appeal.
- Highlight unique or less common amenities you offer (e.g., hot tub, dedicated workspace, EV charger) in your listing description and photos.
- Regularly check competitor amenities in Ezequiel Montes to stay competitive.
Ezequiel Montes Airbnb Guest Demographics & Profile Analysis (2026)
Guest Profile Summary for Ezequiel Montes
- The typical guest profile for Airbnb in Ezequiel Montes consists of primarily domestic travelers (96%), often arriving from nearby Mexico City, typically belonging to the Post-2000s (Gen Z/Alpha) group (50%), primarily speaking Spanish or English.
- Domestic travelers account for 95.7% of guests.
- Key international markets include Mexico (95.7%) and United States (2.5%).
- Top languages spoken are Spanish (54%) followed by English (35.4%).
- A significant demographic segment is the Post-2000s (Gen Z/Alpha) group, representing 50% of guests.
Recommendations for Hosts
- Target domestic marketing efforts towards travelers from Mexico City and Santiago de Querétaro.
- Tailor amenities and listing descriptions to appeal to the dominant Post-2000s (Gen Z/Alpha) demographic (e.g., highlight fast WiFi, smart home features, local guides).
- Highlight unique local experiences or amenities relevant to the primary guest profile.
- Consider seasonal promotions aligned with peak travel times for key origin markets.
Nearby Short-Term Rental Market Comparison
How does the Ezequiel Montes Airbnb market stack up against its neighbors? Compare key performance metrics like average monthly revenue, ADR, and occupancy rates in surrounding areas to understand the broader regional STR landscape.
| Market | Active Properties | Monthly Revenue | Daily Rate | Avg. Occupancy |
|---|---|---|---|---|
| El Santuario | 44 | $2,583 | $420.27 | 25% |
| Cerro Gordo | 38 | $2,183 | $438.64 | 21% |
| Tepeji del Rio de Ocampo | 11 | $2,125 | $315.80 | 27% |
| Avandaro | 212 | $1,892 | $411.24 | 24% |
| La Tortuga | 71 | $1,658 | $239.12 | 28% |
| Alcocer | 11 | $1,642 | $271.32 | 21% |
| San Miguel de Allende | 2,169 | $1,470 | $194.10 | 32% |
| Ejido San Gaspar | 43 | $1,386 | $267.18 | 20% |
| Cuauhtémoc | 13 | $1,344 | $93.02 | 54% |
| Juárez | 44 | $1,317 | $98.72 | 54% |