El Carmen Airbnb Market Analysis 2026: Short Term Rental Data & Vacation Rental Statistics in Querétaro, Mexico
Is Airbnb profitable in El Carmen in 2026? Explore comprehensive Airbnb analytics for El Carmen, Querétaro, Mexico to uncover income potential. This 2026 STR market report for El Carmen, based on AirROI data from February 2025 to January 2026, reveals key trends in the niche market of 38 active listings.
Whether you're considering an Airbnb investment in El Carmen, optimizing your existing vacation rental, or exploring rental arbitrage opportunities, understanding the El Carmen Airbnb data is crucial. Leveraging the low regulation environment is key to maximizing your short term rental income potential. Let's dive into the specifics.
Key El Carmen Airbnb Performance Metrics Overview
Monthly Airbnb Revenue Variations & Income Potential in El Carmen (2026)
Understanding the monthly revenue variations for Airbnb listings in El Carmen is key to maximizing your short term rental income potential. Seasonality significantly impacts earnings. Our analysis, based on data from the past 12 months, shows that the peak revenue month for STRs in El Carmen is typically September, while January often presents the lowest earnings, highlighting opportunities for strategic pricing adjustments during shoulder and low seasons. Explore the typical Airbnb income in El Carmen across different performance tiers:
- Best-in-class properties (Top 10%) achieve $1,207+ monthly, often utilizing dynamic pricing and superior guest experiences.
- Strong performing properties (Top 25%) earn $714 or more, indicating effective management and desirable locations/amenities.
- Typical properties (Median) generate around $360 per month, representing the average market performance.
- Entry-level properties (Bottom 25%) see earnings around $187, often with potential for optimization.
Average Monthly Airbnb Earnings Trend in El Carmen
El Carmen Airbnb Occupancy Rate Trends (2026)
Maximize your bookings by understanding the El Carmen STR occupancy trends. Seasonal demand shifts significantly influence how often properties are booked. Typically, Marchsees the highest demand (peak season occupancy), while January experiences the lowest (low season). Effective strategies, like adjusting minimum stays or offering promotions, can boost occupancy during slower periods. Here's how different property tiers perform in El Carmen:
- Best-in-class properties (Top 10%) achieve 71%+ occupancy, indicating high desirability and potentially optimized availability.
- Strong performing properties (Top 25%) maintain 52% or higher occupancy, suggesting good market fit and guest satisfaction.
- Typical properties (Median) have an occupancy rate around 27%.
- Entry-level properties (Bottom 25%) average 14% occupancy, potentially facing higher vacancy.
Average Monthly Occupancy Rate Trend in El Carmen
Average Daily Rate (ADR) Airbnb Trends in El Carmen (2026)
Effective short term rental pricing strategy in El Carmen involves understanding monthly ADR fluctuations. The Average Daily Rate (ADR) for Airbnb in El Carmen typically peaks in January and dips lowest during March. Leveraging Airbnb dynamic pricing tools or strategies based on this seasonality can significantly boost revenue. Here's a look at the typical nightly rates achieved:
- Best-in-class properties (Top 10%) command rates of $73+ per night, often due to premium features or locations.
- Strong performing properties (Top 25%) achieve nightly rates of $59 or more.
- Typical properties (Median) charge around $44 per night.
- Entry-level properties (Bottom 25%) earn around $33 per night.
Average Daily Rate (ADR) Trend by Month in El Carmen
Get Live El Carmen Market Intelligence 👇

Explore Real-time Analytics
Airbnb Seasonality Analysis & Trends in El Carmen (2026)
Peak Season (September, August, March)
- Revenue averages $703 per month
- Occupancy rates average 40.4%
- Daily rates average $51
Shoulder Season
- Revenue averages $573 per month
- Occupancy maintains around 36.5%
- Daily rates hold near $51
Low Season (January, May, November)
- Revenue drops to average $414 per month
- Occupancy decreases to average 24.0%
- Daily rates adjust to average $55
Seasonality Insights for El Carmen
- The Airbnb seasonality in El Carmen shows highly seasonal trends requiring careful strategy. While the sections above show seasonal averages, it's also insightful to look at the extremes:
- During the high season, the absolute peak month showcases El Carmen's highest earning potential, with monthly revenues capable of climbing to $776, occupancy reaching a high of 43.4%, and ADRs peaking at $63.
- Conversely, the slowest single month of the year, typically falling within the low season, marks the market's lowest point. In this month, revenue might dip to $326, occupancy could drop to 19.4%, and ADRs may adjust down to $46.
- Understanding both the seasonal averages and these monthly peaks and troughs in revenue, occupancy, and ADR is crucial for maximizing your Airbnb profit potential in El Carmen.
Seasonal Strategies for Maximizing Profit
- Peak Season: Maximize revenue through premium pricing and potentially longer minimum stays. Ensure high availability.
- Low Season: Offer competitive pricing, special promotions (e.g., extended stay discounts), and flexible cancellation policies. Target off-season travelers like remote workers or budget-conscious guests.
- Shoulder Seasons: Implement dynamic pricing that balances peak and low rates. Target weekend travelers or specific events. Offer slightly more flexible terms than peak season.
- Regularly analyze your own performance against these El Carmen seasonality benchmarks and adjust your pricing and availability strategy accordingly.
Best Areas for Airbnb Investment in El Carmen (2026)
Exploring the top neighborhoods for short-term rentals in El Carmen? This section highlights key areas, outlining why they are attractive for hosts and guests, along with notable local attractions. Consider these locations based on your target guest profile and investment strategy.
| Neighborhood / Area | Why Host Here? (Target Guests & Appeal) | Key Attractions & Landmarks |
|---|---|---|
| Centro Histórico | The historical center of Querétaro is a UNESCO World Heritage site, attracting tourists with its colonial architecture and rich history. This area is perfect for guests wanting to explore cultural landmarks and local cuisine. | Aqueduct of Querétaro, Querétaro Regional Museum, Temple of Santa Rosa de Viterbo, Plaza de Armas, Historic Walks of Querétaro |
| Juriquilla | An upscale residential area known for its modern amenities and proximity to tech and business hubs. Ideal for business travelers and families looking for long-term stays. | Antea Lifestyle Center, El Cerro de las Campanas, Juriquilla Park, Galerías Querétaro, Local dining options |
| El Campanario | A prestigious residential community with beautiful parks and golf courses. This area is sought after by affluent travelers looking for luxury stays in a serene environment. | El Campanario Golf Course, Local upscale dining, Parks and walking trails, Nearby shopping centers |
| Querétaro Centro Sur | A growing area with a mix of residential and commercial spaces, popular among families and business professionals. Close to corporate offices and shopping areas. | Plaza del Parque, Cinemex, Local restaurants and cafes, Proximity to the Queretaro industrial park |
| Zona Tepeji | An area that combines accessibility with local charm, making it attractive for budget travelers and those looking to experience a more authentic Querétaro. | Local markets, Traditional eateries, Community parks, Cultural events |
| Balvanera , Querétaro | A family-friendly neighborhood that offers a laid-back vibe with access to amenities, making it appealing for long-term rentals and family trips. | Local schools, Family parks, Shopping centers, Community events |
| Cumbres del Lago | A safe and tranquil residential area with modern homes and nearby amenities. Ideal for travelers seeking a peaceful stay away from the hustle and bustle. | Cumbres del Lago Park, Shopping areas, Nearby recreational facilities, Private community events |
| Santa Rosa | A vibrant neighborhood known for local markets and eateries, attracting visitors who want to experience the local lifestyle in Querétaro. | Mercado de Santa Rosa, Cultural festivals, Local artisan shops, Proximity to public transport |
Understanding Airbnb License Requirements & STR Laws in El Carmen (2026)
While El Carmen, Querétaro, Mexico currently shows low STR regulations, specific Airbnb license requirements might still exist or change. Always verify the latest short term rental regulations and Airbnb license requirements directly with local government authorities for El Carmen to ensure full compliance before hosting.
(Source: AirROI data, 2026, finding no licensed listings among those analyzed)
Top Performing Airbnb Properties in El Carmen (2026)
Benchmark your potential! Explore examples of top-performing Airbnb properties in El Carmenbased on Trailing Twelve Month (TTM) revenue. Analyze their characteristics, revenue, occupancy rate, and ADR to understand what drives success in this market.
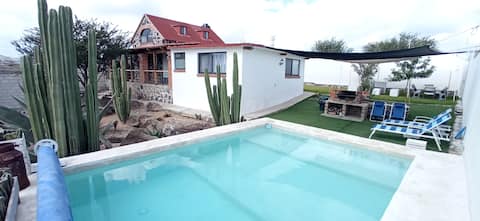
The Cute Cabin of Querétaro
Entire Place • 4 bedrooms
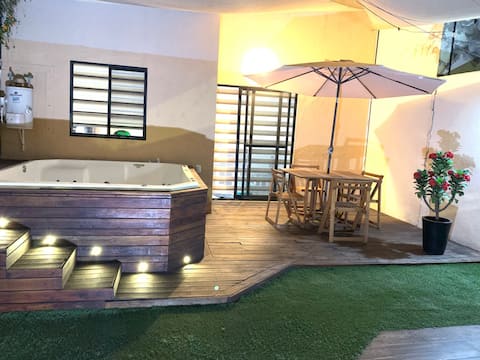
House with terrace and private Jacuzzi, Internet!
Entire Place • 2 bedrooms
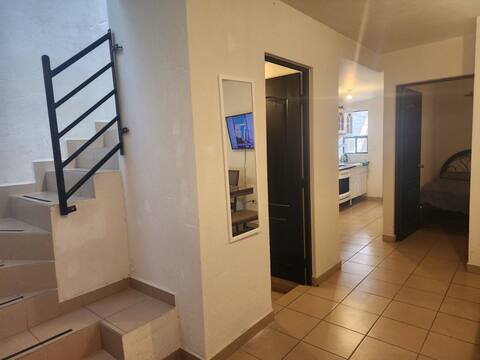
ideal for a company or family
Entire Place • 3 bedrooms

The house in the corner
Entire Place • 3 bedrooms
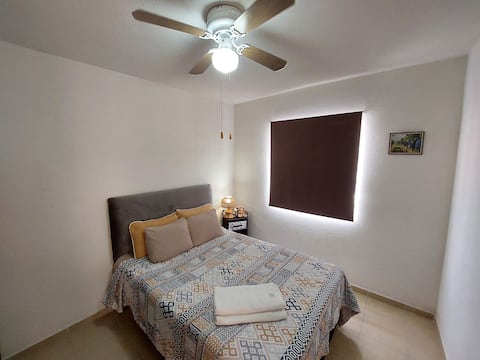
Comfortable Real Solare apartment, amenities
Entire Place • 2 bedrooms
Casa Valencia
Entire Place • 3 bedrooms
Note: Performance varies based on location, size, amenities, seasonality, and management quality. Data reflects the past 12 months.
Top Performing Airbnb Hosts in El Carmen (2026)
Learn from the best! This table showcases top-performing Airbnb hosts in El Carmen based on the number of properties managed and estimated total revenue over the past year. Analyze their scale and performance metrics.
| Host Name | Properties | Grossing Revenue | Stay Reviews | Avg Rating |
|---|---|---|---|---|
| Ana Laura | 1 | $32,943 | 30 | 4.87/5.0 |
| Eisden | 8 | $26,335 | 85 | 4.72/5.0 |
| HostHome | 7 | $22,026 | 241 | 4.57/5.0 |
| Saul | 2 | $18,421 | 64 | 4.80/5.0 |
| Pedro | 3 | $17,363 | 38 | 4.48/5.0 |
| Jafet | 1 | $10,940 | 118 | 4.84/5.0 |
| Nancy | 1 | $8,475 | 157 | 4.91/5.0 |
| Karla | 1 | $8,135 | 114 | 4.83/5.0 |
| Marco | 1 | $5,714 | 40 | 4.95/5.0 |
| Leonardo | 1 | $4,905 | 75 | 4.87/5.0 |
Analyzing the strategies of top hosts, such as their property selection, pricing, and guest communication, can offer valuable lessons for optimizing your own Airbnb operations in El Carmen.
Dive Deeper: Advanced El Carmen STR Market Data (2026)
Ready to unlock more insights? AirROI provides access to advanced metrics and comprehensive Airbnb data for El Carmen. Explore detailed analytics beyond this report to refine your investment strategy, optimize pricing, and maximize your vacation rental profits.
Explore Advanced MetricsEl Carmen Short-Term Rental Market Composition (2026): Property & Room Types
Room Type Distribution
Property Type Distribution
Market Composition Insights for El Carmen
- The El Carmen Airbnb market composition is heavily skewed towards Entire Home/Apt listings, which make up 100% of the 38 active rentals. This indicates strong guest preference for privacy and space.
- Looking at the property type distribution in El Carmen, House properties are the most common (63.2%), reflecting the local real estate landscape.
- Houses represent a significant 63.2% portion, catering likely to families or larger groups.
- Smaller segments like outdoor/unique (combined 2.6%) offer potential for unique stay experiences.
El Carmen Airbnb Room Capacity Analysis (2026): Bedroom Distribution
Distribution of Listings by Number of Bedrooms
Room Capacity Insights for El Carmen
- The dominant room capacity in El Carmen is 2 bedrooms listings, making up 50% of the market. This suggests a strong demand for properties suitable for couples or solo travelers.
- Together, 2 bedrooms and 3 bedrooms properties represent 89.5% of the active Airbnb listings in El Carmen, indicating a high concentration in these sizes.
- A significant 47.4% of listings offer 3+ bedrooms, catering to larger groups and families seeking more space in El Carmen.
El Carmen Vacation Rental Guest Capacity Trends (2026)
Distribution of Listings by Guest Capacity
Guest Capacity Insights for El Carmen
- The most common guest capacity trend in El Carmen vacation rentals is listings accommodating 6 guests (34.2%). This suggests the primary traveler segment is likely larger groups.
- Properties designed for 6 guests and 8+ guests dominate the El Carmen STR market, accounting for 60.5% of listings.
- 68.4% of properties accommodate 6+ guests, serving the market segment for larger families or group travel in El Carmen.
- On average, properties in El Carmen are equipped to host 5.8 guests.
El Carmen Airbnb Booking Patterns (2026): Available vs. Booked Days
Available Days Distribution
Booked Days Distribution
Booking Pattern Insights for El Carmen
- The most common availability pattern in El Carmen falls within the 271-366 days range, representing 63.2% of listings. This suggests many properties have significant open periods on their calendars.
- Approximately 92.1% of listings show high availability (181+ days open annually), indicating potential for increased bookings or specific owner usage patterns.
- For booked days, the 91-180 days range is most frequent in El Carmen (36.8%), reflecting common guest stay durations or potential owner blocking patterns.
- A notable 7.9% of properties secure long booking periods (181+ days booked per year), highlighting successful long-term rental strategies or significant owner usage.
El Carmen Airbnb Minimum Stay Requirements Analysis
Distribution of Listings by Minimum Night Requirement
1 Night
27 listings
71.1% of total
2 Nights
6 listings
15.8% of total
30+ Nights
5 listings
13.2% of total
Key Insights
- The most prevalent minimum stay requirement in El Carmen is 1 Night, adopted by 71.1% of listings. This highlights the market's preference for shorter, flexible bookings.
- A strong majority (86.9%) of the El Carmen Airbnb data shows acceptance of very short stays (1-2 nights), indicating a dynamic, high-turnover market.
- A significant segment (13.2%) caters to monthly stays (30+ nights) in El Carmen, pointing to opportunities in the extended-stay market.
Recommendations
- Align with the market by considering a 1 Night minimum stay, as 71.1% of El Carmen hosts use this setting.
- Explore offering discounts for stays of 30+ nights to attract the 13.2% of the market seeking extended stays.
- Adjust minimum nights based on seasonality – potentially shorter during low season and longer during peak demand periods in El Carmen.
El Carmen Airbnb Cancellation Policy Trends Analysis (2026)
Limited
1 listings
2.6% of total
Flexible
27 listings
71.1% of total
Moderate
8 listings
21.1% of total
Firm
2 listings
5.3% of total
Cancellation Policy Insights for El Carmen
- The prevailing Airbnb cancellation policy trend in El Carmen is Flexible, used by 71.1% of listings.
- The market strongly favors guest-friendly terms, with 92.2% of listings offering Flexible or Moderate policies. This suggests guests in El Carmen may expect booking flexibility.
Recommendations for Hosts
- Consider adopting a Flexible policy to align with the 71.1% market standard in El Carmen.
- Given the high prevalence of Flexible policies (71.1%), offering this can enhance booking appeal, especially during shoulder seasons.
- Regularly review your cancellation policy against competitors and market demand shifts in El Carmen.
El Carmen STR Booking Lead Time Analysis (2026)
Average Booking Lead Time by Month
Booking Lead Time Insights for El Carmen
- The overall average booking lead time for vacation rentals in El Carmen is 16 days.
- Guests book furthest in advance for stays during December (average 27 days), likely coinciding with peak travel demand or local events.
- The shortest booking windows occur for stays in February (average 5 days), indicating more last-minute travel plans during this time.
- Seasonally, Winter (14 days avg.) sees the longest lead times, while Spring (11 days avg.) has the shortest, reflecting typical travel planning cycles.
Recommendations for Hosts
- Use the overall average lead time (16 days) as a baseline for your pricing and availability strategy in El Carmen.
- For December stays, consider implementing length-of-stay discounts or slightly higher rates for bookings made less than 27 days out to capitalize on advance planning.
- During February, focus on last-minute booking availability and promotions, as guests book with very short notice (5 days avg.).
- Target marketing efforts for the Winter season well in advance (at least 14 days) to capture early planners.
- Monitor your own booking lead times against these El Carmen averages to identify opportunities for dynamic pricing adjustments.
Popular & Essential Airbnb Amenities in El Carmen (2026)
Amenity Prevalence
Amenity Insights for El Carmen
- Essential amenities in El Carmen that guests expect include: Kitchen, Wifi. Lacking these (any) could significantly impact bookings.
- Popular amenities like Free parking on premises, TV, Carbon monoxide alarm are common but not universal. Offering these can provide a competitive edge.
Recommendations for Hosts
- Ensure your listing includes all essential amenities for El Carmen: Kitchen, Wifi.
- Prioritize adding missing essentials: Wifi.
- Consider adding popular differentiators like Free parking on premises or TV to increase appeal.
- Highlight unique or less common amenities you offer (e.g., hot tub, dedicated workspace, EV charger) in your listing description and photos.
- Regularly check competitor amenities in El Carmen to stay competitive.
El Carmen Airbnb Guest Demographics & Profile Analysis (2026)
Guest Profile Summary for El Carmen
- The typical guest profile for Airbnb in El Carmen consists of primarily domestic travelers (99%), often arriving from nearby Mexico City, typically belonging to the Post-2000s (Gen Z/Alpha) group (50%), primarily speaking Spanish or English.
- Domestic travelers account for 99.3% of guests.
- Key international markets include Mexico (99.3%) and United States (0.7%).
- Top languages spoken are Spanish (58%) followed by English (37%).
- A significant demographic segment is the Post-2000s (Gen Z/Alpha) group, representing 50% of guests.
Recommendations for Hosts
- Target domestic marketing efforts towards travelers from Mexico City and Santiago de Querétaro.
- Tailor amenities and listing descriptions to appeal to the dominant Post-2000s (Gen Z/Alpha) demographic (e.g., highlight fast WiFi, smart home features, local guides).
- Highlight unique local experiences or amenities relevant to the primary guest profile.
- Consider seasonal promotions aligned with peak travel times for key origin markets.
Nearby Short-Term Rental Market Comparison
How does the El Carmen Airbnb market stack up against its neighbors? Compare key performance metrics like average monthly revenue, ADR, and occupancy rates in surrounding areas to understand the broader regional STR landscape.
| Market | Active Properties | Monthly Revenue | Daily Rate | Avg. Occupancy |
|---|---|---|---|---|
| El Santuario | 44 | $2,583 | $420.27 | 25% |
| Cerro Gordo | 38 | $2,183 | $438.64 | 21% |
| Tepeji del Rio de Ocampo | 11 | $2,125 | $315.80 | 27% |
| Avandaro | 212 | $1,892 | $411.24 | 24% |
| La Tortuga | 71 | $1,658 | $239.12 | 28% |
| Alcocer | 11 | $1,642 | $271.32 | 21% |
| San Miguel de Allende | 2,169 | $1,470 | $194.10 | 32% |
| Ejido San Gaspar | 43 | $1,386 | $267.18 | 20% |
| Lomas de Comanjilla | 21 | $1,382 | $183.03 | 27% |
| Cuauhtémoc | 13 | $1,344 | $93.02 | 54% |