San Pablo Etla Airbnb Market Analysis 2025: Short Term Rental Data & Vacation Rental Statistics in Oaxaca, Mexico
Is Airbnb profitable in San Pablo Etla in 2025? Explore comprehensive Airbnb analytics for San Pablo Etla, Oaxaca, Mexico to uncover income potential. This 2025 STR market report for San Pablo Etla, based on AirROI data from April 2024 to March 2025, reveals key trends in the niche market of 18 active listings.
Whether you're considering an Airbnb investment in San Pablo Etla, optimizing your existing vacation rental, or exploring rental arbitrage opportunities, understanding the San Pablo Etla Airbnb data is crucial. Leveraging the low regulation environment is key to maximizing your short term rental income potential. Let's dive into the specifics.
Key San Pablo Etla Airbnb Performance Metrics Overview
Monthly Airbnb Revenue Variations & Income Potential in San Pablo Etla (2025)
Understanding the monthly revenue variations for Airbnb listings in San Pablo Etla is key to maximizing your short term rental income potential. Seasonality significantly impacts earnings. Our analysis, based on data from the past 12 months, shows that the peak revenue month for STRs in San Pablo Etla is typically July, while August often presents the lowest earnings, highlighting opportunities for strategic pricing adjustments during shoulder and low seasons. Explore the typical Airbnb income in San Pablo Etla across different performance tiers:
- Best-in-class properties (Top 10%) achieve $1,497+ monthly, often utilizing dynamic pricing and superior guest experiences.
- Strong performing properties (Top 25%) earn $904 or more, indicating effective management and desirable locations/amenities.
- Typical properties (Median) generate around $528 per month, representing the average market performance.
- Entry-level properties (Bottom 25%) see earnings around $257, often with potential for optimization.
Average Monthly Airbnb Earnings Trend in San Pablo Etla
San Pablo Etla Airbnb Occupancy Rate Trends (2025)
Maximize your bookings by understanding the San Pablo Etla STR occupancy trends. Seasonal demand shifts significantly influence how often properties are booked. Typically, Maysees the highest demand (peak season occupancy), while November experiences the lowest (low season). Effective strategies, like adjusting minimum stays or offering promotions, can boost occupancy during slower periods. Here's how different property tiers perform in San Pablo Etla:
- Best-in-class properties (Top 10%) achieve 55%+ occupancy, indicating high desirability and potentially optimized availability.
- Strong performing properties (Top 25%) maintain 34% or higher occupancy, suggesting good market fit and guest satisfaction.
- Typical properties (Median) have an occupancy rate around 19%.
- Entry-level properties (Bottom 25%) average 9% occupancy, potentially facing higher vacancy.
Average Monthly Occupancy Rate Trend in San Pablo Etla
Average Daily Rate (ADR) Airbnb Trends in San Pablo Etla (2025)
Effective short term rental pricing strategy in San Pablo Etla involves understanding monthly ADR fluctuations. The Average Daily Rate (ADR) for Airbnb in San Pablo Etla typically peaks in July and dips lowest during March. Leveraging Airbnb dynamic pricing tools or strategies based on this seasonality can significantly boost revenue. Here's a look at the typical nightly rates achieved:
- Best-in-class properties (Top 10%) command rates of $363+ per night, often due to premium features or locations.
- Strong performing properties (Top 25%) achieve nightly rates of $98 or more.
- Typical properties (Median) charge around $57 per night.
- Entry-level properties (Bottom 25%) earn around $42 per night.
Average Daily Rate (ADR) Trend by Month in San Pablo Etla
Get Live San Pablo Etla Market Intelligence 👇

Explore Real-time Analytics
Airbnb Seasonality Analysis & Trends in San Pablo Etla (2025)
Peak Season (July, June, May)
- Revenue averages $1,426 per month
- Occupancy rates average 30.7%
- Daily rates average $160
Shoulder Season
- Revenue averages $511 per month
- Occupancy maintains around 25.4%
- Daily rates hold near $120
Low Season (February, August, October)
- Revenue drops to average $357 per month
- Occupancy decreases to average 19.3%
- Daily rates adjust to average $137
Seasonality Insights for San Pablo Etla
- The Airbnb seasonality in San Pablo Etla shows highly seasonal trends requiring careful strategy. While the sections above show seasonal averages, it's also insightful to look at the extremes:
- During the high season, the absolute peak month showcases San Pablo Etla's highest earning potential, with monthly revenues capable of climbing to $1,663, occupancy reaching a high of 35.5%, and ADRs peaking at $161.
- Conversely, the slowest single month of the year, typically falling within the low season, marks the market's lowest point. In this month, revenue might dip to $307, occupancy could drop to 16.0%, and ADRs may adjust down to $96.
- Understanding both the seasonal averages and these monthly peaks and troughs in revenue, occupancy, and ADR is crucial for maximizing your Airbnb profit potential in San Pablo Etla.
Seasonal Strategies for Maximizing Profit
- Peak Season: Maximize revenue through premium pricing and potentially longer minimum stays. Ensure high availability.
- Low Season: Offer competitive pricing, special promotions (e.g., extended stay discounts), and flexible cancellation policies. Target off-season travelers like remote workers or budget-conscious guests.
- Shoulder Seasons: Implement dynamic pricing that balances peak and low rates. Target weekend travelers or specific events. Offer slightly more flexible terms than peak season.
- Regularly analyze your own performance against these San Pablo Etla seasonality benchmarks and adjust your pricing and availability strategy accordingly.
Best Areas for Airbnb Investment in San Pablo Etla (2025)
Exploring the top neighborhoods for short-term rentals in San Pablo Etla? This section highlights key areas, outlining why they are attractive for hosts and guests, along with notable local attractions. Consider these locations based on your target guest profile and investment strategy.
| Neighborhood / Area | Why Host Here? (Target Guests & Appeal) | Key Attractions & Landmarks |
|---|---|---|
| Centro Histórico | The historic center of Etla is rich in culture and colonial architecture. Attracts tourists interested in history and local traditions, making it a prime spot for cultural experiences. | Temple of San Pablo, Local artisan markets, Festivals and traditional events, Museums, Plaza de las Tres Culturas |
| San Pablo | This area offers proximity to local markets and eateries, giving visitors an authentic taste of Oaxaca life. Ideal for travelers looking for a genuine experience away from the more touristy spots. | Local markets, Traditional Oaxacan cuisine, Artisan workshops, Community events, Street art |
| Etla Valley | Known for its stunning natural landscapes and hiking opportunities, this area attracts nature lovers and those seeking tranquility. Perfect for ecotourism and outdoor activities. | Mountains and trails, Natural parks, Bird watching, Adventure sports, Stunning views |
| Ocotlán de Morelos | Just a short drive away, Ocotlán is famed for its vibrant markets and rich cultural heritage. Offers an easy day trip experience for Airbnb guests. | Ocotlán Market, Museo de Arte, Gallery of local artisans, Cultural festivals, Historic buildings |
| Tlacolula | A major market town, Tlacolula hosts one of the best traditional markets in the region. Great for guests interested in authentic food and local crafts. | Tlacolula Market, Local agave distilleries, Cultural events, Historic churches, Artisan shops |
| Santa María del Tule | Home to the famous Tule Tree, this town is a must-visit for tourists. Provides a unique experience and is great for short stays. | Tule Tree, Local artisanal products, Natural swimming areas, Cultural heritage sites, Festivals |
| San Sebastián Tutla | A quiet community with access to beautiful hiking trails and local culture. Suitable for those wanting to escape the hustle and bustle. | Hiking trails, Rural tourism, Natural landscapes, Traditional food experiences, Community life |
| Agua de Sapo | A lesser-known area but perfect for those looking for a unique and peaceful getaway. Attracts guests interested in relaxation and nature. | Natural springs, Quiet surroundings, Cultural experiences, Artisan crafts, Diverse flora and fauna |
Understanding Airbnb License Requirements & STR Laws in San Pablo Etla (2025)
While San Pablo Etla, Oaxaca, Mexico currently shows low STR regulations, specific Airbnb license requirements might still exist or change. Always verify the latest short term rental regulations and Airbnb license requirements directly with local government authorities for San Pablo Etla to ensure full compliance before hosting.
(Source: AirROI data, 2025, finding no licensed listings among those analyzed)
Top Performing Airbnb Properties in San Pablo Etla (2025)
Benchmark your potential! Explore examples of top-performing Airbnb properties in San Pablo Etlabased on Trailing Twelve Month (TTM) revenue. Analyze their characteristics, revenue, occupancy rate, and ADR to understand what drives success in this market.
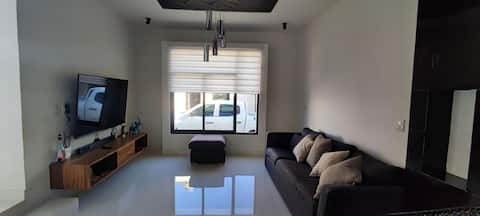
House of dancers.
Entire Place • 3 bedrooms
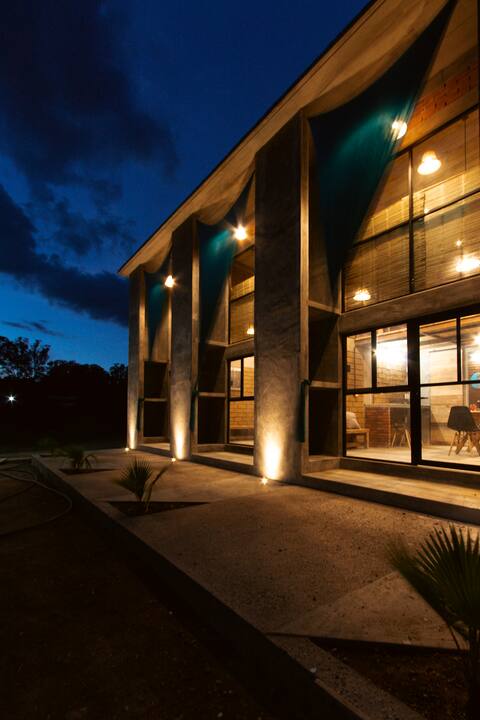
6 recámaras, campestre, alberca, naturaleza.
Entire Place • 6 bedrooms
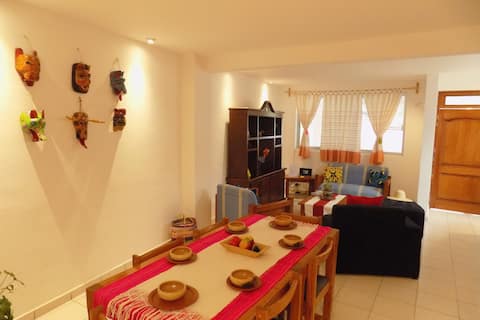
Villa Balam: simplicity and tradition..
Private Room • 2 bedrooms
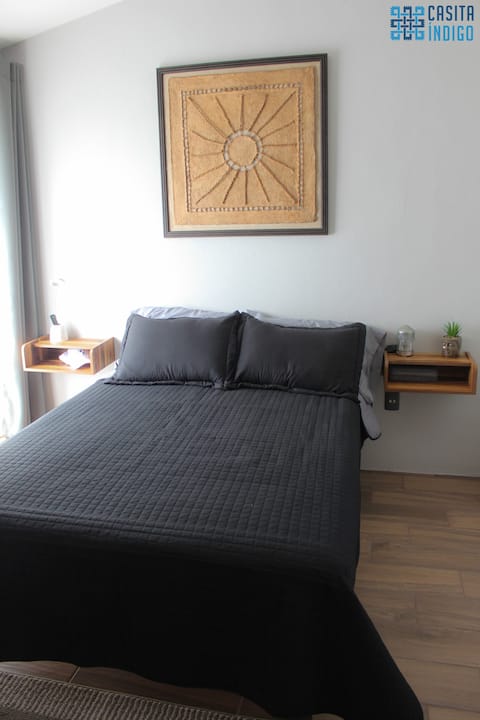
Casita Indigo, your home in Oaxaca
Entire Place • 2 bedrooms

8 habitaciones con dos camas nuevas con alberca
Entire Place • 8 bedrooms

Agave Azul Garden, Pool & Palapa
Entire Place • 4 bedrooms
Note: Performance varies based on location, size, amenities, seasonality, and management quality. Data reflects the past 12 months.
Top Performing Airbnb Hosts in San Pablo Etla (2025)
Learn from the best! This table showcases top-performing Airbnb hosts in San Pablo Etla based on the number of properties managed and estimated total revenue over the past year. Analyze their scale and performance metrics.
| Host Name | Properties | Grossing Revenue | Stay Reviews | Avg Rating |
|---|---|---|---|---|
| Ricardo Abel | 1 | $10,731 | 24 | 4.92/5.0 |
| EL Refugio | 3 | $7,805 | 4 | 1.56/5.0 |
| Host #147804805 | 1 | $6,799 | 2 | 0.00/5.0 |
| Octavio | 1 | $6,712 | 77 | 4.90/5.0 |
| Myzraim | 1 | $6,361 | 12 | 5.00/5.0 |
| Agave Azul | 1 | $5,671 | 107 | 4.58/5.0 |
| Miguel Angel | 1 | $3,832 | 9 | 4.67/5.0 |
| Oscar Guillermo | 1 | $3,585 | 36 | 4.94/5.0 |
| Uriel | 3 | $2,746 | 9 | 3.16/5.0 |
| José Antonio | 2 | $2,564 | 21 | 4.97/5.0 |
Analyzing the strategies of top hosts, such as their property selection, pricing, and guest communication, can offer valuable lessons for optimizing your own Airbnb operations in San Pablo Etla.
Dive Deeper: Advanced San Pablo Etla STR Market Data (2025)
Ready to unlock more insights? AirROI provides access to advanced metrics and comprehensive Airbnb data for San Pablo Etla. Explore detailed analytics beyond this report to refine your investment strategy, optimize pricing, and maximize your vacation rental profits.
Explore Advanced MetricsSan Pablo Etla Short-Term Rental Market Composition (2025): Property & Room Types
Room Type Distribution
Property Type Distribution
Market Composition Insights for San Pablo Etla
- The San Pablo Etla Airbnb market composition is heavily skewed towards Entire Home/Apt listings, which make up 77.8% of the 18 active rentals. This indicates strong guest preference for privacy and space.
- Looking at the property type distribution in San Pablo Etla, House properties are the most common (66.7%), reflecting the local real estate landscape.
- Houses represent a significant 66.7% portion, catering likely to families or larger groups.
- The presence of 16.7% Hotel/Boutique listings indicates integration with traditional hospitality.
San Pablo Etla Airbnb Room Capacity Analysis (2025): Bedroom Distribution
Distribution of Listings by Number of Bedrooms
Room Capacity Insights for San Pablo Etla
- The dominant room capacity in San Pablo Etla is 1 bedroom listings, making up 44.4% of the market. This suggests a strong demand for properties suitable for couples or solo travelers.
- Together, 1 bedroom and 2 bedrooms properties represent 72.2% of the active Airbnb listings in San Pablo Etla, indicating a high concentration in these sizes.
- A significant 27.8% of listings offer 3+ bedrooms, catering to larger groups and families seeking more space in San Pablo Etla.
San Pablo Etla Vacation Rental Guest Capacity Trends (2025)
Distribution of Listings by Guest Capacity
Guest Capacity Insights for San Pablo Etla
- The most common guest capacity trend in San Pablo Etla vacation rentals is listings accommodating 2 guests (38.9%). This suggests the primary traveler segment is likely couples or solo travelers.
- Properties designed for 2 guests and 8+ guests dominate the San Pablo Etla STR market, accounting for 61.1% of listings.
- 27.8% of properties accommodate 6+ guests, serving the market segment for larger families or group travel in San Pablo Etla.
- On average, properties in San Pablo Etla are equipped to host 4.1 guests.
San Pablo Etla Airbnb Booking Patterns (2025): Available vs. Booked Days
Available Days Distribution
Booked Days Distribution
Booking Pattern Insights for San Pablo Etla
- The most common availability pattern in San Pablo Etla falls within the 271-366 days range, representing 88.9% of listings. This suggests many properties have significant open periods on their calendars.
- Approximately 94.5% of listings show high availability (181+ days open annually), indicating potential for increased bookings or specific owner usage patterns.
- For booked days, the 1-30 days range is most frequent in San Pablo Etla (55.6%), reflecting common guest stay durations or potential owner blocking patterns.
- A notable 5.6% of properties secure long booking periods (181+ days booked per year), highlighting successful long-term rental strategies or significant owner usage.
San Pablo Etla Airbnb Minimum Stay Requirements Analysis
Distribution of Listings by Minimum Night Requirement
1 Night
2 listings
11.8% of total
2 Nights
8 listings
47.1% of total
3 Nights
3 listings
17.6% of total
30+ Nights
4 listings
23.5% of total
Key Insights
- The most prevalent minimum stay requirement in San Pablo Etla is 2 Nights, adopted by 47.1% of listings. This highlights the market's preference for shorter, flexible bookings.
- A significant segment (23.5%) caters to monthly stays (30+ nights) in San Pablo Etla, pointing to opportunities in the extended-stay market.
Recommendations
- Align with the market by considering a 2 Nights minimum stay, as 47.1% of San Pablo Etla hosts use this setting.
- If feasible, allowing 1-night stays, especially midweek or during low season, could capture last-minute bookings, as only 11.8% currently do.
- A 2-night minimum appears standard (47.1%). Consider this for weekends or peak periods.
- Explore offering discounts for stays of 30+ nights to attract the 23.5% of the market seeking extended stays.
- Adjust minimum nights based on seasonality – potentially shorter during low season and longer during peak demand periods in San Pablo Etla.
San Pablo Etla Airbnb Cancellation Policy Trends Analysis (2025)
Flexible
5 listings
38.5% of total
Moderate
3 listings
23.1% of total
Firm
2 listings
15.4% of total
Strict
3 listings
23.1% of total
Cancellation Policy Insights for San Pablo Etla
- The prevailing Airbnb cancellation policy trend in San Pablo Etla is Flexible, used by 38.5% of listings.
- There's a relatively balanced mix between guest-friendly (61.6%) and stricter (38.5%) policies, offering choices for different guest needs.
Recommendations for Hosts
- Consider adopting a Flexible policy to align with the 38.5% market standard in San Pablo Etla.
- Regularly review your cancellation policy against competitors and market demand shifts in San Pablo Etla.
San Pablo Etla STR Booking Lead Time Analysis (2025)
Average Booking Lead Time by Month
Booking Lead Time Insights for San Pablo Etla
- The overall average booking lead time for vacation rentals in San Pablo Etla is 61 days.
- Guests book furthest in advance for stays during February (average 116 days), likely coinciding with peak travel demand or local events.
- The shortest booking windows occur for stays in June (average 2 days), indicating more last-minute travel plans during this time.
- Seasonally, Winter (79 days avg.) sees the longest lead times, while Summer (14 days avg.) has the shortest, reflecting typical travel planning cycles.
Recommendations for Hosts
- Use the overall average lead time (61 days) as a baseline for your pricing and availability strategy in San Pablo Etla.
- For February stays, consider implementing length-of-stay discounts or slightly higher rates for bookings made less than 116 days out to capitalize on advance planning.
- During June, focus on last-minute booking availability and promotions, as guests book with very short notice (2 days avg.).
- Target marketing efforts for the Winter season well in advance (at least 79 days) to capture early planners.
- Monitor your own booking lead times against these San Pablo Etla averages to identify opportunities for dynamic pricing adjustments.
Popular & Essential Airbnb Amenities in San Pablo Etla (2025)
Amenity Prevalence
Amenity Insights for San Pablo Etla
- Essential amenities in San Pablo Etla that guests expect include: Wifi, Essentials. Lacking these (any) could significantly impact bookings.
- Popular amenities like Free parking on premises, Hot water, Kitchen are common but not universal. Offering these can provide a competitive edge.
Recommendations for Hosts
- Ensure your listing includes all essential amenities for San Pablo Etla: Wifi, Essentials.
- Consider adding popular differentiators like Free parking on premises or Hot water to increase appeal.
- Highlight unique or less common amenities you offer (e.g., hot tub, dedicated workspace, EV charger) in your listing description and photos.
- Regularly check competitor amenities in San Pablo Etla to stay competitive.
San Pablo Etla Airbnb Guest Demographics & Profile Analysis (2025)
Guest Profile Summary for San Pablo Etla
- The typical guest profile for Airbnb in San Pablo Etla consists of primarily domestic travelers (81%), often arriving from nearby Mexico City, typically belonging to the Post-2000s (Gen Z/Alpha) group (50%), primarily speaking Spanish or English.
- Domestic travelers account for 80.8% of guests.
- Key international markets include Mexico (80.8%) and United States (15.4%).
- Top languages spoken are Spanish (65.4%) followed by English (30.8%).
- A significant demographic segment is the Post-2000s (Gen Z/Alpha) group, representing 50% of guests.
Recommendations for Hosts
- Target domestic marketing efforts towards travelers from Mexico City and San Felipe de Jesús.
- Tailor amenities and listing descriptions to appeal to the dominant Post-2000s (Gen Z/Alpha) demographic (e.g., highlight fast WiFi, smart home features, local guides).
- Highlight unique local experiences or amenities relevant to the primary guest profile.
- Consider seasonal promotions aligned with peak travel times for key origin markets.
Nearby Short-Term Rental Market Comparison
How does the San Pablo Etla Airbnb market stack up against its neighbors? Compare key performance metrics like average monthly revenue, ADR, and occupancy rates in surrounding areas to understand the broader regional STR landscape.
| Market | Active Properties | Monthly Revenue | Daily Rate | Avg. Occupancy |
|---|---|---|---|---|
| Oaxaca City | 3,247 | $899 | $89.70 | 37% |
| Alvarado | 20 | $873 | $136.32 | 29% |
| San Francisco Tutla | 21 | $858 | $107.08 | 25% |
| San José del Pacífico | 86 | $786 | $105.96 | 27% |
| Paraje el Ciruelar | 12 | $658 | $124.68 | 32% |
| San Agustín Yatareni | 15 | $638 | $120.77 | 21% |
| Santa Cruz Etla | 25 | $590 | $115.09 | 25% |
| Tlalixtac de Cabrera | 42 | $586 | $95.83 | 23% |
| San Francisco Lachigoló | 16 | $565 | $86.48 | 22% |
| San Sebastián Río Hondo | 11 | $528 | $68.93 | 36% |