San Pedro Garza García Airbnb Market Analysis 2026: Short Term Rental Data & Vacation Rental Statistics in Nuevo León, Mexico
Is Airbnb profitable in San Pedro Garza García in 2026? Explore comprehensive Airbnb analytics for San Pedro Garza García, Nuevo León, Mexico to uncover income potential. This 2026 STR market report for San Pedro Garza García, based on AirROI data from February 2025 to January 2026, reveals key trends in the market of 392 active listings.
Whether you're considering an Airbnb investment in San Pedro Garza García, optimizing your existing vacation rental, or exploring rental arbitrage opportunities, understanding the San Pedro Garza García Airbnb data is crucial. Leveraging the low regulation environment is key to maximizing your short term rental income potential. Let's dive into the specifics.
Key San Pedro Garza García Airbnb Performance Metrics Overview
Monthly Airbnb Revenue Variations & Income Potential in San Pedro Garza García (2026)
Understanding the monthly revenue variations for Airbnb listings in San Pedro Garza García is key to maximizing your short term rental income potential. Seasonality significantly impacts earnings. Our analysis, based on data from the past 12 months, shows that the peak revenue month for STRs in San Pedro Garza García is typically December, while January often presents the lowest earnings, highlighting opportunities for strategic pricing adjustments during shoulder and low seasons. Explore the typical Airbnb income in San Pedro Garza García across different performance tiers:
- Best-in-class properties (Top 10%) achieve $3,242+ monthly, often utilizing dynamic pricing and superior guest experiences.
- Strong performing properties (Top 25%) earn $1,870 or more, indicating effective management and desirable locations/amenities.
- Typical properties (Median) generate around $928 per month, representing the average market performance.
- Entry-level properties (Bottom 25%) see earnings around $451, often with potential for optimization.
Average Monthly Airbnb Earnings Trend in San Pedro Garza García
San Pedro Garza García Airbnb Occupancy Rate Trends (2026)
Maximize your bookings by understanding the San Pedro Garza García STR occupancy trends. Seasonal demand shifts significantly influence how often properties are booked. Typically, Marchsees the highest demand (peak season occupancy), while January experiences the lowest (low season). Effective strategies, like adjusting minimum stays or offering promotions, can boost occupancy during slower periods. Here's how different property tiers perform in San Pedro Garza García:
- Best-in-class properties (Top 10%) achieve 79%+ occupancy, indicating high desirability and potentially optimized availability.
- Strong performing properties (Top 25%) maintain 65% or higher occupancy, suggesting good market fit and guest satisfaction.
- Typical properties (Median) have an occupancy rate around 43%.
- Entry-level properties (Bottom 25%) average 22% occupancy, potentially facing higher vacancy.
Average Monthly Occupancy Rate Trend in San Pedro Garza García
Average Daily Rate (ADR) Airbnb Trends in San Pedro Garza García (2026)
Effective short term rental pricing strategy in San Pedro Garza García involves understanding monthly ADR fluctuations. The Average Daily Rate (ADR) for Airbnb in San Pedro Garza García typically peaks in December and dips lowest during February. Leveraging Airbnb dynamic pricing tools or strategies based on this seasonality can significantly boost revenue. Here's a look at the typical nightly rates achieved:
- Best-in-class properties (Top 10%) command rates of $182+ per night, often due to premium features or locations.
- Strong performing properties (Top 25%) achieve nightly rates of $127 or more.
- Typical properties (Median) charge around $71 per night.
- Entry-level properties (Bottom 25%) earn around $49 per night.
Average Daily Rate (ADR) Trend by Month in San Pedro Garza García
Get Live San Pedro Garza García Market Intelligence 👇

Explore Real-time Analytics
Airbnb Seasonality Analysis & Trends in San Pedro Garza García (2026)
Peak Season (December, October, August)
- Revenue averages $1,597 per month
- Occupancy rates average 45.2%
- Daily rates average $107
Shoulder Season
- Revenue averages $1,463 per month
- Occupancy maintains around 45.2%
- Daily rates hold near $101
Low Season (January, February, May)
- Revenue drops to average $1,222 per month
- Occupancy decreases to average 40.8%
- Daily rates adjust to average $100
Seasonality Insights for San Pedro Garza García
- The Airbnb seasonality in San Pedro Garza García shows moderate seasonality with distinct peak and low periods. While the sections above show seasonal averages, it's also insightful to look at the extremes:
- During the high season, the absolute peak month showcases San Pedro Garza García's highest earning potential, with monthly revenues capable of climbing to $1,694, occupancy reaching a high of 51.4%, and ADRs peaking at $114.
- Conversely, the slowest single month of the year, typically falling within the low season, marks the market's lowest point. In this month, revenue might dip to $1,128, occupancy could drop to 32.2%, and ADRs may adjust down to $92.
- Understanding both the seasonal averages and these monthly peaks and troughs in revenue, occupancy, and ADR is crucial for maximizing your Airbnb profit potential in San Pedro Garza García.
Seasonal Strategies for Maximizing Profit
- Peak Season: Maximize revenue through premium pricing and potentially longer minimum stays. Ensure high availability.
- Low Season: Offer competitive pricing, special promotions (e.g., extended stay discounts), and flexible cancellation policies. Target off-season travelers like remote workers or budget-conscious guests.
- Shoulder Seasons: Implement dynamic pricing that balances peak and low rates. Target weekend travelers or specific events. Offer slightly more flexible terms than peak season.
- Regularly analyze your own performance against these San Pedro Garza García seasonality benchmarks and adjust your pricing and availability strategy accordingly.
Best Areas for Airbnb Investment in San Pedro Garza García (2026)
Exploring the top neighborhoods for short-term rentals in San Pedro Garza García? This section highlights key areas, outlining why they are attractive for hosts and guests, along with notable local attractions. Consider these locations based on your target guest profile and investment strategy.
| Neighborhood / Area | Why Host Here? (Target Guests & Appeal) | Key Attractions & Landmarks |
|---|---|---|
| Valle Oriente | A central business district known for its luxury shopping centers and proximity to hospitals and business hubs. Ideal for both business travelers and families. | Paseo San Pedro, Plaza Fiesta San Agustín, Bosque del Lobo, Parque del Paseo, Hospital San José |
| San Pedro Garza García Centro | The heart of San Pedro with a rich array of dining, shopping, and cultural experiences. A favorite among locals and tourists alike. | Catedral de San Pedro, Plaza de San Pedro, Museo de Arte Contemporáneo, Parque Rufino Tamayo, Paseo de las Artes |
| Los Alpes | An upscale residential area known for its tranquility and beautiful parks. Perfect for travelers seeking peace and nature close to the city. | Parque Ecológico Chipinque, Barranca del Huracán, Cumbres de Monterrey National Park, Cerro de la Silla |
| San Ángel | A picturesque neighborhood famous for its colonial architecture, art galleries, and galleries. Attracts travelers looking for culture and history. | El Parque de los Ríos, Plaza de los Ángeles, Cerro de Chipinque, Museo del Noreste |
| La Herradura | A quiet, upscale area primarily residential, with several parks and great views. Attractive for those wanting a peaceful retreat. | Parque de la Amistad, Parque La Herradura, Paseo de los Leones |
| Colonia del Valle | A vibrant neighborhood with a mix of restaurants, bars, and shops, popular with younger crowds and families. | Parque España, Parque de la Vista al Parque, Plaza La Isla, Cinépolis San Pedro |
| Rincón del Milagro | A secluded residential area providing tranquility and security, ideal for those looking for a long-term stay or escape from city life. | Parque Rincón del Milagro, Tierra de Sueños, Parque Ecológico |
| San Pedro 400 | A modern developments area appealing to tech-savvy guests with close proximity to offices, ideal for young professionals visiting for work. | Plaza San Pedro, Galerías Valle Oriente, Cafés and restaurants in the area |
Understanding Airbnb License Requirements & STR Laws in San Pedro Garza García (2026)
While San Pedro Garza García, Nuevo León, Mexico currently shows low STR regulations, specific Airbnb license requirements might still exist or change. Always verify the latest short term rental regulations and Airbnb license requirements directly with local government authorities for San Pedro Garza García to ensure full compliance before hosting.
(Source: AirROI data, 2026, finding no licensed listings among those analyzed)
Top Performing Airbnb Properties in San Pedro Garza García (2026)
Benchmark your potential! Explore examples of top-performing Airbnb properties in San Pedro Garza Garcíabased on Trailing Twelve Month (TTM) revenue. Analyze their characteristics, revenue, occupancy rate, and ADR to understand what drives success in this market.

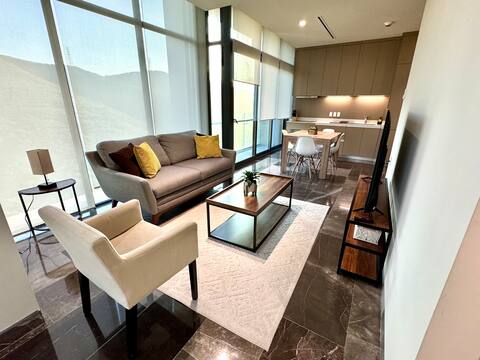
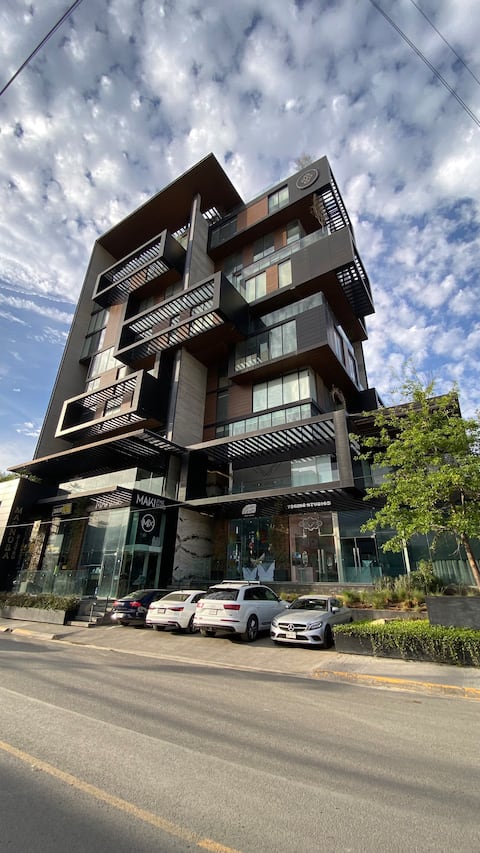
Prime Arboleda 2BD&2BA I Mtn views I Shops&Dining
Entire Place • 2 bedrooms

Gorgeous house w/ rooftop pool
Entire Place • 4 bedrooms

Exclusive 2BDR&2BA Prestige Arboleda
Entire Place • 2 bedrooms

Modern 2 King BD&2BA I Hospital I Views & Dining
Entire Place • 2 bedrooms
Luxury 2BD&2Bath~Next to Plaza~Hospital~Pool
Entire Place • 2 bedrooms
Magnificent PH 3BR @Centrito Valle | 12 guests
Entire Place • 3 bedrooms
Note: Performance varies based on location, size, amenities, seasonality, and management quality. Data reflects the past 12 months.
Top Performing Airbnb Hosts in San Pedro Garza García (2026)
Learn from the best! This table showcases top-performing Airbnb hosts in San Pedro Garza García based on the number of properties managed and estimated total revenue over the past year. Analyze their scale and performance metrics.
| Host Name | Properties | Grossing Revenue | Stay Reviews | Avg Rating |
|---|---|---|---|---|
| Iván | 17 | $485,775 | 1084 | 4.87/5.0 |
| Monica | 6 | $445,205 | 262 | 4.99/5.0 |
| Eva | 26 | $389,724 | 3005 | 4.68/5.0 |
| Beto | 4 | $211,103 | 408 | 4.97/5.0 |
| Alberto | 12 | $116,389 | 1084 | 4.68/5.0 |
| Javier | 3 | $106,973 | 533 | 4.88/5.0 |
| Adriana | 3 | $92,152 | 153 | 4.90/5.0 |
| Cinco Estrellas | 1 | $89,268 | 100 | 4.77/5.0 |
| Maria Teresa | 14 | $86,028 | 2698 | 4.73/5.0 |
| Ruby | 2 | $75,013 | 91 | 4.92/5.0 |
Analyzing the strategies of top hosts, such as their property selection, pricing, and guest communication, can offer valuable lessons for optimizing your own Airbnb operations in San Pedro Garza García.
Dive Deeper: Advanced San Pedro Garza García STR Market Data (2026)
Ready to unlock more insights? AirROI provides access to advanced metrics and comprehensive Airbnb data for San Pedro Garza García. Explore detailed analytics beyond this report to refine your investment strategy, optimize pricing, and maximize your vacation rental profits.
Explore Advanced MetricsSan Pedro Garza García Short-Term Rental Market Composition (2026): Property & Room Types
Room Type Distribution
Property Type Distribution
Market Composition Insights for San Pedro Garza García
- The San Pedro Garza García Airbnb market composition is heavily skewed towards Entire Home/Apt listings, which make up 79.1% of the 392 active rentals. This indicates strong guest preference for privacy and space.
- Looking at the property type distribution in San Pedro Garza García, Apartment/Condo properties are the most common (70.7%), reflecting the local real estate landscape.
- Houses represent a significant 21.4% portion, catering likely to families or larger groups.
- The presence of 5.4% Hotel/Boutique listings indicates integration with traditional hospitality.
- Smaller segments like others, outdoor/unique (combined 2.5%) offer potential for unique stay experiences.
San Pedro Garza García Airbnb Room Capacity Analysis (2026): Bedroom Distribution
Distribution of Listings by Number of Bedrooms
Room Capacity Insights for San Pedro Garza García
- The dominant room capacity in San Pedro Garza García is 1 bedroom listings, making up 51.3% of the market. This suggests a strong demand for properties suitable for couples or solo travelers.
- Together, 1 bedroom and 2 bedrooms properties represent 70.9% of the active Airbnb listings in San Pedro Garza García, indicating a high concentration in these sizes.
- With over half the market (51.3%) consisting of studios or 1-bedroom units, San Pedro Garza García is particularly well-suited for individuals or couples.
San Pedro Garza García Vacation Rental Guest Capacity Trends (2026)
Distribution of Listings by Guest Capacity
Guest Capacity Insights for San Pedro Garza García
- The most common guest capacity trend in San Pedro Garza García vacation rentals is listings accommodating 2 guests (36.2%). This suggests the primary traveler segment is likely couples or solo travelers.
- Properties designed for 2 guests and 4 guests dominate the San Pedro Garza García STR market, accounting for 49.5% of listings.
- 18.4% of properties accommodate 6+ guests, serving the market segment for larger families or group travel in San Pedro Garza García.
- On average, properties in San Pedro Garza García are equipped to host 3.1 guests.
San Pedro Garza García Airbnb Booking Patterns (2026): Available vs. Booked Days
Available Days Distribution
Booked Days Distribution
Booking Pattern Insights for San Pedro Garza García
- The most common availability pattern in San Pedro Garza García falls within the 271-366 days range, representing 42.3% of listings. This suggests many properties have significant open periods on their calendars.
- Approximately 75.7% of listings show high availability (181+ days open annually), indicating potential for increased bookings or specific owner usage patterns.
- For booked days, the 91-180 days range is most frequent in San Pedro Garza García (33.9%), reflecting common guest stay durations or potential owner blocking patterns.
- A notable 25.5% of properties secure long booking periods (181+ days booked per year), highlighting successful long-term rental strategies or significant owner usage.
San Pedro Garza García Airbnb Minimum Stay Requirements Analysis
Distribution of Listings by Minimum Night Requirement
1 Night
155 listings
39.5% of total
2 Nights
123 listings
31.4% of total
3 Nights
19 listings
4.8% of total
4-6 Nights
13 listings
3.3% of total
7-29 Nights
18 listings
4.6% of total
30+ Nights
64 listings
16.3% of total
Key Insights
- The most prevalent minimum stay requirement in San Pedro Garza García is 1 Night, adopted by 39.5% of listings. This highlights the market's preference for shorter, flexible bookings.
- A strong majority (70.9%) of the San Pedro Garza García Airbnb data shows acceptance of very short stays (1-2 nights), indicating a dynamic, high-turnover market.
- A significant segment (16.3%) caters to monthly stays (30+ nights) in San Pedro Garza García, pointing to opportunities in the extended-stay market.
Recommendations
- Align with the market by considering a 1 Night minimum stay, as 39.5% of San Pedro Garza García hosts use this setting.
- Explore offering discounts for stays of 30+ nights to attract the 16.3% of the market seeking extended stays.
- Adjust minimum nights based on seasonality – potentially shorter during low season and longer during peak demand periods in San Pedro Garza García.
San Pedro Garza García Airbnb Cancellation Policy Trends Analysis (2026)
Limited
1 listings
0.3% of total
Flexible
107 listings
27.3% of total
Moderate
137 listings
34.9% of total
Firm
108 listings
27.6% of total
Strict
39 listings
9.9% of total
Cancellation Policy Insights for San Pedro Garza García
- The prevailing Airbnb cancellation policy trend in San Pedro Garza García is Moderate, used by 34.9% of listings.
- There's a relatively balanced mix between guest-friendly (62.2%) and stricter (37.5%) policies, offering choices for different guest needs.
- Strict cancellation policies are quite rare (9.9%), potentially making listings with this policy less competitive unless justified by high demand or property type.
Recommendations for Hosts
- Consider adopting a Moderate policy to align with the 34.9% market standard in San Pedro Garza García.
- Using a Strict policy might deter some guests, as only 9.9% of listings use it. Evaluate if potential revenue protection outweighs possible lower booking rates.
- Regularly review your cancellation policy against competitors and market demand shifts in San Pedro Garza García.
San Pedro Garza García STR Booking Lead Time Analysis (2026)
Average Booking Lead Time by Month
Booking Lead Time Insights for San Pedro Garza García
- The overall average booking lead time for vacation rentals in San Pedro Garza García is 22 days.
- Guests book furthest in advance for stays during April (average 42 days), likely coinciding with peak travel demand or local events.
- The shortest booking windows occur for stays in February (average 12 days), indicating more last-minute travel plans during this time.
- Seasonally, Spring (26 days avg.) sees the longest lead times, while Winter (15 days avg.) has the shortest, reflecting typical travel planning cycles.
Recommendations for Hosts
- Use the overall average lead time (22 days) as a baseline for your pricing and availability strategy in San Pedro Garza García.
- For April stays, consider implementing length-of-stay discounts or slightly higher rates for bookings made less than 42 days out to capitalize on advance planning.
- During February, focus on last-minute booking availability and promotions, as guests book with very short notice (12 days avg.).
- Target marketing efforts for the Spring season well in advance (at least 26 days) to capture early planners.
- Monitor your own booking lead times against these San Pedro Garza García averages to identify opportunities for dynamic pricing adjustments.
Popular & Essential Airbnb Amenities in San Pedro Garza García (2026)
Amenity Prevalence
Amenity Insights for San Pedro Garza García
- Essential amenities in San Pedro Garza García that guests expect include: Air conditioning, Wifi. Lacking these (any) could significantly impact bookings.
- Popular amenities like Heating, TV, Hot water are common but not universal. Offering these can provide a competitive edge.
Recommendations for Hosts
- Ensure your listing includes all essential amenities for San Pedro Garza García: Air conditioning, Wifi.
- Prioritize adding missing essentials: Air conditioning, Wifi.
- Consider adding popular differentiators like Heating or TV to increase appeal.
- Highlight unique or less common amenities you offer (e.g., hot tub, dedicated workspace, EV charger) in your listing description and photos.
- Regularly check competitor amenities in San Pedro Garza García to stay competitive.
San Pedro Garza García Airbnb Guest Demographics & Profile Analysis (2026)
Guest Profile Summary for San Pedro Garza García
- The typical guest profile for Airbnb in San Pedro Garza García consists of primarily domestic travelers (72%), often arriving from nearby Mexico City, typically belonging to the Post-2000s (Gen Z/Alpha) group (50%), primarily speaking Spanish or English.
- Domestic travelers account for 71.9% of guests.
- Key international markets include Mexico (71.9%) and United States (21.2%).
- Top languages spoken are Spanish (48.5%) followed by English (40.1%).
- A significant demographic segment is the Post-2000s (Gen Z/Alpha) group, representing 50% of guests.
Recommendations for Hosts
- Target domestic marketing efforts towards travelers from Mexico City and Monterrey.
- Tailor amenities and listing descriptions to appeal to the dominant Post-2000s (Gen Z/Alpha) demographic (e.g., highlight fast WiFi, smart home features, local guides).
- Highlight unique local experiences or amenities relevant to the primary guest profile.
- Consider seasonal promotions aligned with peak travel times for key origin markets.
Nearby Short-Term Rental Market Comparison
How does the San Pedro Garza García Airbnb market stack up against its neighbors? Compare key performance metrics like average monthly revenue, ADR, and occupancy rates in surrounding areas to understand the broader regional STR landscape.
| Market | Active Properties | Monthly Revenue | Daily Rate | Avg. Occupancy |
|---|---|---|---|---|
| Bella Unión | 10 | $4,181 | $286.89 | 37% |
| El Cercado | 14 | $1,947 | $212.87 | 32% |
| Jame | 10 | $1,486 | $169.30 | 27% |
| General Zuazua | 20 | $1,472 | $277.59 | 26% |
| Mesa de tablas | 43 | $1,457 | $302.25 | 18% |
| Barrio de Huajuquito | 11 | $1,453 | $236.72 | 26% |
| Arteaga | 86 | $1,323 | $213.56 | 24% |
| San Antonio de Las Alazanas | 37 | $1,165 | $285.00 | 18% |
| Allende | 17 | $1,151 | $150.10 | 30% |
| Montemorelos | 21 | $1,148 | $183.07 | 26% |