La Cienega de Gonzalez Airbnb Market Analysis 2026: Short Term Rental Data & Vacation Rental Statistics in Nuevo León, Mexico
Is Airbnb profitable in La Cienega de Gonzalez in 2026? Explore comprehensive Airbnb analytics for La Cienega de Gonzalez, Nuevo León, Mexico to uncover income potential. This 2026 STR market report for La Cienega de Gonzalez, based on AirROI data from February 2025 to January 2026, reveals key trends in the niche market of 49 active listings.
Whether you're considering an Airbnb investment in La Cienega de Gonzalez, optimizing your existing vacation rental, or exploring rental arbitrage opportunities, understanding the La Cienega de Gonzalez Airbnb data is crucial. Leveraging the low regulation environment is key to maximizing your short term rental income potential. Let's dive into the specifics.
Key La Cienega de Gonzalez Airbnb Performance Metrics Overview
Monthly Airbnb Revenue Variations & Income Potential in La Cienega de Gonzalez (2026)
Understanding the monthly revenue variations for Airbnb listings in La Cienega de Gonzalez is key to maximizing your short term rental income potential. Seasonality significantly impacts earnings. Our analysis, based on data from the past 12 months, shows that the peak revenue month for STRs in La Cienega de Gonzalez is typically December, while May often presents the lowest earnings, highlighting opportunities for strategic pricing adjustments during shoulder and low seasons. Explore the typical Airbnb income in La Cienega de Gonzalez across different performance tiers:
- Best-in-class properties (Top 10%) achieve $2,731+ monthly, often utilizing dynamic pricing and superior guest experiences.
- Strong performing properties (Top 25%) earn $1,652 or more, indicating effective management and desirable locations/amenities.
- Typical properties (Median) generate around $918 per month, representing the average market performance.
- Entry-level properties (Bottom 25%) see earnings around $505, often with potential for optimization.
Average Monthly Airbnb Earnings Trend in La Cienega de Gonzalez
La Cienega de Gonzalez Airbnb Occupancy Rate Trends (2026)
Maximize your bookings by understanding the La Cienega de Gonzalez STR occupancy trends. Seasonal demand shifts significantly influence how often properties are booked. Typically, Augustsees the highest demand (peak season occupancy), while January experiences the lowest (low season). Effective strategies, like adjusting minimum stays or offering promotions, can boost occupancy during slower periods. Here's how different property tiers perform in La Cienega de Gonzalez:
- Best-in-class properties (Top 10%) achieve 49%+ occupancy, indicating high desirability and potentially optimized availability.
- Strong performing properties (Top 25%) maintain 29% or higher occupancy, suggesting good market fit and guest satisfaction.
- Typical properties (Median) have an occupancy rate around 17%.
- Entry-level properties (Bottom 25%) average 10% occupancy, potentially facing higher vacancy.
Average Monthly Occupancy Rate Trend in La Cienega de Gonzalez
Average Daily Rate (ADR) Airbnb Trends in La Cienega de Gonzalez (2026)
Effective short term rental pricing strategy in La Cienega de Gonzalez involves understanding monthly ADR fluctuations. The Average Daily Rate (ADR) for Airbnb in La Cienega de Gonzalez typically peaks in December and dips lowest during March. Leveraging Airbnb dynamic pricing tools or strategies based on this seasonality can significantly boost revenue. Here's a look at the typical nightly rates achieved:
- Best-in-class properties (Top 10%) command rates of $270+ per night, often due to premium features or locations.
- Strong performing properties (Top 25%) achieve nightly rates of $230 or more.
- Typical properties (Median) charge around $175 per night.
- Entry-level properties (Bottom 25%) earn around $135 per night.
Average Daily Rate (ADR) Trend by Month in La Cienega de Gonzalez
Get Live La Cienega de Gonzalez Market Intelligence 👇

Explore Real-time Analytics
Airbnb Seasonality Analysis & Trends in La Cienega de Gonzalez (2026)
Peak Season (December, August, July)
- Revenue averages $1,596 per month
- Occupancy rates average 27.0%
- Daily rates average $191
Shoulder Season
- Revenue averages $1,170 per month
- Occupancy maintains around 21.9%
- Daily rates hold near $185
Low Season (April, May, October)
- Revenue drops to average $967 per month
- Occupancy decreases to average 18.4%
- Daily rates adjust to average $182
Seasonality Insights for La Cienega de Gonzalez
- The Airbnb seasonality in La Cienega de Gonzalez shows highly seasonal trends requiring careful strategy. While the sections above show seasonal averages, it's also insightful to look at the extremes:
- During the high season, the absolute peak month showcases La Cienega de Gonzalez's highest earning potential, with monthly revenues capable of climbing to $2,117, occupancy reaching a high of 28.2%, and ADRs peaking at $216.
- Conversely, the slowest single month of the year, typically falling within the low season, marks the market's lowest point. In this month, revenue might dip to $895, occupancy could drop to 16.5%, and ADRs may adjust down to $169.
- Understanding both the seasonal averages and these monthly peaks and troughs in revenue, occupancy, and ADR is crucial for maximizing your Airbnb profit potential in La Cienega de Gonzalez.
Seasonal Strategies for Maximizing Profit
- Peak Season: Maximize revenue through premium pricing and potentially longer minimum stays. Ensure high availability.
- Low Season: Offer competitive pricing, special promotions (e.g., extended stay discounts), and flexible cancellation policies. Target off-season travelers like remote workers or budget-conscious guests.
- Shoulder Seasons: Implement dynamic pricing that balances peak and low rates. Target weekend travelers or specific events. Offer slightly more flexible terms than peak season.
- Regularly analyze your own performance against these La Cienega de Gonzalez seasonality benchmarks and adjust your pricing and availability strategy accordingly.
Best Areas for Airbnb Investment in La Cienega de Gonzalez (2026)
Exploring the top neighborhoods for short-term rentals in La Cienega de Gonzalez? This section highlights key areas, outlining why they are attractive for hosts and guests, along with notable local attractions. Consider these locations based on your target guest profile and investment strategy.
| Neighborhood / Area | Why Host Here? (Target Guests & Appeal) | Key Attractions & Landmarks |
|---|---|---|
| La Cienega de Gonzalez Central | Main area with easy access to local shops and restaurants, making it convenient for visitors. It's a vibrant spot for those looking to experience local culture with amenities nearby. | Parque de la Cultura, Local dining spots, Artisan markets, Cultural festivals, Scenic walking paths |
| Rural Retreats | Surrounding countryside offering a tranquil escape from the city with beautiful landscapes. Ideal for guests seeking nature, hiking, and a peaceful environment. | Hiking trails, Scenic viewpoints, Local wildlife, Nature reserves, Agricultural experiences |
| Cultural Zone | Home to several cultural institutions and historic sites, attracting tourists interested in the rich heritage of the region. | Museo de Historia, Historical architecture, Local performing arts, Cultural events, Galleries showcasing local artists |
| Family-Friendly Areas | Neighborhoods that cater to families with attractions like parks, playgrounds, and family-oriented activities. | Community parks, Playgrounds, Family dining options, Family-oriented events, Local schools and educational venues |
| Craft Brewery District | Emerging area focused on breweries and local craft drinks, appealing to tourists looking for unique food and drink experiences. | Local craft breweries, Tasting rooms, Brewery tours, Food trucks, Artisan markets |
| Outdoor Adventure Hub | Great access to outdoor activities such as hiking, biking, and other adventure sports. Attracts thrill-seekers and outdoor enthusiasts. | Mountain biking trails, Rock climbing sites, Kayaking spots, Fishing areas, Nature trails |
| Market District | A bustling area known for local markets and shops, providing an authentic shopping experience for visitors. | Local markets, Street food stalls, Artisan shops, Cultural fairs, Traditional crafts |
| Historical District | Rich in history with preserved architecture and monuments, this area attracts history buffs and tourists interested in the past. | Historical landmarks, Guided tours, Cultural exhibits, Old town charm, Heritage walks |
Understanding Airbnb License Requirements & STR Laws in La Cienega de Gonzalez (2026)
While La Cienega de Gonzalez, Nuevo León, Mexico currently shows low STR regulations, specific Airbnb license requirements might still exist or change. Always verify the latest short term rental regulations and Airbnb license requirements directly with local government authorities for La Cienega de Gonzalez to ensure full compliance before hosting.
(Source: AirROI data, 2026, based on 2% licensed listings)
Top Performing Airbnb Properties in La Cienega de Gonzalez (2026)
Benchmark your potential! Explore examples of top-performing Airbnb properties in La Cienega de Gonzalezbased on Trailing Twelve Month (TTM) revenue. Analyze their characteristics, revenue, occupancy rate, and ADR to understand what drives success in this market.

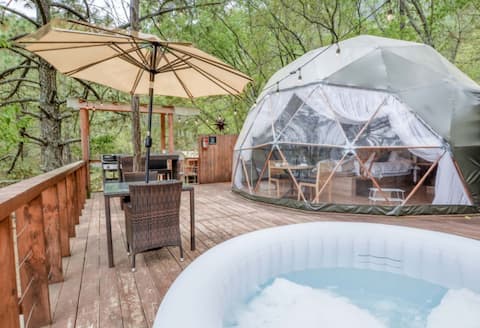
Incredible Dome, Perfect for a Romantic Getaway
Entire Place • 1 bedroom

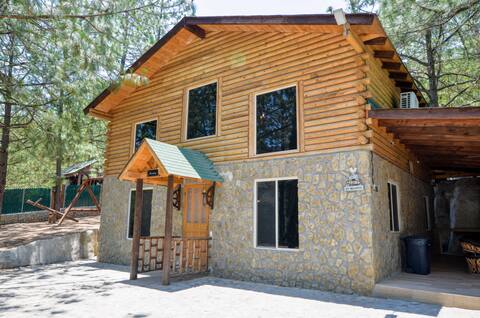
VILLA AMADA. Adobe cabin
Entire Place • 3 bedrooms
Comet Cabin / ideal for friends and family
Entire Place • 3 bedrooms
Constelation Cabin / for big groups, 18 people
Entire Place • 2 bedrooms

Maria Luisa Cabins
Entire Place • 3 bedrooms
Incredible Dome, Perfect for a Romantic Getaway
Entire Place • 1 bedroom
Note: Performance varies based on location, size, amenities, seasonality, and management quality. Data reflects the past 12 months.
Top Performing Airbnb Hosts in La Cienega de Gonzalez (2026)
Learn from the best! This table showcases top-performing Airbnb hosts in La Cienega de Gonzalez based on the number of properties managed and estimated total revenue over the past year. Analyze their scale and performance metrics.
| Host Name | Properties | Grossing Revenue | Stay Reviews | Avg Rating |
|---|---|---|---|---|
| Anfitrip | 13 | $201,722 | 171 | 4.79/5.0 |
| Carlos | 6 | $58,863 | 352 | 4.89/5.0 |
| Ramon | 2 | $38,963 | 106 | 4.72/5.0 |
| Abraham | 2 | $35,005 | 102 | 4.71/5.0 |
| Mauricio | 3 | $27,070 | 16 | 4.75/5.0 |
| Yadira | 3 | $18,667 | 90 | 4.67/5.0 |
| Maricruz | 3 | $18,207 | 300 | 4.97/5.0 |
| Raúl | 2 | $17,936 | 54 | 4.95/5.0 |
| Nadia | 2 | $17,153 | 17 | 5.00/5.0 |
| Hernan | 1 | $14,458 | 139 | 4.91/5.0 |
Analyzing the strategies of top hosts, such as their property selection, pricing, and guest communication, can offer valuable lessons for optimizing your own Airbnb operations in La Cienega de Gonzalez.
Dive Deeper: Advanced La Cienega de Gonzalez STR Market Data (2026)
Ready to unlock more insights? AirROI provides access to advanced metrics and comprehensive Airbnb data for La Cienega de Gonzalez. Explore detailed analytics beyond this report to refine your investment strategy, optimize pricing, and maximize your vacation rental profits.
Explore Advanced MetricsLa Cienega de Gonzalez Short-Term Rental Market Composition (2026): Property & Room Types
Room Type Distribution
Property Type Distribution
Market Composition Insights for La Cienega de Gonzalez
- The La Cienega de Gonzalez Airbnb market composition is heavily skewed towards Entire Home/Apt listings, which make up 100% of the 49 active rentals. This indicates strong guest preference for privacy and space.
- Looking at the property type distribution in La Cienega de Gonzalez, Outdoor/Unique properties are the most common (79.6%), reflecting the local real estate landscape.
La Cienega de Gonzalez Airbnb Room Capacity Analysis (2026): Bedroom Distribution
Distribution of Listings by Number of Bedrooms
Room Capacity Insights for La Cienega de Gonzalez
- The dominant room capacity in La Cienega de Gonzalez is 1 bedroom listings, making up 36.7% of the market. This suggests a strong demand for properties suitable for couples or solo travelers.
- Together, 1 bedroom and 3 bedrooms properties represent 65.3% of the active Airbnb listings in La Cienega de Gonzalez, indicating a high concentration in these sizes.
- A significant 36.8% of listings offer 3+ bedrooms, catering to larger groups and families seeking more space in La Cienega de Gonzalez.
La Cienega de Gonzalez Vacation Rental Guest Capacity Trends (2026)
Distribution of Listings by Guest Capacity
Guest Capacity Insights for La Cienega de Gonzalez
- The most common guest capacity trend in La Cienega de Gonzalez vacation rentals is listings accommodating 8+ guests (44.9%). This suggests the primary traveler segment is likely larger groups.
- Properties designed for 8+ guests and 2 guests dominate the La Cienega de Gonzalez STR market, accounting for 63.3% of listings.
- 61.3% of properties accommodate 6+ guests, serving the market segment for larger families or group travel in La Cienega de Gonzalez.
- On average, properties in La Cienega de Gonzalez are equipped to host 5.8 guests.
La Cienega de Gonzalez Airbnb Booking Patterns (2026): Available vs. Booked Days
Available Days Distribution
Booked Days Distribution
Booking Pattern Insights for La Cienega de Gonzalez
- The most common availability pattern in La Cienega de Gonzalez falls within the 271-366 days range, representing 79.6% of listings. This suggests many properties have significant open periods on their calendars.
- Approximately 100.0% of listings show high availability (181+ days open annually), indicating potential for increased bookings or specific owner usage patterns.
- For booked days, the 31-90 days range is most frequent in La Cienega de Gonzalez (46.9%), reflecting common guest stay durations or potential owner blocking patterns.
- A notable 2.0% of properties secure long booking periods (181+ days booked per year), highlighting successful long-term rental strategies or significant owner usage.
La Cienega de Gonzalez Airbnb Minimum Stay Requirements Analysis
Distribution of Listings by Minimum Night Requirement
1 Night
40 listings
81.6% of total
2 Nights
2 listings
4.1% of total
30+ Nights
7 listings
14.3% of total
Key Insights
- The most prevalent minimum stay requirement in La Cienega de Gonzalez is 1 Night, adopted by 81.6% of listings. This highlights the market's preference for shorter, flexible bookings.
- A strong majority (85.7%) of the La Cienega de Gonzalez Airbnb data shows acceptance of very short stays (1-2 nights), indicating a dynamic, high-turnover market.
- A significant segment (14.3%) caters to monthly stays (30+ nights) in La Cienega de Gonzalez, pointing to opportunities in the extended-stay market.
Recommendations
- Align with the market by considering a 1 Night minimum stay, as 81.6% of La Cienega de Gonzalez hosts use this setting.
- Explore offering discounts for stays of 30+ nights to attract the 14.3% of the market seeking extended stays.
- Adjust minimum nights based on seasonality – potentially shorter during low season and longer during peak demand periods in La Cienega de Gonzalez.
La Cienega de Gonzalez Airbnb Cancellation Policy Trends Analysis (2026)
Limited
1 listings
2% of total
Super Strict 60 Days
13 listings
26.5% of total
Flexible
8 listings
16.3% of total
Moderate
13 listings
26.5% of total
Firm
11 listings
22.4% of total
Strict
3 listings
6.1% of total
Cancellation Policy Insights for La Cienega de Gonzalez
- The prevailing Airbnb cancellation policy trend in La Cienega de Gonzalez is Super Strict 60 Days, used by 26.5% of listings.
- There's a relatively balanced mix between guest-friendly (42.8%) and stricter (28.5%) policies, offering choices for different guest needs.
- Strict cancellation policies are quite rare (6.1%), potentially making listings with this policy less competitive unless justified by high demand or property type.
Recommendations for Hosts
- Consider adopting a Super Strict 60 Days policy to align with the 26.5% market standard in La Cienega de Gonzalez.
- Using a Strict policy might deter some guests, as only 6.1% of listings use it. Evaluate if potential revenue protection outweighs possible lower booking rates.
- Regularly review your cancellation policy against competitors and market demand shifts in La Cienega de Gonzalez.
La Cienega de Gonzalez STR Booking Lead Time Analysis (2026)
Average Booking Lead Time by Month
Booking Lead Time Insights for La Cienega de Gonzalez
- The overall average booking lead time for vacation rentals in La Cienega de Gonzalez is 25 days.
- Guests book furthest in advance for stays during April (average 40 days), likely coinciding with peak travel demand or local events.
- The shortest booking windows occur for stays in June (average 15 days), indicating more last-minute travel plans during this time.
- Seasonally, Winter (25 days avg.) sees the longest lead times, while Summer (22 days avg.) has the shortest, reflecting typical travel planning cycles.
Recommendations for Hosts
- Use the overall average lead time (25 days) as a baseline for your pricing and availability strategy in La Cienega de Gonzalez.
- For April stays, consider implementing length-of-stay discounts or slightly higher rates for bookings made less than 40 days out to capitalize on advance planning.
- Target marketing efforts for the Winter season well in advance (at least 25 days) to capture early planners.
- Monitor your own booking lead times against these La Cienega de Gonzalez averages to identify opportunities for dynamic pricing adjustments.
Popular & Essential Airbnb Amenities in La Cienega de Gonzalez (2026)
Amenity Prevalence
Amenity Insights for La Cienega de Gonzalez
- Essential amenities in La Cienega de Gonzalez that guests expect include: Free parking on premises. Lacking these (this) could significantly impact bookings.
- Popular amenities like Kitchen, BBQ grill, Wifi are common but not universal. Offering these can provide a competitive edge.
- Warning: Wifi is not universally provided but is considered essential globally. Ensure reliable Wifi is offered.
Recommendations for Hosts
- Ensure your listing includes all essential amenities for La Cienega de Gonzalez: Free parking on premises.
- Prioritize adding missing essentials: Free parking on premises.
- Consider adding popular differentiators like Kitchen or BBQ grill to increase appeal.
- Highlight unique or less common amenities you offer (e.g., hot tub, dedicated workspace, EV charger) in your listing description and photos.
- Regularly check competitor amenities in La Cienega de Gonzalez to stay competitive.
La Cienega de Gonzalez Airbnb Guest Demographics & Profile Analysis (2026)
Guest Profile Summary for La Cienega de Gonzalez
- The typical guest profile for Airbnb in La Cienega de Gonzalez consists of primarily domestic travelers (91%), often arriving from nearby Monterrey, typically belonging to the Post-2000s (Gen Z/Alpha) group (50%), primarily speaking Spanish or English.
- Domestic travelers account for 91.4% of guests.
- Key international markets include Mexico (91.4%) and United States (5.8%).
- Top languages spoken are Spanish (48.8%) followed by English (41.1%).
- A significant demographic segment is the Post-2000s (Gen Z/Alpha) group, representing 50% of guests.
Recommendations for Hosts
- Target domestic marketing efforts towards travelers from Monterrey and San Nicolás de los Garza.
- Tailor amenities and listing descriptions to appeal to the dominant Post-2000s (Gen Z/Alpha) demographic (e.g., highlight fast WiFi, smart home features, local guides).
- Highlight unique local experiences or amenities relevant to the primary guest profile.
- Consider seasonal promotions aligned with peak travel times for key origin markets.
Nearby Short-Term Rental Market Comparison
How does the La Cienega de Gonzalez Airbnb market stack up against its neighbors? Compare key performance metrics like average monthly revenue, ADR, and occupancy rates in surrounding areas to understand the broader regional STR landscape.
| Market | Active Properties | Monthly Revenue | Daily Rate | Avg. Occupancy |
|---|---|---|---|---|
| Bella Unión | 10 | $4,181 | $286.89 | 37% |
| El Cercado | 14 | $1,947 | $212.87 | 32% |
| Jame | 10 | $1,486 | $169.30 | 27% |
| General Zuazua | 20 | $1,472 | $277.59 | 26% |
| Mesa de tablas | 43 | $1,457 | $302.25 | 18% |
| Barrio de Huajuquito | 11 | $1,453 | $236.72 | 26% |
| Arteaga | 86 | $1,323 | $213.56 | 24% |
| San Antonio de Las Alazanas | 37 | $1,165 | $285.00 | 18% |
| Allende | 17 | $1,151 | $150.10 | 30% |
| Montemorelos | 21 | $1,148 | $183.07 | 26% |