Guadalupe Airbnb Market Analysis 2026: Short Term Rental Data & Vacation Rental Statistics in Nuevo León, Mexico
Is Airbnb profitable in Guadalupe in 2026? Explore comprehensive Airbnb analytics for Guadalupe, Nuevo León, Mexico to uncover income potential. This 2026 STR market report for Guadalupe, based on AirROI data from February 2025 to January 2026, reveals key trends in the market of 453 active listings.
Whether you're considering an Airbnb investment in Guadalupe, optimizing your existing vacation rental, or exploring rental arbitrage opportunities, understanding the Guadalupe Airbnb data is crucial. Leveraging the low regulation environment is key to maximizing your short term rental income potential. Let's dive into the specifics.
Key Guadalupe Airbnb Performance Metrics Overview
Monthly Airbnb Revenue Variations & Income Potential in Guadalupe (2026)
Understanding the monthly revenue variations for Airbnb listings in Guadalupe is key to maximizing your short term rental income potential. Seasonality significantly impacts earnings. Our analysis, based on data from the past 12 months, shows that the peak revenue month for STRs in Guadalupe is typically April, while January often presents the lowest earnings, highlighting opportunities for strategic pricing adjustments during shoulder and low seasons. Explore the typical Airbnb income in Guadalupe across different performance tiers:
- Best-in-class properties (Top 10%) achieve $1,527+ monthly, often utilizing dynamic pricing and superior guest experiences.
- Strong performing properties (Top 25%) earn $922 or more, indicating effective management and desirable locations/amenities.
- Typical properties (Median) generate around $510 per month, representing the average market performance.
- Entry-level properties (Bottom 25%) see earnings around $230, often with potential for optimization.
Average Monthly Airbnb Earnings Trend in Guadalupe
Guadalupe Airbnb Occupancy Rate Trends (2026)
Maximize your bookings by understanding the Guadalupe STR occupancy trends. Seasonal demand shifts significantly influence how often properties are booked. Typically, Februarysees the highest demand (peak season occupancy), while January experiences the lowest (low season). Effective strategies, like adjusting minimum stays or offering promotions, can boost occupancy during slower periods. Here's how different property tiers perform in Guadalupe:
- Best-in-class properties (Top 10%) achieve 76%+ occupancy, indicating high desirability and potentially optimized availability.
- Strong performing properties (Top 25%) maintain 59% or higher occupancy, suggesting good market fit and guest satisfaction.
- Typical properties (Median) have an occupancy rate around 35%.
- Entry-level properties (Bottom 25%) average 16% occupancy, potentially facing higher vacancy.
Average Monthly Occupancy Rate Trend in Guadalupe
Average Daily Rate (ADR) Airbnb Trends in Guadalupe (2026)
Effective short term rental pricing strategy in Guadalupe involves understanding monthly ADR fluctuations. The Average Daily Rate (ADR) for Airbnb in Guadalupe typically peaks in November and dips lowest during February. Leveraging Airbnb dynamic pricing tools or strategies based on this seasonality can significantly boost revenue. Here's a look at the typical nightly rates achieved:
- Best-in-class properties (Top 10%) command rates of $100+ per night, often due to premium features or locations.
- Strong performing properties (Top 25%) achieve nightly rates of $71 or more.
- Typical properties (Median) charge around $48 per night.
- Entry-level properties (Bottom 25%) earn around $33 per night.
Average Daily Rate (ADR) Trend by Month in Guadalupe
Get Live Guadalupe Market Intelligence 👇

Explore Real-time Analytics
Airbnb Seasonality Analysis & Trends in Guadalupe (2026)
Peak Season (April, July, December)
- Revenue averages $832 per month
- Occupancy rates average 40.8%
- Daily rates average $61
Shoulder Season
- Revenue averages $736 per month
- Occupancy maintains around 38.9%
- Daily rates hold near $60
Low Season (January, February, May)
- Revenue drops to average $582 per month
- Occupancy decreases to average 36.3%
- Daily rates adjust to average $56
Seasonality Insights for Guadalupe
- The Airbnb seasonality in Guadalupe shows moderate seasonality with distinct peak and low periods. While the sections above show seasonal averages, it's also insightful to look at the extremes:
- During the high season, the absolute peak month showcases Guadalupe's highest earning potential, with monthly revenues capable of climbing to $840, occupancy reaching a high of 44.6%, and ADRs peaking at $69.
- Conversely, the slowest single month of the year, typically falling within the low season, marks the market's lowest point. In this month, revenue might dip to $531, occupancy could drop to 28.1%, and ADRs may adjust down to $51.
- Understanding both the seasonal averages and these monthly peaks and troughs in revenue, occupancy, and ADR is crucial for maximizing your Airbnb profit potential in Guadalupe.
Seasonal Strategies for Maximizing Profit
- Peak Season: Maximize revenue through premium pricing and potentially longer minimum stays. Ensure high availability.
- Low Season: Offer competitive pricing, special promotions (e.g., extended stay discounts), and flexible cancellation policies. Target off-season travelers like remote workers or budget-conscious guests.
- Shoulder Seasons: Implement dynamic pricing that balances peak and low rates. Target weekend travelers or specific events. Offer slightly more flexible terms than peak season.
- Regularly analyze your own performance against these Guadalupe seasonality benchmarks and adjust your pricing and availability strategy accordingly.
Best Areas for Airbnb Investment in Guadalupe (2026)
Exploring the top neighborhoods for short-term rentals in Guadalupe? This section highlights key areas, outlining why they are attractive for hosts and guests, along with notable local attractions. Consider these locations based on your target guest profile and investment strategy.
| Neighborhood / Area | Why Host Here? (Target Guests & Appeal) | Key Attractions & Landmarks |
|---|---|---|
| Monterrey Centro | The vibrant heart of Monterrey with a mix of culture, history, and modern attractions. Ideal for travelers wanting to explore the city's rich history and vibrant nightlife. | Macroplaza, Palacio de Gobierno, Museo de Historia Mexicana, Cerro de la Silla, Plaza Mexico, Catedral Metropolitana |
| San Pedro Garza García | An upscale suburban area known for its luxury living, business centers, and shopping. Popular among affluent tourists and business travelers. | Paseo San Pedro, Parque Rufino Tamayo, Museo del Norte, Santa Lucía Riverwalk, Torre Valle Oriente |
| Cumbres | A popular residential area with family-friendly attractions and parks. Great for guests looking for a quieter, suburban experience in Monterrey. | Parque Cumbres, Plaza Cumbres, Parque Ecológico Chipinque, Cumbres de Monterrey National Park |
| Barrio Antiguo | Monterrey's historic district filled with charming streets, art galleries, and nightlife. Perfect for tourists looking to experience the culture and art scene. | Basilica de Guadalupe, Museo de Arte Contemporáneo, Plaza Enrique Santos, Callejón del Burro, Casa de la Lectura |
| Valle Oriente | An important commercial area known for its shopping and dining options. Attracts both tourists and business travelers. | Plaza Fiesta San Agustín, Galerías Monterrey, Parque de La Pastora, Cinemex |
| Los Huertos | A trendy and youthful suburb with a vibrant atmosphere, popular among young professionals and students. | Parque La Huasteca, Cafés and bars, Cineteca Nuevo León, Universidad de Monterrey |
| Santa Catarina | A significant area for outdoor activities, suitable for guests who enjoy nature and adventure sports. | Cerro de las Mitras, Parque Nacional Cumbres de Monterrey, La Huasteca, Explanada Santa Catarina |
| Apodaca | A growing area close to the airport and industrial parks, ideal for business-related stays. | Parque Apodaca, Estadio de Fútbol, Hospitales, Cinepolis |
Understanding Airbnb License Requirements & STR Laws in Guadalupe (2026)
While Guadalupe, Nuevo León, Mexico currently shows low STR regulations, specific Airbnb license requirements might still exist or change. Always verify the latest short term rental regulations and Airbnb license requirements directly with local government authorities for Guadalupe to ensure full compliance before hosting.
(Source: AirROI data, 2026, based on 0% licensed listings)
Top Performing Airbnb Properties in Guadalupe (2026)
Benchmark your potential! Explore examples of top-performing Airbnb properties in Guadalupebased on Trailing Twelve Month (TTM) revenue. Analyze their characteristics, revenue, occupancy rate, and ADR to understand what drives success in this market.
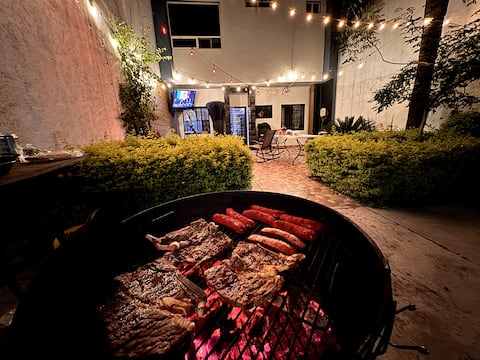
BBQ space, near BBVA, 6 guest house
Entire Place • 1 bedroom
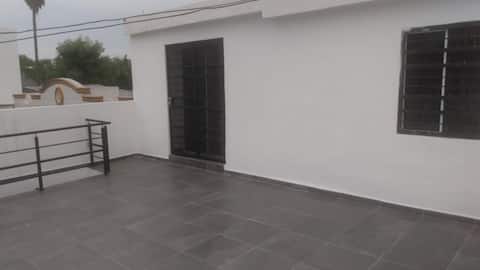
Loft in Guadalupe
Entire Place • 1 bedroom

Beautiful apartments with a pool/25min airport.
Entire Place • 7 bedrooms
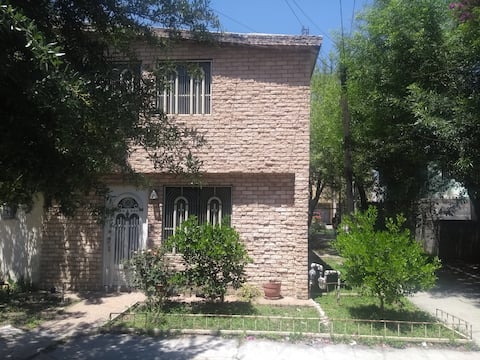
Apartment in Guadalupe
Entire Place • 2 bedrooms
Accommodation in the Airport area
Entire Place • 4 bedrooms
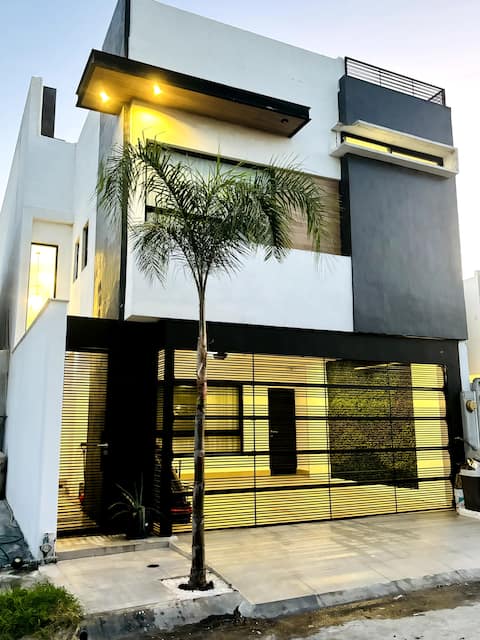
Villa Los Panales - An escape into the city.
Entire Place • 3 bedrooms
Note: Performance varies based on location, size, amenities, seasonality, and management quality. Data reflects the past 12 months.
Top Performing Airbnb Hosts in Guadalupe (2026)
Learn from the best! This table showcases top-performing Airbnb hosts in Guadalupe based on the number of properties managed and estimated total revenue over the past year. Analyze their scale and performance metrics.
| Host Name | Properties | Grossing Revenue | Stay Reviews | Avg Rating |
|---|---|---|---|---|
| María Elena | 20 | $167,939 | 1142 | 4.72/5.0 |
| Rene | 2 | $112,101 | 430 | 4.56/5.0 |
| Jorge | 9 | $91,428 | 1136 | 4.82/5.0 |
| BoHo Studio Haus | 12 | $88,831 | 298 | 4.86/5.0 |
| Elizabeth | 13 | $81,475 | 627 | 4.62/5.0 |
| Quirino | 10 | $73,097 | 817 | 4.62/5.0 |
| Daniel | 1 | $71,576 | 24 | 5.00/5.0 |
| Gabriela Lucia | 4 | $64,295 | 699 | 4.82/5.0 |
| Jonathan | 4 | $45,042 | 343 | 4.84/5.0 |
| Jacqueline | 4 | $41,051 | 177 | 4.87/5.0 |
Analyzing the strategies of top hosts, such as their property selection, pricing, and guest communication, can offer valuable lessons for optimizing your own Airbnb operations in Guadalupe.
Dive Deeper: Advanced Guadalupe STR Market Data (2026)
Ready to unlock more insights? AirROI provides access to advanced metrics and comprehensive Airbnb data for Guadalupe. Explore detailed analytics beyond this report to refine your investment strategy, optimize pricing, and maximize your vacation rental profits.
Explore Advanced MetricsGuadalupe Short-Term Rental Market Composition (2026): Property & Room Types
Room Type Distribution
Property Type Distribution
Market Composition Insights for Guadalupe
- The Guadalupe Airbnb market composition is heavily skewed towards Entire Home/Apt listings, which make up 70.4% of the 453 active rentals. This indicates strong guest preference for privacy and space.
- Looking at the property type distribution in Guadalupe, Apartment/Condo properties are the most common (55.2%), reflecting the local real estate landscape.
- Houses represent a significant 39.1% portion, catering likely to families or larger groups.
- Smaller segments like hotel/boutique, others, outdoor/unique (combined 5.7%) offer potential for unique stay experiences.
Guadalupe Airbnb Room Capacity Analysis (2026): Bedroom Distribution
Distribution of Listings by Number of Bedrooms
Room Capacity Insights for Guadalupe
- The dominant room capacity in Guadalupe is 1 bedroom listings, making up 34.7% of the market. This suggests a strong demand for properties suitable for couples or solo travelers.
- Together, 1 bedroom and 2 bedrooms properties represent 58.5% of the active Airbnb listings in Guadalupe, indicating a high concentration in these sizes.
Guadalupe Vacation Rental Guest Capacity Trends (2026)
Distribution of Listings by Guest Capacity
Guest Capacity Insights for Guadalupe
- The most common guest capacity trend in Guadalupe vacation rentals is listings accommodating 4 guests (16.8%). This suggests the primary traveler segment is likely small families or groups.
- Properties designed for 4 guests and 6 guests dominate the Guadalupe STR market, accounting for 32.3% of listings.
- 30.5% of properties accommodate 6+ guests, serving the market segment for larger families or group travel in Guadalupe.
- On average, properties in Guadalupe are equipped to host 3.7 guests.
Guadalupe Airbnb Booking Patterns (2026): Available vs. Booked Days
Available Days Distribution
Booked Days Distribution
Booking Pattern Insights for Guadalupe
- The most common availability pattern in Guadalupe falls within the 271-366 days range, representing 50.6% of listings. This suggests many properties have significant open periods on their calendars.
- Approximately 84.8% of listings show high availability (181+ days open annually), indicating potential for increased bookings or specific owner usage patterns.
- For booked days, the 91-180 days range is most frequent in Guadalupe (35.1%), reflecting common guest stay durations or potential owner blocking patterns.
- A notable 16.5% of properties secure long booking periods (181+ days booked per year), highlighting successful long-term rental strategies or significant owner usage.
Guadalupe Airbnb Minimum Stay Requirements Analysis
Distribution of Listings by Minimum Night Requirement
1 Night
238 listings
52.5% of total
2 Nights
102 listings
22.5% of total
3 Nights
18 listings
4% of total
4-6 Nights
7 listings
1.5% of total
7-29 Nights
12 listings
2.6% of total
30+ Nights
76 listings
16.8% of total
Key Insights
- The most prevalent minimum stay requirement in Guadalupe is 1 Night, adopted by 52.5% of listings. This highlights the market's preference for shorter, flexible bookings.
- A strong majority (75.0%) of the Guadalupe Airbnb data shows acceptance of very short stays (1-2 nights), indicating a dynamic, high-turnover market.
- A significant segment (16.8%) caters to monthly stays (30+ nights) in Guadalupe, pointing to opportunities in the extended-stay market.
Recommendations
- Align with the market by considering a 1 Night minimum stay, as 52.5% of Guadalupe hosts use this setting.
- Explore offering discounts for stays of 30+ nights to attract the 16.8% of the market seeking extended stays.
- Adjust minimum nights based on seasonality – potentially shorter during low season and longer during peak demand periods in Guadalupe.
Guadalupe Airbnb Cancellation Policy Trends Analysis (2026)
Limited
25 listings
5.5% of total
Flexible
188 listings
41.6% of total
Moderate
99 listings
21.9% of total
Firm
99 listings
21.9% of total
Strict
41 listings
9.1% of total
Cancellation Policy Insights for Guadalupe
- The prevailing Airbnb cancellation policy trend in Guadalupe is Flexible, used by 41.6% of listings.
- There's a relatively balanced mix between guest-friendly (63.5%) and stricter (31.0%) policies, offering choices for different guest needs.
- Strict cancellation policies are quite rare (9.1%), potentially making listings with this policy less competitive unless justified by high demand or property type.
Recommendations for Hosts
- Consider adopting a Flexible policy to align with the 41.6% market standard in Guadalupe.
- Using a Strict policy might deter some guests, as only 9.1% of listings use it. Evaluate if potential revenue protection outweighs possible lower booking rates.
- Regularly review your cancellation policy against competitors and market demand shifts in Guadalupe.
Guadalupe STR Booking Lead Time Analysis (2026)
Average Booking Lead Time by Month
Booking Lead Time Insights for Guadalupe
- The overall average booking lead time for vacation rentals in Guadalupe is 24 days.
- Guests book furthest in advance for stays during April (average 55 days), likely coinciding with peak travel demand or local events.
- The shortest booking windows occur for stays in January (average 10 days), indicating more last-minute travel plans during this time.
- Seasonally, Spring (31 days avg.) sees the longest lead times, while Winter (12 days avg.) has the shortest, reflecting typical travel planning cycles.
Recommendations for Hosts
- Use the overall average lead time (24 days) as a baseline for your pricing and availability strategy in Guadalupe.
- For April stays, consider implementing length-of-stay discounts or slightly higher rates for bookings made less than 55 days out to capitalize on advance planning.
- During January, focus on last-minute booking availability and promotions, as guests book with very short notice (10 days avg.).
- Target marketing efforts for the Spring season well in advance (at least 31 days) to capture early planners.
- Monitor your own booking lead times against these Guadalupe averages to identify opportunities for dynamic pricing adjustments.
Popular & Essential Airbnb Amenities in Guadalupe (2026)
Amenity Prevalence
Amenity Insights for Guadalupe
- Essential amenities in Guadalupe that guests expect include: Wifi, Air conditioning. Lacking these (any) could significantly impact bookings.
- Popular amenities like TV, Kitchen, Hot water are common but not universal. Offering these can provide a competitive edge.
Recommendations for Hosts
- Ensure your listing includes all essential amenities for Guadalupe: Wifi, Air conditioning.
- Prioritize adding missing essentials: Wifi, Air conditioning.
- Consider adding popular differentiators like TV or Kitchen to increase appeal.
- Highlight unique or less common amenities you offer (e.g., hot tub, dedicated workspace, EV charger) in your listing description and photos.
- Regularly check competitor amenities in Guadalupe to stay competitive.
Guadalupe Airbnb Guest Demographics & Profile Analysis (2026)
Guest Profile Summary for Guadalupe
- The typical guest profile for Airbnb in Guadalupe consists of primarily domestic travelers (87%), often arriving from nearby Mexico City, typically belonging to the Post-2000s (Gen Z/Alpha) group (50%), primarily speaking Spanish or English.
- Domestic travelers account for 87.4% of guests.
- Key international markets include Mexico (87.4%) and United States (9.9%).
- Top languages spoken are Spanish (59.6%) followed by English (33.9%).
- A significant demographic segment is the Post-2000s (Gen Z/Alpha) group, representing 50% of guests.
Recommendations for Hosts
- Target domestic marketing efforts towards travelers from Mexico City and Monterrey.
- Tailor amenities and listing descriptions to appeal to the dominant Post-2000s (Gen Z/Alpha) demographic (e.g., highlight fast WiFi, smart home features, local guides).
- Highlight unique local experiences or amenities relevant to the primary guest profile.
- Consider seasonal promotions aligned with peak travel times for key origin markets.
Nearby Short-Term Rental Market Comparison
How does the Guadalupe Airbnb market stack up against its neighbors? Compare key performance metrics like average monthly revenue, ADR, and occupancy rates in surrounding areas to understand the broader regional STR landscape.
| Market | Active Properties | Monthly Revenue | Daily Rate | Avg. Occupancy |
|---|---|---|---|---|
| Bella Unión | 10 | $4,181 | $286.89 | 37% |
| El Cercado | 14 | $1,947 | $212.87 | 32% |
| Jame | 10 | $1,486 | $169.30 | 27% |
| General Zuazua | 20 | $1,472 | $277.59 | 26% |
| Mesa de tablas | 43 | $1,457 | $302.25 | 18% |
| Barrio de Huajuquito | 11 | $1,453 | $236.72 | 26% |
| Arteaga | 86 | $1,323 | $213.56 | 24% |
| San Antonio de Las Alazanas | 37 | $1,165 | $285.00 | 18% |
| Allende | 17 | $1,151 | $150.10 | 30% |
| Montemorelos | 21 | $1,148 | $183.07 | 26% |