Apodaca Airbnb Market Analysis 2026: Short Term Rental Data & Vacation Rental Statistics in Nuevo León, Mexico
Is Airbnb profitable in Apodaca in 2026? Explore comprehensive Airbnb analytics for Apodaca, Nuevo León, Mexico to uncover income potential. This 2026 STR market report for Apodaca, based on AirROI data from February 2025 to January 2026, reveals key trends in the market of 437 active listings.
Whether you're considering an Airbnb investment in Apodaca, optimizing your existing vacation rental, or exploring rental arbitrage opportunities, understanding the Apodaca Airbnb data is crucial. Leveraging the low regulation environment is key to maximizing your short term rental income potential. Let's dive into the specifics.
Key Apodaca Airbnb Performance Metrics Overview
Monthly Airbnb Revenue Variations & Income Potential in Apodaca (2026)
Understanding the monthly revenue variations for Airbnb listings in Apodaca is key to maximizing your short term rental income potential. Seasonality significantly impacts earnings. Our analysis, based on data from the past 12 months, shows that the peak revenue month for STRs in Apodaca is typically July, while January often presents the lowest earnings, highlighting opportunities for strategic pricing adjustments during shoulder and low seasons. Explore the typical Airbnb income in Apodaca across different performance tiers:
- Best-in-class properties (Top 10%) achieve $1,702+ monthly, often utilizing dynamic pricing and superior guest experiences.
- Strong performing properties (Top 25%) earn $1,119 or more, indicating effective management and desirable locations/amenities.
- Typical properties (Median) generate around $629 per month, representing the average market performance.
- Entry-level properties (Bottom 25%) see earnings around $287, often with potential for optimization.
Average Monthly Airbnb Earnings Trend in Apodaca
Apodaca Airbnb Occupancy Rate Trends (2026)
Maximize your bookings by understanding the Apodaca STR occupancy trends. Seasonal demand shifts significantly influence how often properties are booked. Typically, Marchsees the highest demand (peak season occupancy), while January experiences the lowest (low season). Effective strategies, like adjusting minimum stays or offering promotions, can boost occupancy during slower periods. Here's how different property tiers perform in Apodaca:
- Best-in-class properties (Top 10%) achieve 80%+ occupancy, indicating high desirability and potentially optimized availability.
- Strong performing properties (Top 25%) maintain 61% or higher occupancy, suggesting good market fit and guest satisfaction.
- Typical properties (Median) have an occupancy rate around 38%.
- Entry-level properties (Bottom 25%) average 19% occupancy, potentially facing higher vacancy.
Average Monthly Occupancy Rate Trend in Apodaca
Average Daily Rate (ADR) Airbnb Trends in Apodaca (2026)
Effective short term rental pricing strategy in Apodaca involves understanding monthly ADR fluctuations. The Average Daily Rate (ADR) for Airbnb in Apodaca typically peaks in December and dips lowest during February. Leveraging Airbnb dynamic pricing tools or strategies based on this seasonality can significantly boost revenue. Here's a look at the typical nightly rates achieved:
- Best-in-class properties (Top 10%) command rates of $101+ per night, often due to premium features or locations.
- Strong performing properties (Top 25%) achieve nightly rates of $75 or more.
- Typical properties (Median) charge around $54 per night.
- Entry-level properties (Bottom 25%) earn around $38 per night.
Average Daily Rate (ADR) Trend by Month in Apodaca
Get Live Apodaca Market Intelligence 👇

Explore Real-time Analytics
Airbnb Seasonality Analysis & Trends in Apodaca (2026)
Peak Season (July, April, March)
- Revenue averages $894 per month
- Occupancy rates average 46.6%
- Daily rates average $59
Shoulder Season
- Revenue averages $824 per month
- Occupancy maintains around 39.9%
- Daily rates hold near $66
Low Season (January, February, November)
- Revenue drops to average $679 per month
- Occupancy decreases to average 37.2%
- Daily rates adjust to average $66
Seasonality Insights for Apodaca
- The Airbnb seasonality in Apodaca shows moderate seasonality with distinct peak and low periods. While the sections above show seasonal averages, it's also insightful to look at the extremes:
- During the high season, the absolute peak month showcases Apodaca's highest earning potential, with monthly revenues capable of climbing to $924, occupancy reaching a high of 48.7%, and ADRs peaking at $74.
- Conversely, the slowest single month of the year, typically falling within the low season, marks the market's lowest point. In this month, revenue might dip to $600, occupancy could drop to 28.4%, and ADRs may adjust down to $54.
- Understanding both the seasonal averages and these monthly peaks and troughs in revenue, occupancy, and ADR is crucial for maximizing your Airbnb profit potential in Apodaca.
Seasonal Strategies for Maximizing Profit
- Peak Season: Maximize revenue through premium pricing and potentially longer minimum stays. Ensure high availability.
- Low Season: Offer competitive pricing, special promotions (e.g., extended stay discounts), and flexible cancellation policies. Target off-season travelers like remote workers or budget-conscious guests.
- Shoulder Seasons: Implement dynamic pricing that balances peak and low rates. Target weekend travelers or specific events. Offer slightly more flexible terms than peak season.
- Regularly analyze your own performance against these Apodaca seasonality benchmarks and adjust your pricing and availability strategy accordingly.
Best Areas for Airbnb Investment in Apodaca (2026)
Exploring the top neighborhoods for short-term rentals in Apodaca? This section highlights key areas, outlining why they are attractive for hosts and guests, along with notable local attractions. Consider these locations based on your target guest profile and investment strategy.
| Neighborhood / Area | Why Host Here? (Target Guests & Appeal) | Key Attractions & Landmarks |
|---|---|---|
| Centro de Apodaca | The central area of Apodaca is bustling with activity, close to shops, restaurants, and local attractions. It's a vibrant area popular with locals and visitors alike. | Parque Las Mañanitas, Catedral de Apodaca, Plaza de la Tecnología, Megacomercial Mexicana, Cinemex Apodaca |
| Colonia Nuevo Apodaca | This residential area is known for its family-friendly atmosphere and accessibility. It's ideal for those looking for a quieter space with close proximity to urban conveniences. | Parque de Los Naranjos, Parque de las Flores, Centro Comercial Paseo La Fe |
| Colonia Hacienda San Juan | An emerging area with new developments and amenities that attract both business and leisure travelers. Modern facilities make it suitable for short-term rentals. | Parque de la Amistad, Cinemex El Paseo, plazas and shopping centers |
| Colonia Santa Rosa | A charming neighborhood characterized by its local culture and traditions. It offers a unique experience for visitors looking to immerse themselves in the local way of life. | Mercado Municipal, Iglesia de Santa Rosa, Parque Santa Rosa |
| Colonia San Nicolás | Proximity to major transportation routes and business hubs makes this area appealing for business travelers and tourists alike. Plenty of amenities within reach. | Cintermex, Parque Fundidora, Museo de Historia Mexicana |
| Colonia La Concordia | A quiet neighborhood with parks and recreational areas, making it attractive for families visiting Apodaca. Great for longer stays. | Parque La Concordia, Plaza Comercial La Concordia, local markets |
| Colonia Valle de Apodaca | An up-and-coming locality with new residential projects and a growing community vibe. This area is becoming increasingly popular for short-term rentals. | Parque Valle de Apodaca, Centros educativos, plazas and community centers |
| Colonia El Sabino | A pleasant area with a great community feel. It provides access to local dining options and cultural attractions without being too far from the city center. | Parque El Sabino, local restaurants, cultural festivals |
Understanding Airbnb License Requirements & STR Laws in Apodaca (2026)
While Apodaca, Nuevo León, Mexico currently shows low STR regulations, specific Airbnb license requirements might still exist or change. Always verify the latest short term rental regulations and Airbnb license requirements directly with local government authorities for Apodaca to ensure full compliance before hosting.
(Source: AirROI data, 2026, based on 0% licensed listings)
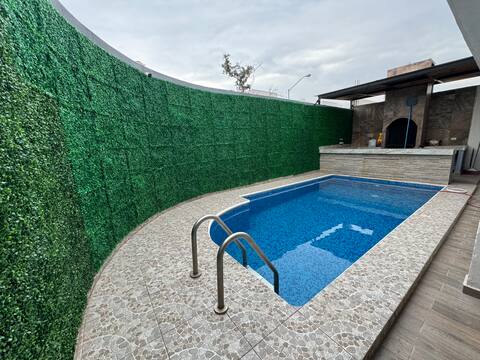
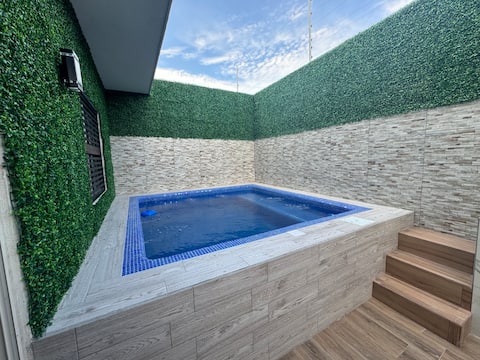
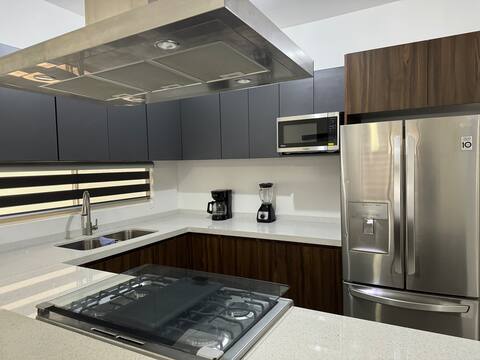
Top Performing Airbnb Properties in Apodaca (2026)
Benchmark your potential! Explore examples of top-performing Airbnb properties in Apodacabased on Trailing Twelve Month (TTM) revenue. Analyze their characteristics, revenue, occupancy rate, and ADR to understand what drives success in this market.

Just like home! Deluxe! With a pool and a water tank!
Entire Place • 6 bedrooms
Luxury house with pool 10 minutes from the airport
Entire Place • 6 bedrooms
Spacious house with a luxury pool
Entire Place • 5 bedrooms
Comfortable, large, luxurious
Entire Place • 5 bedrooms

House with a view of the Lagoon
Entire Place • 2 bedrooms

Amazing Residence (Fast WiFi) in Dream Lagoons
Entire Place • 3 bedrooms
Note: Performance varies based on location, size, amenities, seasonality, and management quality. Data reflects the past 12 months.
Top Performing Airbnb Hosts in Apodaca (2026)
Learn from the best! This table showcases top-performing Airbnb hosts in Apodaca based on the number of properties managed and estimated total revenue over the past year. Analyze their scale and performance metrics.
| Host Name | Properties | Grossing Revenue | Stay Reviews | Avg Rating |
|---|---|---|---|---|
| Fernando Perez | 8 | $173,533 | 807 | 4.81/5.0 |
| Jorge | 6 | $101,698 | 695 | 4.85/5.0 |
| Jessy | 9 | $62,315 | 223 | 4.73/5.0 |
| Paula | 4 | $56,522 | 584 | 4.73/5.0 |
| Patricia | 3 | $42,295 | 660 | 4.70/5.0 |
| Sarahi | 5 | $38,459 | 271 | 4.81/5.0 |
| Jorge | 3 | $35,437 | 515 | 4.81/5.0 |
| Martha Elena | 2 | $34,815 | 110 | 4.86/5.0 |
| Gilberto | 6 | $33,815 | 168 | 4.75/5.0 |
| Germán | 15 | $31,606 | 258 | 4.82/5.0 |
Analyzing the strategies of top hosts, such as their property selection, pricing, and guest communication, can offer valuable lessons for optimizing your own Airbnb operations in Apodaca.
Dive Deeper: Advanced Apodaca STR Market Data (2026)
Ready to unlock more insights? AirROI provides access to advanced metrics and comprehensive Airbnb data for Apodaca. Explore detailed analytics beyond this report to refine your investment strategy, optimize pricing, and maximize your vacation rental profits.
Explore Advanced MetricsApodaca Short-Term Rental Market Composition (2026): Property & Room Types
Room Type Distribution
Property Type Distribution
Market Composition Insights for Apodaca
- The Apodaca Airbnb market composition is heavily skewed towards Entire Home/Apt listings, which make up 79.2% of the 437 active rentals. This indicates strong guest preference for privacy and space.
- Looking at the property type distribution in Apodaca, House properties are the most common (70.3%), reflecting the local real estate landscape.
- Houses represent a significant 70.3% portion, catering likely to families or larger groups.
- The presence of 5.5% Hotel/Boutique listings indicates integration with traditional hospitality.
- Smaller segments like others, outdoor/unique (combined 1.6%) offer potential for unique stay experiences.
Apodaca Airbnb Room Capacity Analysis (2026): Bedroom Distribution
Distribution of Listings by Number of Bedrooms
Room Capacity Insights for Apodaca
- The dominant room capacity in Apodaca is 3 bedrooms listings, making up 30.9% of the market. This suggests a strong demand for properties suitable for families or small groups.
- Together, 3 bedrooms and 2 bedrooms properties represent 57.7% of the active Airbnb listings in Apodaca, indicating a high concentration in these sizes.
- A significant 35.9% of listings offer 3+ bedrooms, catering to larger groups and families seeking more space in Apodaca.
Apodaca Vacation Rental Guest Capacity Trends (2026)
Distribution of Listings by Guest Capacity
Guest Capacity Insights for Apodaca
- The most common guest capacity trend in Apodaca vacation rentals is listings accommodating 6 guests (22.2%). This suggests the primary traveler segment is likely larger groups.
- Properties designed for 6 guests and 8+ guests dominate the Apodaca STR market, accounting for 37.5% of listings.
- 42.1% of properties accommodate 6+ guests, serving the market segment for larger families or group travel in Apodaca.
- On average, properties in Apodaca are equipped to host 4.4 guests.
Apodaca Airbnb Booking Patterns (2026): Available vs. Booked Days
Available Days Distribution
Booked Days Distribution
Booking Pattern Insights for Apodaca
- The most common availability pattern in Apodaca falls within the 271-366 days range, representing 48.7% of listings. This suggests many properties have significant open periods on their calendars.
- Approximately 82.1% of listings show high availability (181+ days open annually), indicating potential for increased bookings or specific owner usage patterns.
- For booked days, the 91-180 days range is most frequent in Apodaca (34.8%), reflecting common guest stay durations or potential owner blocking patterns.
- A notable 18.5% of properties secure long booking periods (181+ days booked per year), highlighting successful long-term rental strategies or significant owner usage.
Apodaca Airbnb Minimum Stay Requirements Analysis
Distribution of Listings by Minimum Night Requirement
1 Night
180 listings
41.2% of total
2 Nights
108 listings
24.7% of total
3 Nights
25 listings
5.7% of total
4-6 Nights
19 listings
4.3% of total
7-29 Nights
16 listings
3.7% of total
30+ Nights
89 listings
20.4% of total
Key Insights
- The most prevalent minimum stay requirement in Apodaca is 1 Night, adopted by 41.2% of listings. This highlights the market's preference for shorter, flexible bookings.
- A strong majority (65.9%) of the Apodaca Airbnb data shows acceptance of very short stays (1-2 nights), indicating a dynamic, high-turnover market.
- A significant segment (20.4%) caters to monthly stays (30+ nights) in Apodaca, pointing to opportunities in the extended-stay market.
Recommendations
- Align with the market by considering a 1 Night minimum stay, as 41.2% of Apodaca hosts use this setting.
- Explore offering discounts for stays of 30+ nights to attract the 20.4% of the market seeking extended stays.
- Adjust minimum nights based on seasonality – potentially shorter during low season and longer during peak demand periods in Apodaca.
Apodaca Airbnb Cancellation Policy Trends Analysis (2026)
Limited
1 listings
0.2% of total
Flexible
211 listings
48.3% of total
Moderate
102 listings
23.3% of total
Firm
76 listings
17.4% of total
Strict
47 listings
10.8% of total
Cancellation Policy Insights for Apodaca
- The prevailing Airbnb cancellation policy trend in Apodaca is Flexible, used by 48.3% of listings.
- The market strongly favors guest-friendly terms, with 71.6% of listings offering Flexible or Moderate policies. This suggests guests in Apodaca may expect booking flexibility.
Recommendations for Hosts
- Consider adopting a Flexible policy to align with the 48.3% market standard in Apodaca.
- Using a Strict policy might deter some guests, as only 10.8% of listings use it. Evaluate if potential revenue protection outweighs possible lower booking rates.
- Regularly review your cancellation policy against competitors and market demand shifts in Apodaca.
Apodaca STR Booking Lead Time Analysis (2026)
Average Booking Lead Time by Month
Booking Lead Time Insights for Apodaca
- The overall average booking lead time for vacation rentals in Apodaca is 16 days.
- Guests book furthest in advance for stays during April (average 33 days), likely coinciding with peak travel demand or local events.
- The shortest booking windows occur for stays in February (average 9 days), indicating more last-minute travel plans during this time.
- Seasonally, Spring (18 days avg.) sees the longest lead times, while Winter (11 days avg.) has the shortest, reflecting typical travel planning cycles.
Recommendations for Hosts
- Use the overall average lead time (16 days) as a baseline for your pricing and availability strategy in Apodaca.
- For April stays, consider implementing length-of-stay discounts or slightly higher rates for bookings made less than 33 days out to capitalize on advance planning.
- Target marketing efforts for the Spring season well in advance (at least 18 days) to capture early planners.
- Monitor your own booking lead times against these Apodaca averages to identify opportunities for dynamic pricing adjustments.
Popular & Essential Airbnb Amenities in Apodaca (2026)
Amenity Prevalence
Amenity Insights for Apodaca
- Essential amenities in Apodaca that guests expect include: Wifi, Air conditioning. Lacking these (any) could significantly impact bookings.
- Popular amenities like TV, Kitchen, Hot water are common but not universal. Offering these can provide a competitive edge.
Recommendations for Hosts
- Ensure your listing includes all essential amenities for Apodaca: Wifi, Air conditioning.
- Prioritize adding missing essentials: Wifi, Air conditioning.
- Consider adding popular differentiators like TV or Kitchen to increase appeal.
- Highlight unique or less common amenities you offer (e.g., hot tub, dedicated workspace, EV charger) in your listing description and photos.
- Regularly check competitor amenities in Apodaca to stay competitive.
Apodaca Airbnb Guest Demographics & Profile Analysis (2026)
Guest Profile Summary for Apodaca
- The typical guest profile for Airbnb in Apodaca consists of primarily domestic travelers (83%), often arriving from nearby Mexico City, typically belonging to the Post-2000s (Gen Z/Alpha) group (50%), primarily speaking Spanish or English.
- Domestic travelers account for 83.3% of guests.
- Key international markets include Mexico (83.3%) and United States (12.8%).
- Top languages spoken are Spanish (59.2%) followed by English (33%).
- A significant demographic segment is the Post-2000s (Gen Z/Alpha) group, representing 50% of guests.
Recommendations for Hosts
- Target domestic marketing efforts towards travelers from Mexico City and Monterrey.
- Tailor amenities and listing descriptions to appeal to the dominant Post-2000s (Gen Z/Alpha) demographic (e.g., highlight fast WiFi, smart home features, local guides).
- Highlight unique local experiences or amenities relevant to the primary guest profile.
- Consider seasonal promotions aligned with peak travel times for key origin markets.
Nearby Short-Term Rental Market Comparison
How does the Apodaca Airbnb market stack up against its neighbors? Compare key performance metrics like average monthly revenue, ADR, and occupancy rates in surrounding areas to understand the broader regional STR landscape.
| Market | Active Properties | Monthly Revenue | Daily Rate | Avg. Occupancy |
|---|---|---|---|---|
| Bella Unión | 10 | $4,181 | $286.89 | 37% |
| El Cercado | 14 | $1,947 | $212.87 | 32% |
| Jame | 10 | $1,486 | $169.30 | 27% |
| General Zuazua | 20 | $1,472 | $277.59 | 26% |
| Mesa de tablas | 43 | $1,457 | $302.25 | 18% |
| Barrio de Huajuquito | 11 | $1,453 | $236.72 | 26% |
| Arteaga | 86 | $1,323 | $213.56 | 24% |
| San Antonio de Las Alazanas | 37 | $1,165 | $285.00 | 18% |
| Allende | 17 | $1,151 | $150.10 | 30% |
| Montemorelos | 21 | $1,148 | $183.07 | 26% |