Allende Airbnb Market Analysis 2025: Short Term Rental Data & Vacation Rental Statistics in Nuevo León, Mexico
Is Airbnb profitable in Allende in 2025? Explore comprehensive Airbnb analytics for Allende, Nuevo León, Mexico to uncover income potential. This 2025 STR market report for Allende, based on AirROI data from September 2024 to August 2025, reveals key trends in the niche market of 19 active listings.
Whether you're considering an Airbnb investment in Allende, optimizing your existing vacation rental, or exploring rental arbitrage opportunities, understanding the Allende Airbnb data is crucial. Leveraging the low regulation environment is key to maximizing your short term rental income potential. Let's dive into the specifics.
Key Allende Airbnb Performance Metrics Overview
Monthly Airbnb Revenue Variations & Income Potential in Allende (2025)
Understanding the monthly revenue variations for Airbnb listings in Allende is key to maximizing your short term rental income potential. Seasonality significantly impacts earnings. Our analysis, based on data from the past 12 months, shows that the peak revenue month for STRs in Allende is typically July, while February often presents the lowest earnings, highlighting opportunities for strategic pricing adjustments during shoulder and low seasons. Explore the typical Airbnb income in Allende across different performance tiers:
- Best-in-class properties (Top 10%) achieve $2,587+ monthly, often utilizing dynamic pricing and superior guest experiences.
- Strong performing properties (Top 25%) earn $1,576 or more, indicating effective management and desirable locations/amenities.
- Typical properties (Median) generate around $999 per month, representing the average market performance.
- Entry-level properties (Bottom 25%) see earnings around $620, often with potential for optimization.
Average Monthly Airbnb Earnings Trend in Allende
Allende Airbnb Occupancy Rate Trends (2025)
Maximize your bookings by understanding the Allende STR occupancy trends. Seasonal demand shifts significantly influence how often properties are booked. Typically, Maysees the highest demand (peak season occupancy), while February experiences the lowest (low season). Effective strategies, like adjusting minimum stays or offering promotions, can boost occupancy during slower periods. Here's how different property tiers perform in Allende:
- Best-in-class properties (Top 10%) achieve 60%+ occupancy, indicating high desirability and potentially optimized availability.
- Strong performing properties (Top 25%) maintain 46% or higher occupancy, suggesting good market fit and guest satisfaction.
- Typical properties (Median) have an occupancy rate around 29%.
- Entry-level properties (Bottom 25%) average 14% occupancy, potentially facing higher vacancy.
Average Monthly Occupancy Rate Trend in Allende
Average Daily Rate (ADR) Airbnb Trends in Allende (2025)
Effective short term rental pricing strategy in Allende involves understanding monthly ADR fluctuations. The Average Daily Rate (ADR) for Airbnb in Allende typically peaks in July and dips lowest during February. Leveraging Airbnb dynamic pricing tools or strategies based on this seasonality can significantly boost revenue. Here's a look at the typical nightly rates achieved:
- Best-in-class properties (Top 10%) command rates of $333+ per night, often due to premium features or locations.
- Strong performing properties (Top 25%) achieve nightly rates of $224 or more.
- Typical properties (Median) charge around $93 per night.
- Entry-level properties (Bottom 25%) earn around $75 per night.
Average Daily Rate (ADR) Trend by Month in Allende
Get Live Allende Market Intelligence 👇

Explore Real-time Analytics
Airbnb Seasonality Analysis & Trends in Allende (2025)
Peak Season (July, August, June)
- Revenue averages $2,079 per month
- Occupancy rates average 37.9%
- Daily rates average $158
Shoulder Season
- Revenue averages $1,431 per month
- Occupancy maintains around 34.6%
- Daily rates hold near $145
Low Season (January, February, November)
- Revenue drops to average $978 per month
- Occupancy decreases to average 24.7%
- Daily rates adjust to average $142
Seasonality Insights for Allende
- The Airbnb seasonality in Allende shows highly seasonal trends requiring careful strategy. While the sections above show seasonal averages, it's also insightful to look at the extremes:
- During the high season, the absolute peak month showcases Allende's highest earning potential, with monthly revenues capable of climbing to $2,359, occupancy reaching a high of 40.6%, and ADRs peaking at $161.
- Conversely, the slowest single month of the year, typically falling within the low season, marks the market's lowest point. In this month, revenue might dip to $715, occupancy could drop to 20.5%, and ADRs may adjust down to $138.
- Understanding both the seasonal averages and these monthly peaks and troughs in revenue, occupancy, and ADR is crucial for maximizing your Airbnb profit potential in Allende.
Seasonal Strategies for Maximizing Profit
- Peak Season: Maximize revenue through premium pricing and potentially longer minimum stays. Ensure high availability.
- Low Season: Offer competitive pricing, special promotions (e.g., extended stay discounts), and flexible cancellation policies. Target off-season travelers like remote workers or budget-conscious guests.
- Shoulder Seasons: Implement dynamic pricing that balances peak and low rates. Target weekend travelers or specific events. Offer slightly more flexible terms than peak season.
- Regularly analyze your own performance against these Allende seasonality benchmarks and adjust your pricing and availability strategy accordingly.
Best Areas for Airbnb Investment in Allende (2025)
Exploring the top neighborhoods for short-term rentals in Allende? This section highlights key areas, outlining why they are attractive for hosts and guests, along with notable local attractions. Consider these locations based on your target guest profile and investment strategy.
| Neighborhood / Area | Why Host Here? (Target Guests & Appeal) | Key Attractions & Landmarks |
|---|---|---|
| Centro de Allende | The central area of Allende is rich in culture and history, making it a prime spot for visitors looking to explore local attractions, dine at traditional restaurants, and experience the vibrant nightlife. | Parroquia del Sagrado Corazón de Jesús, Jardín Principal, Casa de Cultura, Local art shops, Restaurants and cafes |
| San José de las Salinas | This area attracts tourists looking for a more rural experience with beautiful landscapes and proximity to nature. It's perfect for outdoor activities and family-friendly excursions. | Laguna de San José, Local farms, Hiking trails, Natural parks, Fishing spots |
| Las Palomas | A suburban area with tranquil surroundings, Las Palomas is popular among families and groups seeking a peaceful stay with easy access to Allende's main attractions and amenities. | Playgrounds, Community parks, Family-friendly restaurants, Local markets |
| Villa de Santiago | Known for its stunning natural beauty, Villa de Santiago is a great destination for nature lovers and adventurers, offering outdoor activities and scenic views. | Cerro de la Silla, Parque Nacional Cumbres de Monterrey, Cañon de la Huasteca, Paseo Santa Lucia |
| Local wineries | Allende has several local wineries that attract visitors. An Airbnb in this area offers access to wine tours and tastings, appealing to tourists interested in local gastronomy. | Vineyards tour, Wine tasting events, Gourmet food experiences |
| Río La Silla | This region is a serene area along the river, perfect for those looking for a relaxing getaway with water activities and picnics by the riverbanks. | Fishing areas, Picnic sites, Kayaking opportunities, Bird watching |
| Comunidad de la Esperanza | A community-focused area that provides a unique cultural experience, often hosting local events and markets, perfect for travelers looking for an authentic experience. | Cultural fairs, Local crafts, Traditional events, Community gatherings |
| Cerro del Topo | This elevated area provides stunning views and is attractive for hiking enthusiasts. Ideal for those wanting to connect with nature and enjoy panoramic landscapes. | Hiking routes, Scenic lookout points, Nature photography spots |
Understanding Airbnb License Requirements & STR Laws in Allende (2025)
While Allende, Nuevo León, Mexico currently shows low STR regulations, specific Airbnb license requirements might still exist or change. Always verify the latest short term rental regulations and Airbnb license requirements directly with local government authorities for Allende to ensure full compliance before hosting.
(Source: AirROI data, 2025, finding no licensed listings among those analyzed)
Top Performing Airbnb Properties in Allende (2025)
Benchmark your potential! Explore examples of top-performing Airbnb properties in Allendebased on Trailing Twelve Month (TTM) revenue. Analyze their characteristics, revenue, occupancy rate, and ADR to understand what drives success in this market.

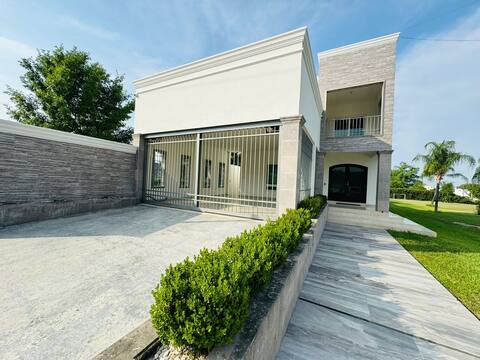
Quinta El Reencuentro (Villa)
Entire Place • 5 bedrooms
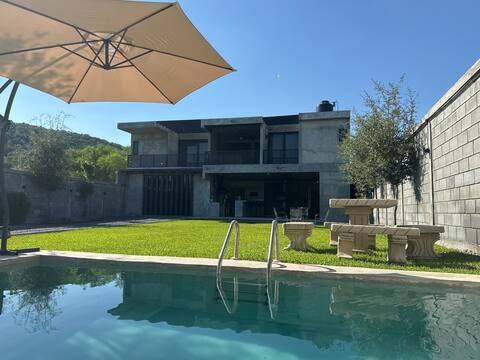
Guest house with a pool in Allende
Entire Place • 3 bedrooms
House in Allende with a pool (Casa Guaname)
Entire Place • 2 bedrooms

Quinta Felinos
Entire Place • 2 bedrooms

"La Terraza" House
Entire Place • 2 bedrooms

The Esquina House
Entire Place • 2 bedrooms
Note: Performance varies based on location, size, amenities, seasonality, and management quality. Data reflects the past 12 months.
Top Performing Airbnb Hosts in Allende (2025)
Learn from the best! This table showcases top-performing Airbnb hosts in Allende based on the number of properties managed and estimated total revenue over the past year. Analyze their scale and performance metrics.
| Host Name | Properties | Grossing Revenue | Stay Reviews | Avg Rating |
|---|---|---|---|---|
| Martin | 1 | $77,293 | 83 | 4.99/5.0 |
| Yesenia | 2 | $25,639 | 221 | 4.82/5.0 |
| Cavazos | 1 | $24,450 | 28 | 4.96/5.0 |
| Marco Antonio | 1 | $20,355 | 35 | 4.80/5.0 |
| Marcos Valentin | 1 | $17,938 | 3 | 5.00/5.0 |
| Juan Fernando | 1 | $14,256 | 309 | 4.94/5.0 |
| Jonathan | 1 | $12,718 | 64 | 4.97/5.0 |
| Yiseel Alejandra | 1 | $11,233 | 39 | 5.00/5.0 |
| Cinthya | 2 | $8,871 | 78 | 4.63/5.0 |
| Daniel | 1 | $7,319 | 6 | 4.50/5.0 |
Analyzing the strategies of top hosts, such as their property selection, pricing, and guest communication, can offer valuable lessons for optimizing your own Airbnb operations in Allende.
Dive Deeper: Advanced Allende STR Market Data (2025)
Ready to unlock more insights? AirROI provides access to advanced metrics and comprehensive Airbnb data for Allende. Explore detailed analytics beyond this report to refine your investment strategy, optimize pricing, and maximize your vacation rental profits.
Explore Advanced MetricsAllende Short-Term Rental Market Composition (2025): Property & Room Types
Room Type Distribution
Property Type Distribution
Market Composition Insights for Allende
- The Allende Airbnb market composition is heavily skewed towards Entire Home/Apt listings, which make up 94.7% of the 19 active rentals. This indicates strong guest preference for privacy and space.
- Looking at the property type distribution in Allende, House properties are the most common (68.4%), reflecting the local real estate landscape.
- Houses represent a significant 68.4% portion, catering likely to families or larger groups.
Allende Airbnb Room Capacity Analysis (2025): Bedroom Distribution
Distribution of Listings by Number of Bedrooms
Room Capacity Insights for Allende
- The dominant room capacity in Allende is 2 bedrooms listings, making up 47.4% of the market. This suggests a strong demand for properties suitable for couples or solo travelers.
- Together, 2 bedrooms and 1 bedroom properties represent 73.7% of the active Airbnb listings in Allende, indicating a high concentration in these sizes.
- A significant 21.1% of listings offer 3+ bedrooms, catering to larger groups and families seeking more space in Allende.
Allende Vacation Rental Guest Capacity Trends (2025)
Distribution of Listings by Guest Capacity
Guest Capacity Insights for Allende
- The most common guest capacity trend in Allende vacation rentals is listings accommodating 4 guests (42.1%). This suggests the primary traveler segment is likely small families or groups.
- Properties designed for 4 guests and 8+ guests dominate the Allende STR market, accounting for 68.4% of listings.
- 36.8% of properties accommodate 6+ guests, serving the market segment for larger families or group travel in Allende.
- On average, properties in Allende are equipped to host 5.2 guests.
Allende Airbnb Booking Patterns (2025): Available vs. Booked Days
Available Days Distribution
Booked Days Distribution
Booking Pattern Insights for Allende
- The most common availability pattern in Allende falls within the 271-366 days range, representing 68.4% of listings. This suggests many properties have significant open periods on their calendars.
- Approximately 89.5% of listings show high availability (181+ days open annually), indicating potential for increased bookings or specific owner usage patterns.
- For booked days, the 31-90 days range is most frequent in Allende (47.4%), reflecting common guest stay durations or potential owner blocking patterns.
- A notable 10.5% of properties secure long booking periods (181+ days booked per year), highlighting successful long-term rental strategies or significant owner usage.
Allende Airbnb Minimum Stay Requirements Analysis
Distribution of Listings by Minimum Night Requirement
1 Night
15 listings
78.9% of total
2 Nights
3 listings
15.8% of total
30+ Nights
1 listings
5.3% of total
Key Insights
- The most prevalent minimum stay requirement in Allende is 1 Night, adopted by 78.9% of listings. This highlights the market's preference for shorter, flexible bookings.
- A strong majority (94.7%) of the Allende Airbnb data shows acceptance of very short stays (1-2 nights), indicating a dynamic, high-turnover market.
Recommendations
- Align with the market by considering a 1 Night minimum stay, as 78.9% of Allende hosts use this setting.
- Explore offering discounts for stays of 30+ nights to attract the 5.3% of the market seeking extended stays.
- Adjust minimum nights based on seasonality – potentially shorter during low season and longer during peak demand periods in Allende.
Allende Airbnb Cancellation Policy Trends Analysis (2025)
Flexible
6 listings
31.6% of total
Moderate
6 listings
31.6% of total
Firm
3 listings
15.8% of total
Strict
4 listings
21.1% of total
Cancellation Policy Insights for Allende
- The prevailing Airbnb cancellation policy trend in Allende is Flexible, used by 31.6% of listings.
- There's a relatively balanced mix between guest-friendly (63.2%) and stricter (36.9%) policies, offering choices for different guest needs.
Recommendations for Hosts
- Consider adopting a Flexible policy to align with the 31.6% market standard in Allende.
- Regularly review your cancellation policy against competitors and market demand shifts in Allende.
Allende STR Booking Lead Time Analysis (2025)
Average Booking Lead Time by Month
Booking Lead Time Insights for Allende
- The overall average booking lead time for vacation rentals in Allende is 18 days.
- Guests book furthest in advance for stays during July (average 25 days), likely coinciding with peak travel demand or local events.
- The shortest booking windows occur for stays in September (average 11 days), indicating more last-minute travel plans during this time.
- Seasonally, Spring (22 days avg.) sees the longest lead times, while Winter (17 days avg.) has the shortest, reflecting typical travel planning cycles.
Recommendations for Hosts
- Use the overall average lead time (18 days) as a baseline for your pricing and availability strategy in Allende.
- Target marketing efforts for the Spring season well in advance (at least 22 days) to capture early planners.
- Monitor your own booking lead times against these Allende averages to identify opportunities for dynamic pricing adjustments.
Popular & Essential Airbnb Amenities in Allende (2025)
Amenity Prevalence
Amenity Insights for Allende
- Popular amenities like Air conditioning, Free parking on premises, Hot water are common but not universal. Offering these can provide a competitive edge.
- Warning: Wifi is not universally provided but is considered essential globally. Ensure reliable Wifi is offered.
Recommendations for Hosts
- Consider adding popular differentiators like Air conditioning or Free parking on premises to increase appeal.
- Highlight unique or less common amenities you offer (e.g., hot tub, dedicated workspace, EV charger) in your listing description and photos.
- Regularly check competitor amenities in Allende to stay competitive.
Allende Airbnb Guest Demographics & Profile Analysis (2025)
Guest Profile Summary for Allende
- The typical guest profile for Airbnb in Allende consists of primarily domestic travelers (85%), often arriving from nearby Monterrey, typically belonging to the Post-2000s (Gen Z/Alpha) group (50%), primarily speaking Spanish or English.
- Domestic travelers account for 84.8% of guests.
- Key international markets include Mexico (84.8%) and United States (11.7%).
- Top languages spoken are Spanish (55.7%) followed by English (37.6%).
- A significant demographic segment is the Post-2000s (Gen Z/Alpha) group, representing 50% of guests.
Recommendations for Hosts
- Target domestic marketing efforts towards travelers from Monterrey and Reynosa.
- Tailor amenities and listing descriptions to appeal to the dominant Post-2000s (Gen Z/Alpha) demographic (e.g., highlight fast WiFi, smart home features, local guides).
- Highlight unique local experiences or amenities relevant to the primary guest profile.
- Consider seasonal promotions aligned with peak travel times for key origin markets.
Nearby Short-Term Rental Market Comparison
How does the Allende Airbnb market stack up against its neighbors? Compare key performance metrics like average monthly revenue, ADR, and occupancy rates in surrounding areas to understand the broader regional STR landscape.
| Market | Active Properties | Monthly Revenue | Daily Rate | Avg. Occupancy |
|---|---|---|---|---|
| Bella Unión | 10 | $3,761 | $277.51 | 36% |
| El Cercado | 17 | $1,745 | $232.93 | 29% |
| Barrio de Huajuquito | 11 | $1,668 | $223.35 | 29% |
| General Zuazua | 23 | $1,575 | $257.90 | 27% |
| Jame | 10 | $1,565 | $161.24 | 31% |
| Mesa de tablas | 41 | $1,440 | $293.86 | 18% |
| Arteaga | 89 | $1,390 | $198.04 | 26% |
| Montemorelos | 20 | $1,206 | $225.49 | 26% |
| Los Rodriguez | 12 | $1,177 | $164.66 | 26% |
| Colinas del Vergel | 10 | $1,148 | $233.13 | 21% |