San Pancho Airbnb Market Analysis 2026: Short Term Rental Data & Vacation Rental Statistics in Nayarit, Mexico
Is Airbnb profitable in San Pancho in 2026? Explore comprehensive Airbnb analytics for San Pancho, Nayarit, Mexico to uncover income potential. This 2026 STR market report for San Pancho, based on AirROI data from February 2025 to January 2026, reveals key trends in the niche market of 24 active listings.
Whether you're considering an Airbnb investment in San Pancho, optimizing your existing vacation rental, or exploring rental arbitrage opportunities, understanding the San Pancho Airbnb data is crucial. Leveraging the low regulation environment is key to maximizing your short term rental income potential. Let's dive into the specifics.
Key San Pancho Airbnb Performance Metrics Overview
Monthly Airbnb Revenue Variations & Income Potential in San Pancho (2026)
Understanding the monthly revenue variations for Airbnb listings in San Pancho is key to maximizing your short term rental income potential. Seasonality significantly impacts earnings. Our analysis, based on data from the past 12 months, shows that the peak revenue month for STRs in San Pancho is typically March, while May often presents the lowest earnings, highlighting opportunities for strategic pricing adjustments during shoulder and low seasons. Explore the typical Airbnb income in San Pancho across different performance tiers:
- Best-in-class properties (Top 10%) achieve $4,748+ monthly, often utilizing dynamic pricing and superior guest experiences.
- Strong performing properties (Top 25%) earn $3,729 or more, indicating effective management and desirable locations/amenities.
- Typical properties (Median) generate around $1,176 per month, representing the average market performance.
- Entry-level properties (Bottom 25%) see earnings around $659, often with potential for optimization.
Average Monthly Airbnb Earnings Trend in San Pancho
San Pancho Airbnb Occupancy Rate Trends (2026)
Maximize your bookings by understanding the San Pancho STR occupancy trends. Seasonal demand shifts significantly influence how often properties are booked. Typically, Februarysees the highest demand (peak season occupancy), while May experiences the lowest (low season). Effective strategies, like adjusting minimum stays or offering promotions, can boost occupancy during slower periods. Here's how different property tiers perform in San Pancho:
- Best-in-class properties (Top 10%) achieve 65%+ occupancy, indicating high desirability and potentially optimized availability.
- Strong performing properties (Top 25%) maintain 53% or higher occupancy, suggesting good market fit and guest satisfaction.
- Typical properties (Median) have an occupancy rate around 31%.
- Entry-level properties (Bottom 25%) average 16% occupancy, potentially facing higher vacancy.
Average Monthly Occupancy Rate Trend in San Pancho
Average Daily Rate (ADR) Airbnb Trends in San Pancho (2026)
Effective short term rental pricing strategy in San Pancho involves understanding monthly ADR fluctuations. The Average Daily Rate (ADR) for Airbnb in San Pancho typically peaks in January and dips lowest during July. Leveraging Airbnb dynamic pricing tools or strategies based on this seasonality can significantly boost revenue. Here's a look at the typical nightly rates achieved:
- Best-in-class properties (Top 10%) command rates of $404+ per night, often due to premium features or locations.
- Strong performing properties (Top 25%) achieve nightly rates of $196 or more.
- Typical properties (Median) charge around $124 per night.
- Entry-level properties (Bottom 25%) earn around $73 per night.
Average Daily Rate (ADR) Trend by Month in San Pancho
Get Live San Pancho Market Intelligence 👇
Explore Real-time Analytics
Airbnb Seasonality Analysis & Trends in San Pancho (2026)
Peak Season (March, February, December)
- Revenue averages $4,546 per month
- Occupancy rates average 47.5%
- Daily rates average $208
Shoulder Season
- Revenue averages $1,693 per month
- Occupancy maintains around 34.8%
- Daily rates hold near $231
Low Season (May, July, August)
- Revenue drops to average $940 per month
- Occupancy decreases to average 26.0%
- Daily rates adjust to average $157
Seasonality Insights for San Pancho
- The Airbnb seasonality in San Pancho shows highly seasonal trends requiring careful strategy. While the sections above show seasonal averages, it's also insightful to look at the extremes:
- During the high season, the absolute peak month showcases San Pancho's highest earning potential, with monthly revenues capable of climbing to $6,176, occupancy reaching a high of 58.3%, and ADRs peaking at $305.
- Conversely, the slowest single month of the year, typically falling within the low season, marks the market's lowest point. In this month, revenue might dip to $637, occupancy could drop to 10.8%, and ADRs may adjust down to $154.
- Understanding both the seasonal averages and these monthly peaks and troughs in revenue, occupancy, and ADR is crucial for maximizing your Airbnb profit potential in San Pancho.
Seasonal Strategies for Maximizing Profit
- Peak Season: Maximize revenue through premium pricing and potentially longer minimum stays. Ensure high availability.
- Low Season: Offer competitive pricing, special promotions (e.g., extended stay discounts), and flexible cancellation policies. Target off-season travelers like remote workers or budget-conscious guests.
- Shoulder Seasons: Implement dynamic pricing that balances peak and low rates. Target weekend travelers or specific events. Offer slightly more flexible terms than peak season.
- Regularly analyze your own performance against these San Pancho seasonality benchmarks and adjust your pricing and availability strategy accordingly.
Best Areas for Airbnb Investment in San Pancho (2026)
Exploring the top neighborhoods for short-term rentals in San Pancho? This section highlights key areas, outlining why they are attractive for hosts and guests, along with notable local attractions. Consider these locations based on your target guest profile and investment strategy.
| Neighborhood / Area | Why Host Here? (Target Guests & Appeal) | Key Attractions & Landmarks |
|---|---|---|
| Centro | The heart of San Pancho, Centro is vibrant with local shops, restaurants, and cultural experiences. Ideal for those wanting to be in the midst of everything and enjoy the local lifestyle. | Plaza del sol, Local artisan shops, San Pancho's main beach, Cultural festivals, Art galleries |
| North Beach | A quieter stretch of beach, North Beach is perfect for those looking for relaxation and stunning ocean views. Great for families and couples seeking a peaceful retreat. | North Beach, Beautiful tidal pools, Surf spots, Secluded beach areas, Wildlife watching |
| San Pancho River | This area offers lush surroundings and the experience of nature close to the village. Great for eco-tourism and adventure seekers, with kayaking and nature trails. | San Pancho River, Kayaking, Nature trails, Bird watching, Picnic spots |
| Los Molcajetes | An upscale neighborhood that provides fantastic views of the ocean and the mountains. Ideal for rentals that offer luxury and exclusivity. | Luxury villas, Sunset views, Private pools, Gourmet dining near, Hiking trails |
| Art District | San Pancho's creative quarter, known for its vibrant art scene and artistic workshops. Attracts those interested in art and culture. | Art galleries, Workshops, Cultural events, Street art, Local artist studios |
| Surf Point | Perfect for surfing enthusiasts and those looking to catch waves. A lively spot with a laid-back vibe, attracting adventurous tourists. | Surfing spots, Beach bars, Surf schools, Local surf competitions, Ocean view restaurants |
| Health & Wellness Retreat Area | A focus on wellness and relaxation, this area features spas and retreats for those seeking rejuvenation and tranquility. | Yoga retreats, Wellness spas, Holistic health workshops, Meditation centers, Nature walks |
| Family Friendly Area | This area is designed with families in mind, featuring amenities and attractions suitable for children and family activities. | Family resorts, Kids friendly beaches, Playgrounds, Family restaurants, Community events |
Understanding Airbnb License Requirements & STR Laws in San Pancho (2026)
While San Pancho, Nayarit, Mexico currently shows low STR regulations, specific Airbnb license requirements might still exist or change. Always verify the latest short term rental regulations and Airbnb license requirements directly with local government authorities for San Pancho to ensure full compliance before hosting.
(Source: AirROI data, 2026, based on 4% licensed listings)
Top Performing Airbnb Properties in San Pancho (2026)
Benchmark your potential! Explore examples of top-performing Airbnb properties in San Panchobased on Trailing Twelve Month (TTM) revenue. Analyze their characteristics, revenue, occupancy rate, and ADR to understand what drives success in this market.
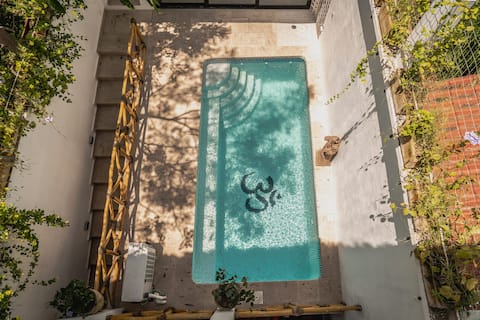
New and 100% equipped house
Entire Place • 4 bedrooms
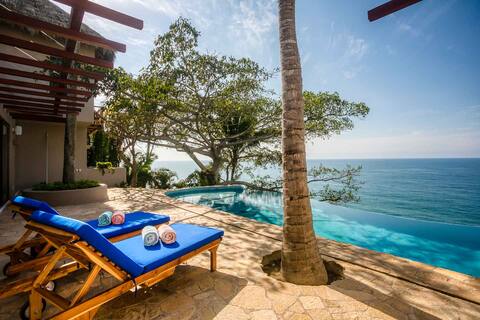
Casa Miramar - Oceanfront Villa
Entire Place • 2 bedrooms

Casa De Vigil: Beachfront Oasis Ocean Views & Pool
Entire Place • 2 bedrooms
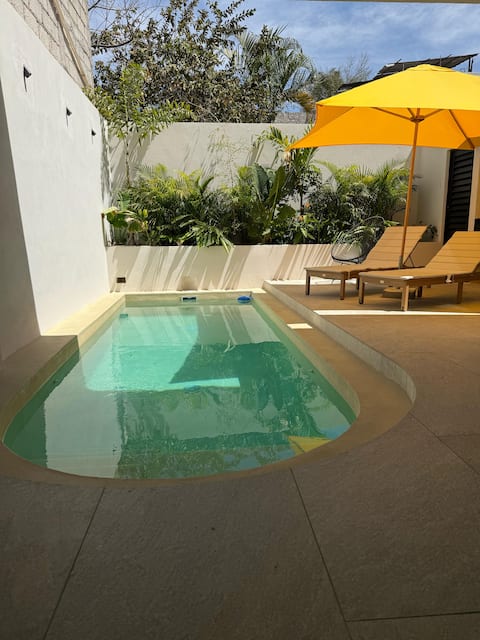
Casita Xallí
Entire Place • 2 bedrooms
Tranquil Jungle Retreat: Pool, Bikes, Walk to Town
Entire Place • 2 bedrooms
Cora House, Tierra Suite
Private Room • 2 bedrooms
Note: Performance varies based on location, size, amenities, seasonality, and management quality. Data reflects the past 12 months.
Top Performing Airbnb Hosts in San Pancho (2026)
Learn from the best! This table showcases top-performing Airbnb hosts in San Pancho based on the number of properties managed and estimated total revenue over the past year. Analyze their scale and performance metrics.
| Host Name | Properties | Grossing Revenue | Stay Reviews | Avg Rating |
|---|---|---|---|---|
| Arrival Getaways | 4 | $73,305 | 33 | 4.78/5.0 |
| Edwin | 1 | $33,839 | 10 | 4.90/5.0 |
| Host #131997214 | 1 | $33,442 | 0 | Not Rated |
| Bea | 3 | $28,651 | 121 | 4.88/5.0 |
| Enrique | 2 | $25,063 | 29 | 4.93/5.0 |
| Pablo | 5 | $24,994 | 47 | 4.94/5.0 |
| Tamara | 2 | $11,992 | 74 | 4.76/5.0 |
| Paulina | 1 | $9,925 | 3 | 5.00/5.0 |
| Soya | 1 | $8,381 | 1 | Not Rated |
| Emmanuel Alejandro | 1 | $3,494 | 1 | Not Rated |
Analyzing the strategies of top hosts, such as their property selection, pricing, and guest communication, can offer valuable lessons for optimizing your own Airbnb operations in San Pancho.
Dive Deeper: Advanced San Pancho STR Market Data (2026)
Ready to unlock more insights? AirROI provides access to advanced metrics and comprehensive Airbnb data for San Pancho. Explore detailed analytics beyond this report to refine your investment strategy, optimize pricing, and maximize your vacation rental profits.
Explore Advanced MetricsSan Pancho Short-Term Rental Market Composition (2026): Property & Room Types
Room Type Distribution
Property Type Distribution
Market Composition Insights for San Pancho
- The San Pancho Airbnb market composition is heavily skewed towards Entire Home/Apt listings, which make up 62.5% of the 24 active rentals. This indicates strong guest preference for privacy and space.
- However, a notable 37.5% share for Private Rooms suggests opportunities for budget-conscious travelers or hosts renting out spare rooms.
- Looking at the property type distribution in San Pancho, Hotel/Boutique properties are the most common (37.5%), reflecting the local real estate landscape.
- Houses represent a significant 29.2% portion, catering likely to families or larger groups.
- The presence of 37.5% Hotel/Boutique listings indicates integration with traditional hospitality.
- Smaller segments like outdoor/unique (combined 4.2%) offer potential for unique stay experiences.
San Pancho Airbnb Room Capacity Analysis (2026): Bedroom Distribution
Distribution of Listings by Number of Bedrooms
Room Capacity Insights for San Pancho
- The dominant room capacity in San Pancho is 2 bedrooms listings, making up 50% of the market. This suggests a strong demand for properties suitable for couples or solo travelers.
- Together, 2 bedrooms and 1 bedroom properties represent 87.5% of the active Airbnb listings in San Pancho, indicating a high concentration in these sizes.
San Pancho Vacation Rental Guest Capacity Trends (2026)
Distribution of Listings by Guest Capacity
Guest Capacity Insights for San Pancho
- The most common guest capacity trend in San Pancho vacation rentals is listings accommodating 4 guests (41.7%). This suggests the primary traveler segment is likely small families or groups.
- Properties designed for 4 guests and 2 guests dominate the San Pancho STR market, accounting for 70.9% of listings.
- 16.7% of properties accommodate 6+ guests, serving the market segment for larger families or group travel in San Pancho.
- On average, properties in San Pancho are equipped to host 4.0 guests.
San Pancho Airbnb Booking Patterns (2026): Available vs. Booked Days
Available Days Distribution
Booked Days Distribution
Booking Pattern Insights for San Pancho
- The most common availability pattern in San Pancho falls within the 271-366 days range, representing 70.8% of listings. This suggests many properties have significant open periods on their calendars.
- Approximately 95.8% of listings show high availability (181+ days open annually), indicating potential for increased bookings or specific owner usage patterns.
- For booked days, the 31-90 days range is most frequent in San Pancho (50%), reflecting common guest stay durations or potential owner blocking patterns.
- A notable 4.2% of properties secure long booking periods (181+ days booked per year), highlighting successful long-term rental strategies or significant owner usage.
San Pancho Airbnb Minimum Stay Requirements Analysis
Distribution of Listings by Minimum Night Requirement
1 Night
3 listings
12.5% of total
2 Nights
7 listings
29.2% of total
3 Nights
3 listings
12.5% of total
4-6 Nights
4 listings
16.7% of total
30+ Nights
7 listings
29.2% of total
Key Insights
- The most prevalent minimum stay requirement in San Pancho is 2 Nights, adopted by 29.2% of listings. This highlights the market's preference for shorter, flexible bookings.
- A significant segment (29.2%) caters to monthly stays (30+ nights) in San Pancho, pointing to opportunities in the extended-stay market.
Recommendations
- Align with the market by considering a 2 Nights minimum stay, as 29.2% of San Pancho hosts use this setting.
- If feasible, allowing 1-night stays, especially midweek or during low season, could capture last-minute bookings, as only 12.5% currently do.
- Explore offering discounts for stays of 30+ nights to attract the 29.2% of the market seeking extended stays.
- Adjust minimum nights based on seasonality – potentially shorter during low season and longer during peak demand periods in San Pancho.
San Pancho Airbnb Cancellation Policy Trends Analysis (2026)
Flexible
6 listings
25% of total
Moderate
1 listings
4.2% of total
Firm
14 listings
58.3% of total
Strict
3 listings
12.5% of total
Cancellation Policy Insights for San Pancho
- The prevailing Airbnb cancellation policy trend in San Pancho is Firm, used by 58.3% of listings.
- A majority (70.8%) of hosts in San Pancho utilize Firm or Strict policies, indicating a market where hosts prioritize booking security.
Recommendations for Hosts
- Consider adopting a Firm policy to align with the 58.3% market standard in San Pancho.
- Using a Strict policy might deter some guests, as only 12.5% of listings use it. Evaluate if potential revenue protection outweighs possible lower booking rates.
- Regularly review your cancellation policy against competitors and market demand shifts in San Pancho.
San Pancho STR Booking Lead Time Analysis (2026)
Average Booking Lead Time by Month
Booking Lead Time Insights for San Pancho
- The overall average booking lead time for vacation rentals in San Pancho is 50 days.
- Guests book furthest in advance for stays during April (average 129 days), likely coinciding with peak travel demand or local events.
- The shortest booking windows occur for stays in June (average 6 days), indicating more last-minute travel plans during this time.
- Seasonally, Winter (80 days avg.) sees the longest lead times, while Summer (17 days avg.) has the shortest, reflecting typical travel planning cycles.
Recommendations for Hosts
- Use the overall average lead time (50 days) as a baseline for your pricing and availability strategy in San Pancho.
- For April stays, consider implementing length-of-stay discounts or slightly higher rates for bookings made less than 129 days out to capitalize on advance planning.
- During June, focus on last-minute booking availability and promotions, as guests book with very short notice (6 days avg.).
- Target marketing efforts for the Winter season well in advance (at least 80 days) to capture early planners.
- Monitor your own booking lead times against these San Pancho averages to identify opportunities for dynamic pricing adjustments.
Popular & Essential Airbnb Amenities in San Pancho (2026)
Amenity Prevalence
Amenity Insights for San Pancho
- Essential amenities in San Pancho that guests expect include: Wifi. Lacking these (this) could significantly impact bookings.
- Popular amenities like Air conditioning, Kitchen, Pool are common but not universal. Offering these can provide a competitive edge.
- A pool is a highly desired but not standard amenity, making it a key feature for attracting guests seeking leisure in San Pancho.
Recommendations for Hosts
- Ensure your listing includes all essential amenities for San Pancho: Wifi.
- Consider adding popular differentiators like Air conditioning or Kitchen to increase appeal.
- Highlight unique or less common amenities you offer (e.g., hot tub, dedicated workspace, EV charger) in your listing description and photos.
- Regularly check competitor amenities in San Pancho to stay competitive.
San Pancho Airbnb Guest Demographics & Profile Analysis (2026)
Guest Profile Summary for San Pancho
- The typical guest profile for Airbnb in San Pancho consists of a mix of domestic (61%) and international guests, often arriving from nearby Guadalajara, typically belonging to the Post-2000s (Gen Z/Alpha) group (50%), primarily speaking English or Spanish.
- Domestic travelers account for 61.3% of guests.
- Key international markets include Mexico (61.3%) and United States (19.7%).
- Top languages spoken are English (46.2%) followed by Spanish (37.5%).
- A significant demographic segment is the Post-2000s (Gen Z/Alpha) group, representing 50% of guests.
Recommendations for Hosts
- Target domestic marketing efforts towards travelers from Guadalajara and Zapopan.
- Tailor amenities and listing descriptions to appeal to the dominant Post-2000s (Gen Z/Alpha) demographic (e.g., highlight fast WiFi, smart home features, local guides).
- Highlight unique local experiences or amenities relevant to the primary guest profile.
- Consider seasonal promotions aligned with peak travel times for key origin markets.
Nearby Short-Term Rental Market Comparison
How does the San Pancho Airbnb market stack up against its neighbors? Compare key performance metrics like average monthly revenue, ADR, and occupancy rates in surrounding areas to understand the broader regional STR landscape.
| Market | Active Properties | Monthly Revenue | Daily Rate | Avg. Occupancy |
|---|---|---|---|---|
| Punta de Mita | 85 | $5,500 | $907.19 | 33% |
| Punta Mita | 59 | $4,799 | $745.36 | 36% |
| Corral del Risco | 426 | $4,409 | $702.37 | 32% |
| Higuera Blanca | 33 | $4,340 | $603.84 | 29% |
| Nayarit | 30 | $2,820 | $578.35 | 28% |
| Boca de Tomatlán | 276 | $2,486 | $344.01 | 36% |
| Litibu | 16 | $2,222 | $255.60 | 39% |
| Cruz de Huanacaxtle | 14 | $2,156 | $378.26 | 30% |
| Sayulita | 1,465 | $2,003 | $242.17 | 38% |
| Punta Perula | 10 | $1,979 | $160.38 | 36% |