Tlayecac Airbnb Market Analysis 2026: Short Term Rental Data & Vacation Rental Statistics in Morelos, Mexico
Is Airbnb profitable in Tlayecac in 2026? Explore comprehensive Airbnb analytics for Tlayecac, Morelos, Mexico to uncover income potential. This 2026 STR market report for Tlayecac, based on AirROI data from February 2025 to January 2026, reveals key trends in the niche market of 41 active listings.
Whether you're considering an Airbnb investment in Tlayecac, optimizing your existing vacation rental, or exploring rental arbitrage opportunities, understanding the Tlayecac Airbnb data is crucial. Leveraging the low regulation environment is key to maximizing your short term rental income potential. Let's dive into the specifics.
Key Tlayecac Airbnb Performance Metrics Overview
Monthly Airbnb Revenue Variations & Income Potential in Tlayecac (2026)
Understanding the monthly revenue variations for Airbnb listings in Tlayecac is key to maximizing your short term rental income potential. Seasonality significantly impacts earnings. Our analysis, based on data from the past 12 months, shows that the peak revenue month for STRs in Tlayecac is typically December, while February often presents the lowest earnings, highlighting opportunities for strategic pricing adjustments during shoulder and low seasons. Explore the typical Airbnb income in Tlayecac across different performance tiers:
- Best-in-class properties (Top 10%) achieve $1,302+ monthly, often utilizing dynamic pricing and superior guest experiences.
- Strong performing properties (Top 25%) earn $784 or more, indicating effective management and desirable locations/amenities.
- Typical properties (Median) generate around $364 per month, representing the average market performance.
- Entry-level properties (Bottom 25%) see earnings around $182, often with potential for optimization.
Average Monthly Airbnb Earnings Trend in Tlayecac
Tlayecac Airbnb Occupancy Rate Trends (2026)
Maximize your bookings by understanding the Tlayecac STR occupancy trends. Seasonal demand shifts significantly influence how often properties are booked. Typically, Aprilsees the highest demand (peak season occupancy), while January experiences the lowest (low season). Effective strategies, like adjusting minimum stays or offering promotions, can boost occupancy during slower periods. Here's how different property tiers perform in Tlayecac:
- Best-in-class properties (Top 10%) achieve 48%+ occupancy, indicating high desirability and potentially optimized availability.
- Strong performing properties (Top 25%) maintain 30% or higher occupancy, suggesting good market fit and guest satisfaction.
- Typical properties (Median) have an occupancy rate around 15%.
- Entry-level properties (Bottom 25%) average 9% occupancy, potentially facing higher vacancy.
Average Monthly Occupancy Rate Trend in Tlayecac
Average Daily Rate (ADR) Airbnb Trends in Tlayecac (2026)
Effective short term rental pricing strategy in Tlayecac involves understanding monthly ADR fluctuations. The Average Daily Rate (ADR) for Airbnb in Tlayecac typically peaks in December and dips lowest during March. Leveraging Airbnb dynamic pricing tools or strategies based on this seasonality can significantly boost revenue. Here's a look at the typical nightly rates achieved:
- Best-in-class properties (Top 10%) command rates of $186+ per night, often due to premium features or locations.
- Strong performing properties (Top 25%) achieve nightly rates of $94 or more.
- Typical properties (Median) charge around $71 per night.
- Entry-level properties (Bottom 25%) earn around $56 per night.
Average Daily Rate (ADR) Trend by Month in Tlayecac
Get Live Tlayecac Market Intelligence 👇

Explore Real-time Analytics
Airbnb Seasonality Analysis & Trends in Tlayecac (2026)
Peak Season (December, August, January)
- Revenue averages $947 per month
- Occupancy rates average 21.5%
- Daily rates average $99
Shoulder Season
- Revenue averages $717 per month
- Occupancy maintains around 21.4%
- Daily rates hold near $94
Low Season (February, March, May)
- Revenue drops to average $590 per month
- Occupancy decreases to average 23.0%
- Daily rates adjust to average $87
Seasonality Insights for Tlayecac
- The Airbnb seasonality in Tlayecac shows highly seasonal trends requiring careful strategy. While the sections above show seasonal averages, it's also insightful to look at the extremes:
- During the high season, the absolute peak month showcases Tlayecac's highest earning potential, with monthly revenues capable of climbing to $1,154, occupancy reaching a high of 27.8%, and ADRs peaking at $103.
- Conversely, the slowest single month of the year, typically falling within the low season, marks the market's lowest point. In this month, revenue might dip to $540, occupancy could drop to 16.9%, and ADRs may adjust down to $86.
- Understanding both the seasonal averages and these monthly peaks and troughs in revenue, occupancy, and ADR is crucial for maximizing your Airbnb profit potential in Tlayecac.
Seasonal Strategies for Maximizing Profit
- Peak Season: Maximize revenue through premium pricing and potentially longer minimum stays. Ensure high availability.
- Low Season: Offer competitive pricing, special promotions (e.g., extended stay discounts), and flexible cancellation policies. Target off-season travelers like remote workers or budget-conscious guests.
- Shoulder Seasons: Implement dynamic pricing that balances peak and low rates. Target weekend travelers or specific events. Offer slightly more flexible terms than peak season.
- Regularly analyze your own performance against these Tlayecac seasonality benchmarks and adjust your pricing and availability strategy accordingly.
Best Areas for Airbnb Investment in Tlayecac (2026)
Exploring the top neighborhoods for short-term rentals in Tlayecac? This section highlights key areas, outlining why they are attractive for hosts and guests, along with notable local attractions. Consider these locations based on your target guest profile and investment strategy.
| Neighborhood / Area | Why Host Here? (Target Guests & Appeal) | Key Attractions & Landmarks |
|---|---|---|
| Centro Tlayecac | A vibrant area with local culture, restaurants, and shops. Ideal for tourists wanting an authentic Mexican experience with easy access to local markets and festivities. | Cultural Festivals, Local Markets, Plaza Principal |
| Laguna de Tlayacapan | A picturesque location near the lagoon, perfect for eco-tourism and nature enthusiasts. Offers beautiful views and outdoor activities, attracting families and nature-focused travelers. | Laguna de Tlayacapan, Bird Watching, Hiking Trails |
| San Juan Tezel | A quaint neighborhood known for its traditional architecture and friendly atmosphere. Good for guests looking for a peaceful retreat away from the bustle of city life. | Church of San Juan Tezel, Traditional Cuisine, Local Artisans |
| Temazcal Spa Retreats | Known for wellness and traditional healing practices, this area attracts wellness tourists looking for a rejuvenating experience amidst nature. | Temazcal Sessions, Wellness Retreats, Natural Hot Springs |
| Historical Tlayacapan | Home to many historic buildings and museums, this area appeals to history buffs and tourists interested in learning about local culture and traditions. | Museo de la Ciudad, Historic Churches, Archaeological Sites |
| Nearby Cuernavaca Day Trips | Cuernavaca is just a short drive away and offers a wide array of attractions for tourists. Ideal for those wanting to explore the city while staying in Tlayecac. | Palacio de Cortés, Jardín Borda, Cuernavaca Cathedral |
| Cultural Workshops Area | Attracts guests interested in hands-on experiences such as cooking classes and artisan workshops. Great for cultural immersion. | Cooking Classes, Artisan Workshops, Cultural Exchange Programs |
| Local Vineyards | An emerging wine region near Tlayecac, perfect for wine lovers and those looking for unique experiences in wine tasting and vineyard tours. | Wine Tasting Tours, Vineyard Experiences, Gastronomic Events |
Understanding Airbnb License Requirements & STR Laws in Tlayecac (2026)
While Tlayecac, Morelos, Mexico currently shows low STR regulations, specific Airbnb license requirements might still exist or change. Always verify the latest short term rental regulations and Airbnb license requirements directly with local government authorities for Tlayecac to ensure full compliance before hosting.
(Source: AirROI data, 2026, finding no licensed listings among those analyzed)
Top Performing Airbnb Properties in Tlayecac (2026)
Benchmark your potential! Explore examples of top-performing Airbnb properties in Tlayecacbased on Trailing Twelve Month (TTM) revenue. Analyze their characteristics, revenue, occupancy rate, and ADR to understand what drives success in this market.
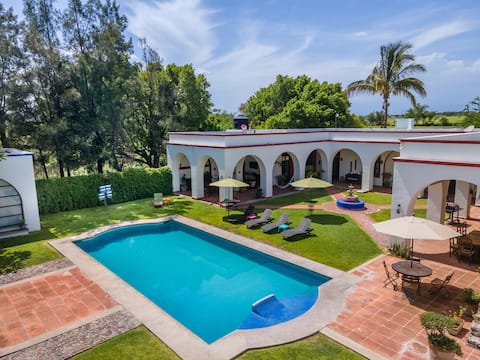
House in Morelos Near Tepoztlán "The Cloister"
Entire Place • 7 bedrooms
Finca Los Angeles de Ramón
Entire Place • 5 bedrooms
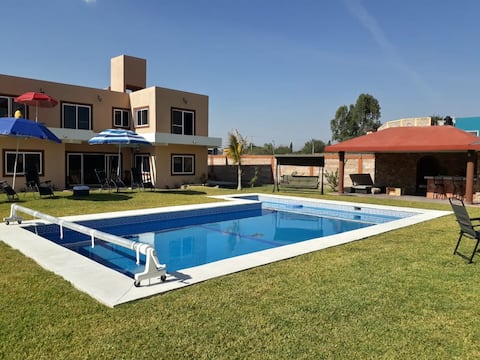
A house with a private heated pool, Oaxtepec
Entire Place • 4 bedrooms

A house full of energy for your days off
Entire Place • 3 bedrooms
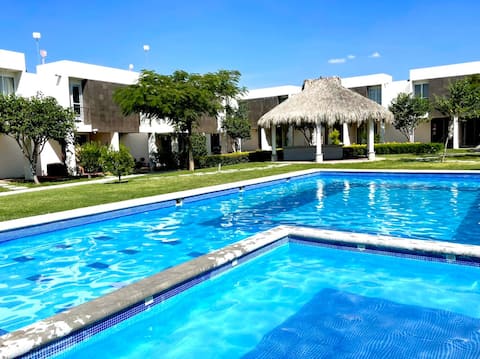
A house to rest or for weekends with a pool
Entire Place • 2 bedrooms

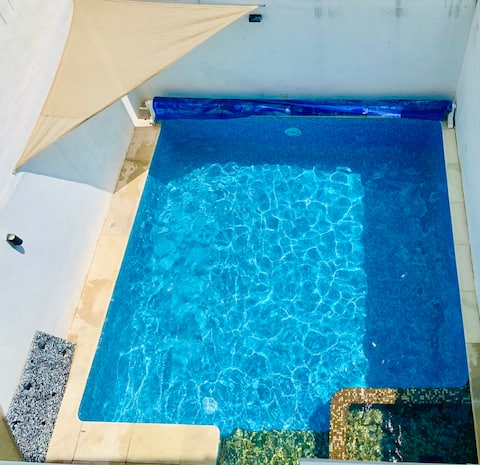
House with a fully-equipped pool for relaxation
Entire Place • 2 bedrooms
Note: Performance varies based on location, size, amenities, seasonality, and management quality. Data reflects the past 12 months.
Top Performing Airbnb Hosts in Tlayecac (2026)
Learn from the best! This table showcases top-performing Airbnb hosts in Tlayecac based on the number of properties managed and estimated total revenue over the past year. Analyze their scale and performance metrics.
| Host Name | Properties | Grossing Revenue | Stay Reviews | Avg Rating |
|---|---|---|---|---|
| Jorge Elizondo E. | 1 | $75,569 | 18 | 5.00/5.0 |
| Angeles | 1 | $21,293 | 84 | 4.87/5.0 |
| Claudia | 2 | $14,352 | 54 | 4.83/5.0 |
| Hugo | 1 | $12,247 | 60 | 4.72/5.0 |
| Bianca Rosa | 2 | $12,161 | 93 | 4.92/5.0 |
| Elizabeth | 1 | $6,745 | 46 | 4.91/5.0 |
| Julio | 2 | $5,816 | 57 | 4.87/5.0 |
| Oswaldo | 1 | $5,805 | 19 | 4.95/5.0 |
| Alberto | 1 | $4,993 | 2 | Not Rated |
| Lalo | 1 | $4,988 | 36 | 4.58/5.0 |
Analyzing the strategies of top hosts, such as their property selection, pricing, and guest communication, can offer valuable lessons for optimizing your own Airbnb operations in Tlayecac.
Dive Deeper: Advanced Tlayecac STR Market Data (2026)
Ready to unlock more insights? AirROI provides access to advanced metrics and comprehensive Airbnb data for Tlayecac. Explore detailed analytics beyond this report to refine your investment strategy, optimize pricing, and maximize your vacation rental profits.
Explore Advanced MetricsTlayecac Short-Term Rental Market Composition (2026): Property & Room Types
Room Type Distribution
Property Type Distribution
Market Composition Insights for Tlayecac
- The Tlayecac Airbnb market composition is heavily skewed towards Entire Home/Apt listings, which make up 100% of the 41 active rentals. This indicates strong guest preference for privacy and space.
- Looking at the property type distribution in Tlayecac, House properties are the most common (90.2%), reflecting the local real estate landscape.
- Houses represent a significant 90.2% portion, catering likely to families or larger groups.
- Smaller segments like others (combined 2.4%) offer potential for unique stay experiences.
Tlayecac Airbnb Room Capacity Analysis (2026): Bedroom Distribution
Distribution of Listings by Number of Bedrooms
Room Capacity Insights for Tlayecac
- The dominant room capacity in Tlayecac is 2 bedrooms listings, making up 48.8% of the market. This suggests a strong demand for properties suitable for couples or solo travelers.
- Together, 2 bedrooms and 3 bedrooms properties represent 80.5% of the active Airbnb listings in Tlayecac, indicating a high concentration in these sizes.
- A significant 51.2% of listings offer 3+ bedrooms, catering to larger groups and families seeking more space in Tlayecac.
Tlayecac Vacation Rental Guest Capacity Trends (2026)
Distribution of Listings by Guest Capacity
Guest Capacity Insights for Tlayecac
- The most common guest capacity trend in Tlayecac vacation rentals is listings accommodating 8+ guests (48.8%). This suggests the primary traveler segment is likely larger groups.
- Properties designed for 8+ guests and 6 guests dominate the Tlayecac STR market, accounting for 82.9% of listings.
- 87.8% of properties accommodate 6+ guests, serving the market segment for larger families or group travel in Tlayecac.
- On average, properties in Tlayecac are equipped to host 6.8 guests.
Tlayecac Airbnb Booking Patterns (2026): Available vs. Booked Days
Available Days Distribution
Booked Days Distribution
Booking Pattern Insights for Tlayecac
- The most common availability pattern in Tlayecac falls within the 271-366 days range, representing 87.8% of listings. This suggests many properties have significant open periods on their calendars.
- Approximately 100.0% of listings show high availability (181+ days open annually), indicating potential for increased bookings or specific owner usage patterns.
- For booked days, the 31-90 days range is most frequent in Tlayecac (48.8%), reflecting common guest stay durations or potential owner blocking patterns.
Tlayecac Airbnb Minimum Stay Requirements Analysis
Distribution of Listings by Minimum Night Requirement
1 Night
22 listings
53.7% of total
2 Nights
15 listings
36.6% of total
30+ Nights
4 listings
9.8% of total
Key Insights
- The most prevalent minimum stay requirement in Tlayecac is 1 Night, adopted by 53.7% of listings. This highlights the market's preference for shorter, flexible bookings.
- A strong majority (90.3%) of the Tlayecac Airbnb data shows acceptance of very short stays (1-2 nights), indicating a dynamic, high-turnover market.
Recommendations
- Align with the market by considering a 1 Night minimum stay, as 53.7% of Tlayecac hosts use this setting.
- Explore offering discounts for stays of 30+ nights to attract the 9.8% of the market seeking extended stays.
- Adjust minimum nights based on seasonality – potentially shorter during low season and longer during peak demand periods in Tlayecac.
Tlayecac Airbnb Cancellation Policy Trends Analysis (2026)
Flexible
16 listings
39% of total
Moderate
17 listings
41.5% of total
Firm
7 listings
17.1% of total
Strict
1 listings
2.4% of total
Cancellation Policy Insights for Tlayecac
- The prevailing Airbnb cancellation policy trend in Tlayecac is Moderate, used by 41.5% of listings.
- The market strongly favors guest-friendly terms, with 80.5% of listings offering Flexible or Moderate policies. This suggests guests in Tlayecac may expect booking flexibility.
- Strict cancellation policies are quite rare (2.4%), potentially making listings with this policy less competitive unless justified by high demand or property type.
Recommendations for Hosts
- Consider adopting a Moderate policy to align with the 41.5% market standard in Tlayecac.
- Using a Strict policy might deter some guests, as only 2.4% of listings use it. Evaluate if potential revenue protection outweighs possible lower booking rates.
- Regularly review your cancellation policy against competitors and market demand shifts in Tlayecac.
Tlayecac STR Booking Lead Time Analysis (2026)
Average Booking Lead Time by Month
Booking Lead Time Insights for Tlayecac
- The overall average booking lead time for vacation rentals in Tlayecac is 15 days.
- Guests book furthest in advance for stays during December (average 27 days), likely coinciding with peak travel demand or local events.
- The shortest booking windows occur for stays in July (average 9 days), indicating more last-minute travel plans during this time.
- Seasonally, Winter (17 days avg.) sees the longest lead times, while Summer (14 days avg.) has the shortest, reflecting typical travel planning cycles.
Recommendations for Hosts
- Use the overall average lead time (15 days) as a baseline for your pricing and availability strategy in Tlayecac.
- For December stays, consider implementing length-of-stay discounts or slightly higher rates for bookings made less than 27 days out to capitalize on advance planning.
- Target marketing efforts for the Winter season well in advance (at least 17 days) to capture early planners.
- Monitor your own booking lead times against these Tlayecac averages to identify opportunities for dynamic pricing adjustments.
Popular & Essential Airbnb Amenities in Tlayecac (2026)
Amenity Prevalence
Amenity Insights for Tlayecac
- Essential amenities in Tlayecac that guests expect include: Pool, Kitchen, Free parking on premises, TV. Lacking these (any) could significantly impact bookings.
- Popular amenities like Wifi, Dishes and silverware, Cooking basics are common but not universal. Offering these can provide a competitive edge.
- Warning: Wifi is not universally provided but is considered essential globally. Ensure reliable Wifi is offered.
Recommendations for Hosts
- Ensure your listing includes all essential amenities for Tlayecac: Pool, Kitchen, Free parking on premises, TV.
- Prioritize adding missing essentials: Kitchen, Free parking on premises, TV.
- Consider adding popular differentiators like Wifi or Dishes and silverware to increase appeal.
- Highlight unique or less common amenities you offer (e.g., hot tub, dedicated workspace, EV charger) in your listing description and photos.
- Regularly check competitor amenities in Tlayecac to stay competitive.
Tlayecac Airbnb Guest Demographics & Profile Analysis (2026)
Guest Profile Summary for Tlayecac
- The typical guest profile for Airbnb in Tlayecac consists of primarily domestic travelers (96%), often arriving from nearby Mexico City, typically belonging to the Post-2000s (Gen Z/Alpha) group (50%), primarily speaking Spanish or English.
- Domestic travelers account for 96.4% of guests.
- Key international markets include Mexico (96.4%) and United States (1.8%).
- Top languages spoken are Spanish (49.4%) followed by English (42.7%).
- A significant demographic segment is the Post-2000s (Gen Z/Alpha) group, representing 50% of guests.
Recommendations for Hosts
- Target domestic marketing efforts towards travelers from Mexico City and Guadalajara.
- Tailor amenities and listing descriptions to appeal to the dominant Post-2000s (Gen Z/Alpha) demographic (e.g., highlight fast WiFi, smart home features, local guides).
- Highlight unique local experiences or amenities relevant to the primary guest profile.
- Consider seasonal promotions aligned with peak travel times for key origin markets.
Nearby Short-Term Rental Market Comparison
How does the Tlayecac Airbnb market stack up against its neighbors? Compare key performance metrics like average monthly revenue, ADR, and occupancy rates in surrounding areas to understand the broader regional STR landscape.
| Market | Active Properties | Monthly Revenue | Daily Rate | Avg. Occupancy |
|---|---|---|---|---|
| Tepeji del Rio de Ocampo | 11 | $2,125 | $315.80 | 27% |
| Yautepec de Zaragoza | 16 | $2,032 | $269.32 | 26% |
| Xalmolonco | 24 | $1,944 | $281.85 | 28% |
| Rancho San Diego | 21 | $1,707 | $276.31 | 26% |
| Lomas de Cocoyoc | 137 | $1,662 | $258.05 | 28% |
| La Ladrillera | 28 | $1,655 | $277.53 | 26% |
| Atlatlahucan | 74 | $1,598 | $289.72 | 24% |
| Nepantla de Sor Juana Inés de la Cruz | 10 | $1,584 | $207.92 | 25% |
| Granjas Mérida | 22 | $1,571 | $240.97 | 30% |
| San Andrés de la Cal | 11 | $1,478 | $253.64 | 25% |