Emiliano Zapata Airbnb Market Analysis 2026: Short Term Rental Data & Vacation Rental Statistics in Morelos, Mexico
Is Airbnb profitable in Emiliano Zapata in 2026? Explore comprehensive Airbnb analytics for Emiliano Zapata, Morelos, Mexico to uncover income potential. This 2026 STR market report for Emiliano Zapata, based on AirROI data from February 2025 to January 2026, reveals key trends in the niche market of 99 active listings.
Whether you're considering an Airbnb investment in Emiliano Zapata, optimizing your existing vacation rental, or exploring rental arbitrage opportunities, understanding the Emiliano Zapata Airbnb data is crucial. Leveraging the low regulation environment is key to maximizing your short term rental income potential. Let's dive into the specifics.
Key Emiliano Zapata Airbnb Performance Metrics Overview
Monthly Airbnb Revenue Variations & Income Potential in Emiliano Zapata (2026)
Understanding the monthly revenue variations for Airbnb listings in Emiliano Zapata is key to maximizing your short term rental income potential. Seasonality significantly impacts earnings. Our analysis, based on data from the past 12 months, shows that the peak revenue month for STRs in Emiliano Zapata is typically April, while November often presents the lowest earnings, highlighting opportunities for strategic pricing adjustments during shoulder and low seasons. Explore the typical Airbnb income in Emiliano Zapata across different performance tiers:
- Best-in-class properties (Top 10%) achieve $2,166+ monthly, often utilizing dynamic pricing and superior guest experiences.
- Strong performing properties (Top 25%) earn $1,344 or more, indicating effective management and desirable locations/amenities.
- Typical properties (Median) generate around $644 per month, representing the average market performance.
- Entry-level properties (Bottom 25%) see earnings around $297, often with potential for optimization.
Average Monthly Airbnb Earnings Trend in Emiliano Zapata
Emiliano Zapata Airbnb Occupancy Rate Trends (2026)
Maximize your bookings by understanding the Emiliano Zapata STR occupancy trends. Seasonal demand shifts significantly influence how often properties are booked. Typically, Aprilsees the highest demand (peak season occupancy), while January experiences the lowest (low season). Effective strategies, like adjusting minimum stays or offering promotions, can boost occupancy during slower periods. Here's how different property tiers perform in Emiliano Zapata:
- Best-in-class properties (Top 10%) achieve 48%+ occupancy, indicating high desirability and potentially optimized availability.
- Strong performing properties (Top 25%) maintain 34% or higher occupancy, suggesting good market fit and guest satisfaction.
- Typical properties (Median) have an occupancy rate around 20%.
- Entry-level properties (Bottom 25%) average 11% occupancy, potentially facing higher vacancy.
Average Monthly Occupancy Rate Trend in Emiliano Zapata
Average Daily Rate (ADR) Airbnb Trends in Emiliano Zapata (2026)
Effective short term rental pricing strategy in Emiliano Zapata involves understanding monthly ADR fluctuations. The Average Daily Rate (ADR) for Airbnb in Emiliano Zapata typically peaks in December and dips lowest during March. Leveraging Airbnb dynamic pricing tools or strategies based on this seasonality can significantly boost revenue. Here's a look at the typical nightly rates achieved:
- Best-in-class properties (Top 10%) command rates of $285+ per night, often due to premium features or locations.
- Strong performing properties (Top 25%) achieve nightly rates of $195 or more.
- Typical properties (Median) charge around $113 per night.
- Entry-level properties (Bottom 25%) earn around $57 per night.
Average Daily Rate (ADR) Trend by Month in Emiliano Zapata
Get Live Emiliano Zapata Market Intelligence 👇

Explore Real-time Analytics
Airbnb Seasonality Analysis & Trends in Emiliano Zapata (2026)
Peak Season (April, December, July)
- Revenue averages $1,306 per month
- Occupancy rates average 29.8%
- Daily rates average $147
Shoulder Season
- Revenue averages $939 per month
- Occupancy maintains around 24.4%
- Daily rates hold near $143
Low Season (January, October, November)
- Revenue drops to average $778 per month
- Occupancy decreases to average 19.3%
- Daily rates adjust to average $154
Seasonality Insights for Emiliano Zapata
- The Airbnb seasonality in Emiliano Zapata shows highly seasonal trends requiring careful strategy. While the sections above show seasonal averages, it's also insightful to look at the extremes:
- During the high season, the absolute peak month showcases Emiliano Zapata's highest earning potential, with monthly revenues capable of climbing to $1,467, occupancy reaching a high of 36.0%, and ADRs peaking at $157.
- Conversely, the slowest single month of the year, typically falling within the low season, marks the market's lowest point. In this month, revenue might dip to $772, occupancy could drop to 17.0%, and ADRs may adjust down to $136.
- Understanding both the seasonal averages and these monthly peaks and troughs in revenue, occupancy, and ADR is crucial for maximizing your Airbnb profit potential in Emiliano Zapata.
Seasonal Strategies for Maximizing Profit
- Peak Season: Maximize revenue through premium pricing and potentially longer minimum stays. Ensure high availability.
- Low Season: Offer competitive pricing, special promotions (e.g., extended stay discounts), and flexible cancellation policies. Target off-season travelers like remote workers or budget-conscious guests.
- Shoulder Seasons: Implement dynamic pricing that balances peak and low rates. Target weekend travelers or specific events. Offer slightly more flexible terms than peak season.
- Regularly analyze your own performance against these Emiliano Zapata seasonality benchmarks and adjust your pricing and availability strategy accordingly.
Best Areas for Airbnb Investment in Emiliano Zapata (2026)
Exploring the top neighborhoods for short-term rentals in Emiliano Zapata? This section highlights key areas, outlining why they are attractive for hosts and guests, along with notable local attractions. Consider these locations based on your target guest profile and investment strategy.
| Neighborhood / Area | Why Host Here? (Target Guests & Appeal) | Key Attractions & Landmarks |
|---|---|---|
| El Centro | The vibrant heart of Emiliano Zapata, perfect for visitors who want to experience local culture, markets, and dining. Proximity to various attractions makes it ideal. | Main Square, Local Markets, Church of San Juan Bautista, Restaurants and Cafés |
| Jardines de Xochitepec | A beautiful residential area surrounded by nature, offering a serene atmosphere for visitors seeking relaxation and outdoor activities. | Xochitepec Botanical Garden, Natural Parks, Hiking Trails, Local Cuisine |
| Laguna de Tequesquitengo | Known for its stunning lagoon, this area is popular for water sports and leisure activities, attracting tourists looking for a waterfront experience. | Tequesquitengo Lagoon, Water Sports, Dining by the Water, Boat Rentals |
| Santa Rosa | A charming neighborhood with a local feel, providing an authentic experience of life in Morelos, great for families and long-term visitors. | Local Parks, Traditional Markets, Cultural Events, Family-friendly Restaurants |
| Tepoztlán | Nearby mystical town renowned for its spirituality and natural beauty, making it a sought-after retreat for tourists from around the world. | Tepoztlán Pyramid, Local Artisan Shops, Natural Springs, Hiking Trails |
| Morelos State Park | A vast natural park perfect for ecotourism, encouraging outdoor activities and nature enjoyment, attracting adventure seekers. | Hiking Trails, Camping Areas, Wildlife Watching, Picnic Spots |
| Amacuzac | Known for its archaeological sites and cultural heritage, attracting tourists interested in history and adventure outside the city. | Archaeological Sites, Local Festivals, Historical Tours, Natural Scenery |
| Popocatepetl National Park | A stunning natural area ideal for hiking, photography, and nature enthusiasts, providing amazing views of the volcano and diverse ecosystems. | Popocatepetl Volcano, Hiking Trails, Scenic Views, Flora and Fauna Tours |
Understanding Airbnb License Requirements & STR Laws in Emiliano Zapata (2026)
While Emiliano Zapata, Morelos, Mexico currently shows low STR regulations, specific Airbnb license requirements might still exist or change. Always verify the latest short term rental regulations and Airbnb license requirements directly with local government authorities for Emiliano Zapata to ensure full compliance before hosting.
(Source: AirROI data, 2026, finding no licensed listings among those analyzed)
Top Performing Airbnb Properties in Emiliano Zapata (2026)
Benchmark your potential! Explore examples of top-performing Airbnb properties in Emiliano Zapatabased on Trailing Twelve Month (TTM) revenue. Analyze their characteristics, revenue, occupancy rate, and ADR to understand what drives success in this market.

Peacock Sanctuary
Entire Place • 9 bedrooms

Amazing family vacation home with a pool.
Entire Place • 4 bedrooms

Paraiso Cuernavaca Apartment
Entire Place • 4 bedrooms
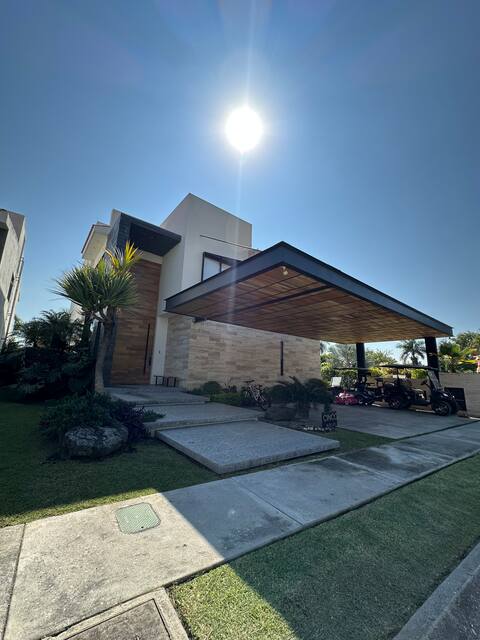
Unparalleled House in Campo Golf
Entire Place • 4 bedrooms
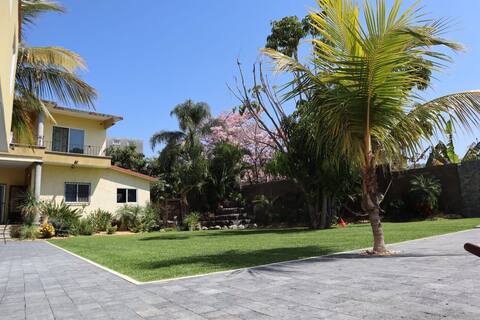
“Paraiso” Weekend House
Entire Place • 5 bedrooms

Modena residence, jacuzzi. Spectacular view
Entire Place • 4 bedrooms
Note: Performance varies based on location, size, amenities, seasonality, and management quality. Data reflects the past 12 months.
Top Performing Airbnb Hosts in Emiliano Zapata (2026)
Learn from the best! This table showcases top-performing Airbnb hosts in Emiliano Zapata based on the number of properties managed and estimated total revenue over the past year. Analyze their scale and performance metrics.
| Host Name | Properties | Grossing Revenue | Stay Reviews | Avg Rating |
|---|---|---|---|---|
| Fernanda | 2 | $58,198 | 70 | 4.89/5.0 |
| Esteban | 1 | $39,514 | 47 | 4.66/5.0 |
| Javier | 3 | $39,071 | 137 | 4.91/5.0 |
| Federico | 2 | $33,954 | 46 | 4.87/5.0 |
| Gabriel | 1 | $29,283 | 9 | 5.00/5.0 |
| Rebeca | 1 | $29,038 | 4 | 4.75/5.0 |
| Isaac | 1 | $28,154 | 28 | 4.79/5.0 |
| Moisés | 1 | $22,923 | 283 | 4.89/5.0 |
| Diana | 1 | $18,814 | 68 | 4.47/5.0 |
| María | 1 | $18,488 | 76 | 4.88/5.0 |
Analyzing the strategies of top hosts, such as their property selection, pricing, and guest communication, can offer valuable lessons for optimizing your own Airbnb operations in Emiliano Zapata.
Dive Deeper: Advanced Emiliano Zapata STR Market Data (2026)
Ready to unlock more insights? AirROI provides access to advanced metrics and comprehensive Airbnb data for Emiliano Zapata. Explore detailed analytics beyond this report to refine your investment strategy, optimize pricing, and maximize your vacation rental profits.
Explore Advanced MetricsEmiliano Zapata Short-Term Rental Market Composition (2026): Property & Room Types
Room Type Distribution
Property Type Distribution
Market Composition Insights for Emiliano Zapata
- The Emiliano Zapata Airbnb market composition is heavily skewed towards Entire Home/Apt listings, which make up 98% of the 99 active rentals. This indicates strong guest preference for privacy and space.
- Looking at the property type distribution in Emiliano Zapata, House properties are the most common (67.7%), reflecting the local real estate landscape.
- Houses represent a significant 67.7% portion, catering likely to families or larger groups.
- Smaller segments like others, unique stays, hotel/boutique (combined 3.0%) offer potential for unique stay experiences.
Emiliano Zapata Airbnb Room Capacity Analysis (2026): Bedroom Distribution
Distribution of Listings by Number of Bedrooms
Room Capacity Insights for Emiliano Zapata
- The dominant room capacity in Emiliano Zapata is 3 bedrooms listings, making up 46.5% of the market. This suggests a strong demand for properties suitable for families or small groups.
- Together, 3 bedrooms and 2 bedrooms properties represent 74.8% of the active Airbnb listings in Emiliano Zapata, indicating a high concentration in these sizes.
- A significant 66.7% of listings offer 3+ bedrooms, catering to larger groups and families seeking more space in Emiliano Zapata.
Emiliano Zapata Vacation Rental Guest Capacity Trends (2026)
Distribution of Listings by Guest Capacity
Guest Capacity Insights for Emiliano Zapata
- The most common guest capacity trend in Emiliano Zapata vacation rentals is listings accommodating 8+ guests (43.4%). This suggests the primary traveler segment is likely larger groups.
- Properties designed for 8+ guests and 6 guests dominate the Emiliano Zapata STR market, accounting for 67.6% of listings.
- 75.7% of properties accommodate 6+ guests, serving the market segment for larger families or group travel in Emiliano Zapata.
- On average, properties in Emiliano Zapata are equipped to host 6.4 guests.
Emiliano Zapata Airbnb Booking Patterns (2026): Available vs. Booked Days
Available Days Distribution
Booked Days Distribution
Booking Pattern Insights for Emiliano Zapata
- The most common availability pattern in Emiliano Zapata falls within the 271-366 days range, representing 81.8% of listings. This suggests many properties have significant open periods on their calendars.
- Approximately 97.0% of listings show high availability (181+ days open annually), indicating potential for increased bookings or specific owner usage patterns.
- For booked days, the 31-90 days range is most frequent in Emiliano Zapata (49.5%), reflecting common guest stay durations or potential owner blocking patterns.
- A notable 3.0% of properties secure long booking periods (181+ days booked per year), highlighting successful long-term rental strategies or significant owner usage.
Emiliano Zapata Airbnb Minimum Stay Requirements Analysis
Distribution of Listings by Minimum Night Requirement
1 Night
42 listings
42.4% of total
2 Nights
40 listings
40.4% of total
3 Nights
4 listings
4% of total
4-6 Nights
1 listings
1% of total
7-29 Nights
1 listings
1% of total
30+ Nights
11 listings
11.1% of total
Key Insights
- The most prevalent minimum stay requirement in Emiliano Zapata is 1 Night, adopted by 42.4% of listings. This highlights the market's preference for shorter, flexible bookings.
- A strong majority (82.8%) of the Emiliano Zapata Airbnb data shows acceptance of very short stays (1-2 nights), indicating a dynamic, high-turnover market.
- A significant segment (11.1%) caters to monthly stays (30+ nights) in Emiliano Zapata, pointing to opportunities in the extended-stay market.
Recommendations
- Align with the market by considering a 1 Night minimum stay, as 42.4% of Emiliano Zapata hosts use this setting.
- Explore offering discounts for stays of 30+ nights to attract the 11.1% of the market seeking extended stays.
- Adjust minimum nights based on seasonality – potentially shorter during low season and longer during peak demand periods in Emiliano Zapata.
Emiliano Zapata Airbnb Cancellation Policy Trends Analysis (2026)
Limited
1 listings
1% of total
Flexible
37 listings
37.8% of total
Moderate
41 listings
41.8% of total
Firm
16 listings
16.3% of total
Strict
3 listings
3.1% of total
Cancellation Policy Insights for Emiliano Zapata
- The prevailing Airbnb cancellation policy trend in Emiliano Zapata is Moderate, used by 41.8% of listings.
- The market strongly favors guest-friendly terms, with 79.6% of listings offering Flexible or Moderate policies. This suggests guests in Emiliano Zapata may expect booking flexibility.
- Strict cancellation policies are quite rare (3.1%), potentially making listings with this policy less competitive unless justified by high demand or property type.
Recommendations for Hosts
- Consider adopting a Moderate policy to align with the 41.8% market standard in Emiliano Zapata.
- Using a Strict policy might deter some guests, as only 3.1% of listings use it. Evaluate if potential revenue protection outweighs possible lower booking rates.
- Regularly review your cancellation policy against competitors and market demand shifts in Emiliano Zapata.
Emiliano Zapata STR Booking Lead Time Analysis (2026)
Average Booking Lead Time by Month
Booking Lead Time Insights for Emiliano Zapata
- The overall average booking lead time for vacation rentals in Emiliano Zapata is 22 days.
- Guests book furthest in advance for stays during December (average 43 days), likely coinciding with peak travel demand or local events.
- The shortest booking windows occur for stays in February (average 11 days), indicating more last-minute travel plans during this time.
- Seasonally, Fall (27 days avg.) sees the longest lead times, while Summer (18 days avg.) has the shortest, reflecting typical travel planning cycles.
Recommendations for Hosts
- Use the overall average lead time (22 days) as a baseline for your pricing and availability strategy in Emiliano Zapata.
- For December stays, consider implementing length-of-stay discounts or slightly higher rates for bookings made less than 43 days out to capitalize on advance planning.
- During February, focus on last-minute booking availability and promotions, as guests book with very short notice (11 days avg.).
- Target marketing efforts for the Fall season well in advance (at least 27 days) to capture early planners.
- Monitor your own booking lead times against these Emiliano Zapata averages to identify opportunities for dynamic pricing adjustments.
Popular & Essential Airbnb Amenities in Emiliano Zapata (2026)
Amenity Prevalence
Amenity Insights for Emiliano Zapata
- Essential amenities in Emiliano Zapata that guests expect include: Free parking on premises, Kitchen. Lacking these (any) could significantly impact bookings.
- Popular amenities like Pool, TV, Wifi are common but not universal. Offering these can provide a competitive edge.
- A pool is a highly desired but not standard amenity, making it a key feature for attracting guests seeking leisure in Emiliano Zapata.
- Warning: Wifi is not universally provided but is considered essential globally. Ensure reliable Wifi is offered.
Recommendations for Hosts
- Ensure your listing includes all essential amenities for Emiliano Zapata: Free parking on premises, Kitchen.
- Prioritize adding missing essentials: Kitchen.
- Consider adding popular differentiators like Pool or TV to increase appeal.
- Highlight unique or less common amenities you offer (e.g., hot tub, dedicated workspace, EV charger) in your listing description and photos.
- Regularly check competitor amenities in Emiliano Zapata to stay competitive.
Emiliano Zapata Airbnb Guest Demographics & Profile Analysis (2026)
Guest Profile Summary for Emiliano Zapata
- The typical guest profile for Airbnb in Emiliano Zapata consists of primarily domestic travelers (94%), often arriving from nearby Mexico City, typically belonging to the Post-2000s (Gen Z/Alpha) group (50%), primarily speaking Spanish or English.
- Domestic travelers account for 94.2% of guests.
- Key international markets include Mexico (94.2%) and United States (3.2%).
- Top languages spoken are Spanish (55.7%) followed by English (33.7%).
- A significant demographic segment is the Post-2000s (Gen Z/Alpha) group, representing 50% of guests.
Recommendations for Hosts
- Target domestic marketing efforts towards travelers from Mexico City and Tlalnepantla de Baz.
- Tailor amenities and listing descriptions to appeal to the dominant Post-2000s (Gen Z/Alpha) demographic (e.g., highlight fast WiFi, smart home features, local guides).
- Highlight unique local experiences or amenities relevant to the primary guest profile.
- Consider seasonal promotions aligned with peak travel times for key origin markets.
Nearby Short-Term Rental Market Comparison
How does the Emiliano Zapata Airbnb market stack up against its neighbors? Compare key performance metrics like average monthly revenue, ADR, and occupancy rates in surrounding areas to understand the broader regional STR landscape.
| Market | Active Properties | Monthly Revenue | Daily Rate | Avg. Occupancy |
|---|---|---|---|---|
| El Santuario | 44 | $2,583 | $420.27 | 25% |
| Cerro Gordo | 38 | $2,183 | $438.64 | 21% |
| Tepeji del Rio de Ocampo | 11 | $2,125 | $315.80 | 27% |
| Yautepec de Zaragoza | 16 | $2,032 | $269.32 | 26% |
| Xalmolonco | 24 | $1,944 | $281.85 | 28% |
| Avandaro | 212 | $1,892 | $411.24 | 24% |
| Guerrero | 28 | $1,795 | $223.86 | 29% |
| Rancho San Diego | 21 | $1,707 | $276.31 | 26% |
| Lomas de Cocoyoc | 137 | $1,662 | $258.05 | 28% |
| La Ladrillera | 28 | $1,655 | $277.53 | 26% |