Chiconcuac Airbnb Market Analysis 2026: Short Term Rental Data & Vacation Rental Statistics in Morelos, Mexico
Is Airbnb profitable in Chiconcuac in 2026? Explore comprehensive Airbnb analytics for Chiconcuac, Morelos, Mexico to uncover income potential. This 2026 STR market report for Chiconcuac, based on AirROI data from February 2025 to January 2026, reveals key trends in the niche market of 156 active listings.
Whether you're considering an Airbnb investment in Chiconcuac, optimizing your existing vacation rental, or exploring rental arbitrage opportunities, understanding the Chiconcuac Airbnb data is crucial. Leveraging the low regulation environment is key to maximizing your short term rental income potential. Let's dive into the specifics.
Key Chiconcuac Airbnb Performance Metrics Overview
Monthly Airbnb Revenue Variations & Income Potential in Chiconcuac (2026)
Understanding the monthly revenue variations for Airbnb listings in Chiconcuac is key to maximizing your short term rental income potential. Seasonality significantly impacts earnings. Our analysis, based on data from the past 12 months, shows that the peak revenue month for STRs in Chiconcuac is typically December, while June often presents the lowest earnings, highlighting opportunities for strategic pricing adjustments during shoulder and low seasons. Explore the typical Airbnb income in Chiconcuac across different performance tiers:
- Best-in-class properties (Top 10%) achieve $3,581+ monthly, often utilizing dynamic pricing and superior guest experiences.
- Strong performing properties (Top 25%) earn $2,212 or more, indicating effective management and desirable locations/amenities.
- Typical properties (Median) generate around $1,171 per month, representing the average market performance.
- Entry-level properties (Bottom 25%) see earnings around $537, often with potential for optimization.
Average Monthly Airbnb Earnings Trend in Chiconcuac
Chiconcuac Airbnb Occupancy Rate Trends (2026)
Maximize your bookings by understanding the Chiconcuac STR occupancy trends. Seasonal demand shifts significantly influence how often properties are booked. Typically, Aprilsees the highest demand (peak season occupancy), while January experiences the lowest (low season). Effective strategies, like adjusting minimum stays or offering promotions, can boost occupancy during slower periods. Here's how different property tiers perform in Chiconcuac:
- Best-in-class properties (Top 10%) achieve 62%+ occupancy, indicating high desirability and potentially optimized availability.
- Strong performing properties (Top 25%) maintain 40% or higher occupancy, suggesting good market fit and guest satisfaction.
- Typical properties (Median) have an occupancy rate around 22%.
- Entry-level properties (Bottom 25%) average 12% occupancy, potentially facing higher vacancy.
Average Monthly Occupancy Rate Trend in Chiconcuac
Average Daily Rate (ADR) Airbnb Trends in Chiconcuac (2026)
Effective short term rental pricing strategy in Chiconcuac involves understanding monthly ADR fluctuations. The Average Daily Rate (ADR) for Airbnb in Chiconcuac typically peaks in December and dips lowest during March. Leveraging Airbnb dynamic pricing tools or strategies based on this seasonality can significantly boost revenue. Here's a look at the typical nightly rates achieved:
- Best-in-class properties (Top 10%) command rates of $357+ per night, often due to premium features or locations.
- Strong performing properties (Top 25%) achieve nightly rates of $257 or more.
- Typical properties (Median) charge around $164 per night.
- Entry-level properties (Bottom 25%) earn around $101 per night.
Average Daily Rate (ADR) Trend by Month in Chiconcuac
Get Live Chiconcuac Market Intelligence 👇

Explore Real-time Analytics
Airbnb Seasonality Analysis & Trends in Chiconcuac (2026)
Peak Season (December, April, March)
- Revenue averages $2,037 per month
- Occupancy rates average 34.1%
- Daily rates average $191
Shoulder Season
- Revenue averages $1,632 per month
- Occupancy maintains around 27.6%
- Daily rates hold near $195
Low Season (January, February, June)
- Revenue drops to average $1,343 per month
- Occupancy decreases to average 24.5%
- Daily rates adjust to average $190
Seasonality Insights for Chiconcuac
- The Airbnb seasonality in Chiconcuac shows moderate seasonality with distinct peak and low periods. While the sections above show seasonal averages, it's also insightful to look at the extremes:
- During the high season, the absolute peak month showcases Chiconcuac's highest earning potential, with monthly revenues capable of climbing to $2,246, occupancy reaching a high of 36.8%, and ADRs peaking at $209.
- Conversely, the slowest single month of the year, typically falling within the low season, marks the market's lowest point. In this month, revenue might dip to $1,231, occupancy could drop to 20.9%, and ADRs may adjust down to $179.
- Understanding both the seasonal averages and these monthly peaks and troughs in revenue, occupancy, and ADR is crucial for maximizing your Airbnb profit potential in Chiconcuac.
Seasonal Strategies for Maximizing Profit
- Peak Season: Maximize revenue through premium pricing and potentially longer minimum stays. Ensure high availability.
- Low Season: Offer competitive pricing, special promotions (e.g., extended stay discounts), and flexible cancellation policies. Target off-season travelers like remote workers or budget-conscious guests.
- Shoulder Seasons: Implement dynamic pricing that balances peak and low rates. Target weekend travelers or specific events. Offer slightly more flexible terms than peak season.
- Regularly analyze your own performance against these Chiconcuac seasonality benchmarks and adjust your pricing and availability strategy accordingly.
Best Areas for Airbnb Investment in Chiconcuac (2026)
Exploring the top neighborhoods for short-term rentals in Chiconcuac? This section highlights key areas, outlining why they are attractive for hosts and guests, along with notable local attractions. Consider these locations based on your target guest profile and investment strategy.
| Neighborhood / Area | Why Host Here? (Target Guests & Appeal) | Key Attractions & Landmarks |
|---|---|---|
| Centro de Chiconcuac | The heart of Chiconcuac, known for its local culture and accessibility. Ideal for visitors wanting to experience the authentic lifestyle of the town, with nearby markets and local restaurants. | Chiconcuac Market, Church of San Juan Bautista, Local artisan shops, Cultural festivals, Street food stalls |
| Tequesquitengo Lake | A popular destination for water sports and relaxation, attracting tourists looking for outdoor activities, making it a great spot for vacation rentals. | Tequesquitengo Lake activities, Jet skiing and boating, Restaurants with lake views, Family-friendly beaches, Picnic areas |
| Tepoztlán | A nearby town known for its mystical atmosphere and stunning landscape, it attracts tourists interested in wellness and spirituality, perfect for Airbnbs catering to retreats and relaxation. | Tepoztlán pyramid, Market with local crafts, Cultural events, Walks in nature, Wellness retreats |
| Cuernavaca | A nearby city with a rich history and beautiful weather, offering various attractions from gardens to museums. Appeals to those looking for cultural experiences and relaxation. | Palacio de Cortés, Jardín Borda, Catedral de Cuernavaca, Spanish language schools, Cultural festivals |
| Laguna de Zempoala | A serene natural area ideal for those looking to escape the city and enjoy nature. Great for eco-tourism and hosting eco-friendly accommodations. | Hiking trails, Camping areas, Boating and fishing opportunities, Local wildlife, Incredible views |
| Xochimilco | Famous for its canals and colorful boats, attracting visitors for its unique cultural experience. Great for short stays to explore the traditional Mexican lifestyle. | Xochimilco canals, Trajineras (colorful boats), Local food markets, Cultural events, Floriculture |
| Amatlán de Quetzalcóatl | Known for its pre-Hispanic history and beautiful landscapes, it appeals to travelers interested in history and hiking, making it suitable for cultural stays. | Historical ruins, Natural parks, Lush landscapes, Hiking opportunities, Local traditions |
| Oaxtepec | A town with water parks and recreational facilities, attracting families and tourists for short getaways. It offers a variety of options for family-friendly accommodations. | Six Flags Hurricane Harbor, Water parks, Local restaurants, Trail walking, Sports facilities |
Understanding Airbnb License Requirements & STR Laws in Chiconcuac (2026)
While Chiconcuac, Morelos, Mexico currently shows low STR regulations, specific Airbnb license requirements might still exist or change. Always verify the latest short term rental regulations and Airbnb license requirements directly with local government authorities for Chiconcuac to ensure full compliance before hosting.
(Source: AirROI data, 2026, based on 1% licensed listings)
Top Performing Airbnb Properties in Chiconcuac (2026)
Benchmark your potential! Explore examples of top-performing Airbnb properties in Chiconcuacbased on Trailing Twelve Month (TTM) revenue. Analyze their characteristics, revenue, occupancy rate, and ADR to understand what drives success in this market.
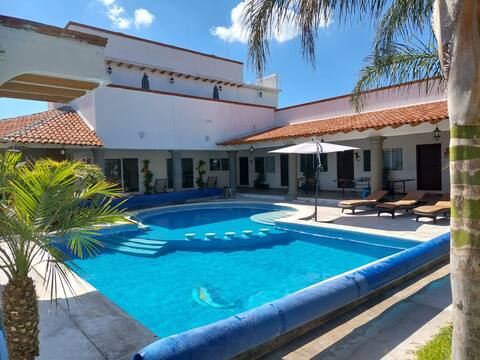
Magnificent Quinta "San Miguel" in Xochitepec, Mor
Entire Place • 4 bedrooms

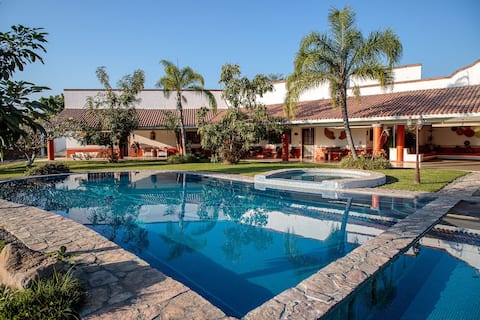
Casa Tomasa. Xochitepec, Morelos.
Entire Place • 6 bedrooms

New! Bamboo Kokopelli (Pool & Fun)
Entire Place • 4 bedrooms

Diego Rivera's House
Entire Place • 4 bedrooms

Splendid Villa "SantaJulia" in Xochitepec, Mor.
Entire Place • 5 bedrooms
Weekend house with pool and large garden
Entire Place • 9 bedrooms
Note: Performance varies based on location, size, amenities, seasonality, and management quality. Data reflects the past 12 months.
Top Performing Airbnb Hosts in Chiconcuac (2026)
Learn from the best! This table showcases top-performing Airbnb hosts in Chiconcuac based on the number of properties managed and estimated total revenue over the past year. Analyze their scale and performance metrics.
| Host Name | Properties | Grossing Revenue | Stay Reviews | Avg Rating |
|---|---|---|---|---|
| Miguel | 4 | $198,004 | 550 | 4.93/5.0 |
| Luis | 5 | $139,867 | 79 | 4.46/5.0 |
| Samantha | 1 | $92,491 | 34 | 4.85/5.0 |
| Erika | 4 | $90,222 | 489 | 4.81/5.0 |
| Uriel | 2 | $66,474 | 64 | 4.76/5.0 |
| Nash | 1 | $62,790 | 42 | 5.00/5.0 |
| Mariana | 2 | $61,767 | 5 | 4.00/5.0 |
| Alan | 1 | $44,594 | 57 | 4.67/5.0 |
| Fer Y Victor | 1 | $44,167 | 100 | 4.94/5.0 |
| Ana Karla | 2 | $43,094 | 23 | 4.63/5.0 |
Analyzing the strategies of top hosts, such as their property selection, pricing, and guest communication, can offer valuable lessons for optimizing your own Airbnb operations in Chiconcuac.
Dive Deeper: Advanced Chiconcuac STR Market Data (2026)
Ready to unlock more insights? AirROI provides access to advanced metrics and comprehensive Airbnb data for Chiconcuac. Explore detailed analytics beyond this report to refine your investment strategy, optimize pricing, and maximize your vacation rental profits.
Explore Advanced MetricsChiconcuac Short-Term Rental Market Composition (2026): Property & Room Types
Room Type Distribution
Property Type Distribution
Market Composition Insights for Chiconcuac
- The Chiconcuac Airbnb market composition is heavily skewed towards Entire Home/Apt listings, which make up 84% of the 156 active rentals. This indicates strong guest preference for privacy and space.
- Looking at the property type distribution in Chiconcuac, House properties are the most common (84%), reflecting the local real estate landscape.
- Houses represent a significant 84% portion, catering likely to families or larger groups.
- The presence of 12.8% Hotel/Boutique listings indicates integration with traditional hospitality.
- Smaller segments like others, outdoor/unique, apartment/condo, unique stays (combined 3.1%) offer potential for unique stay experiences.
Chiconcuac Airbnb Room Capacity Analysis (2026): Bedroom Distribution
Distribution of Listings by Number of Bedrooms
Room Capacity Insights for Chiconcuac
- The dominant room capacity in Chiconcuac is 3 bedrooms listings, making up 30.1% of the market. This suggests a strong demand for properties suitable for families or small groups.
- Together, 3 bedrooms and 5+ bedrooms properties represent 55.1% of the active Airbnb listings in Chiconcuac, indicating a high concentration in these sizes.
- A significant 73.7% of listings offer 3+ bedrooms, catering to larger groups and families seeking more space in Chiconcuac.
Chiconcuac Vacation Rental Guest Capacity Trends (2026)
Distribution of Listings by Guest Capacity
Guest Capacity Insights for Chiconcuac
- The most common guest capacity trend in Chiconcuac vacation rentals is listings accommodating 8+ guests (60.9%). This suggests the primary traveler segment is likely larger groups.
- Properties designed for 8+ guests and 6 guests dominate the Chiconcuac STR market, accounting for 78.2% of listings.
- 82.7% of properties accommodate 6+ guests, serving the market segment for larger families or group travel in Chiconcuac.
- On average, properties in Chiconcuac are equipped to host 6.6 guests.
Chiconcuac Airbnb Booking Patterns (2026): Available vs. Booked Days
Available Days Distribution
Booked Days Distribution
Booking Pattern Insights for Chiconcuac
- The most common availability pattern in Chiconcuac falls within the 271-366 days range, representing 71.8% of listings. This suggests many properties have significant open periods on their calendars.
- Approximately 88.5% of listings show high availability (181+ days open annually), indicating potential for increased bookings or specific owner usage patterns.
- For booked days, the 31-90 days range is most frequent in Chiconcuac (41%), reflecting common guest stay durations or potential owner blocking patterns.
- A notable 11.6% of properties secure long booking periods (181+ days booked per year), highlighting successful long-term rental strategies or significant owner usage.
Chiconcuac Airbnb Minimum Stay Requirements Analysis
Distribution of Listings by Minimum Night Requirement
1 Night
73 listings
46.8% of total
2 Nights
64 listings
41% of total
3 Nights
1 listings
0.6% of total
4-6 Nights
1 listings
0.6% of total
30+ Nights
17 listings
10.9% of total
Key Insights
- The most prevalent minimum stay requirement in Chiconcuac is 1 Night, adopted by 46.8% of listings. This highlights the market's preference for shorter, flexible bookings.
- A strong majority (87.8%) of the Chiconcuac Airbnb data shows acceptance of very short stays (1-2 nights), indicating a dynamic, high-turnover market.
- A significant segment (10.9%) caters to monthly stays (30+ nights) in Chiconcuac, pointing to opportunities in the extended-stay market.
Recommendations
- Align with the market by considering a 1 Night minimum stay, as 46.8% of Chiconcuac hosts use this setting.
- Explore offering discounts for stays of 30+ nights to attract the 10.9% of the market seeking extended stays.
- Adjust minimum nights based on seasonality – potentially shorter during low season and longer during peak demand periods in Chiconcuac.
Chiconcuac Airbnb Cancellation Policy Trends Analysis (2026)
Limited
3 listings
1.9% of total
Flexible
68 listings
44.2% of total
Moderate
47 listings
30.5% of total
Firm
27 listings
17.5% of total
Strict
9 listings
5.8% of total
Cancellation Policy Insights for Chiconcuac
- The prevailing Airbnb cancellation policy trend in Chiconcuac is Flexible, used by 44.2% of listings.
- The market strongly favors guest-friendly terms, with 74.7% of listings offering Flexible or Moderate policies. This suggests guests in Chiconcuac may expect booking flexibility.
- Strict cancellation policies are quite rare (5.8%), potentially making listings with this policy less competitive unless justified by high demand or property type.
Recommendations for Hosts
- Consider adopting a Flexible policy to align with the 44.2% market standard in Chiconcuac.
- Using a Strict policy might deter some guests, as only 5.8% of listings use it. Evaluate if potential revenue protection outweighs possible lower booking rates.
- Regularly review your cancellation policy against competitors and market demand shifts in Chiconcuac.
Chiconcuac STR Booking Lead Time Analysis (2026)
Average Booking Lead Time by Month
Booking Lead Time Insights for Chiconcuac
- The overall average booking lead time for vacation rentals in Chiconcuac is 35 days.
- Guests book furthest in advance for stays during December (average 56 days), likely coinciding with peak travel demand or local events.
- The shortest booking windows occur for stays in August (average 23 days), indicating more last-minute travel plans during this time.
- Seasonally, Fall (46 days avg.) sees the longest lead times, while Summer (25 days avg.) has the shortest, reflecting typical travel planning cycles.
Recommendations for Hosts
- Use the overall average lead time (35 days) as a baseline for your pricing and availability strategy in Chiconcuac.
- For December stays, consider implementing length-of-stay discounts or slightly higher rates for bookings made less than 56 days out to capitalize on advance planning.
- Target marketing efforts for the Fall season well in advance (at least 46 days) to capture early planners.
- Monitor your own booking lead times against these Chiconcuac averages to identify opportunities for dynamic pricing adjustments.
Popular & Essential Airbnb Amenities in Chiconcuac (2026)
Amenity Prevalence
Amenity Insights for Chiconcuac
- Essential amenities in Chiconcuac that guests expect include: Pool, Free parking on premises, Wifi. Lacking these (any) could significantly impact bookings.
- Popular amenities like TV, Kitchen, Hot water are common but not universal. Offering these can provide a competitive edge.
Recommendations for Hosts
- Ensure your listing includes all essential amenities for Chiconcuac: Pool, Free parking on premises, Wifi.
- Prioritize adding missing essentials: Pool, Free parking on premises, Wifi.
- Consider adding popular differentiators like TV or Kitchen to increase appeal.
- Highlight unique or less common amenities you offer (e.g., hot tub, dedicated workspace, EV charger) in your listing description and photos.
- Regularly check competitor amenities in Chiconcuac to stay competitive.
Chiconcuac Airbnb Guest Demographics & Profile Analysis (2026)
Guest Profile Summary for Chiconcuac
- The typical guest profile for Airbnb in Chiconcuac consists of primarily domestic travelers (94%), often arriving from nearby Mexico City, typically belonging to the Post-2000s (Gen Z/Alpha) group (50%), primarily speaking Spanish or English.
- Domestic travelers account for 94.2% of guests.
- Key international markets include Mexico (94.2%) and United States (3.4%).
- Top languages spoken are Spanish (50.7%) followed by English (37.8%).
- A significant demographic segment is the Post-2000s (Gen Z/Alpha) group, representing 50% of guests.
Recommendations for Hosts
- Target domestic marketing efforts towards travelers from Mexico City and Toluca.
- Tailor amenities and listing descriptions to appeal to the dominant Post-2000s (Gen Z/Alpha) demographic (e.g., highlight fast WiFi, smart home features, local guides).
- Highlight unique local experiences or amenities relevant to the primary guest profile.
- Consider seasonal promotions aligned with peak travel times for key origin markets.
Nearby Short-Term Rental Market Comparison
How does the Chiconcuac Airbnb market stack up against its neighbors? Compare key performance metrics like average monthly revenue, ADR, and occupancy rates in surrounding areas to understand the broader regional STR landscape.
| Market | Active Properties | Monthly Revenue | Daily Rate | Avg. Occupancy |
|---|---|---|---|---|
| El Santuario | 44 | $2,583 | $420.27 | 25% |
| Cerro Gordo | 38 | $2,183 | $438.64 | 21% |
| Tepeji del Rio de Ocampo | 11 | $2,125 | $315.80 | 27% |
| Yautepec de Zaragoza | 16 | $2,032 | $269.32 | 26% |
| Xalmolonco | 24 | $1,944 | $281.85 | 28% |
| Avandaro | 212 | $1,892 | $411.24 | 24% |
| Guerrero | 28 | $1,795 | $223.86 | 29% |
| Rancho San Diego | 21 | $1,707 | $276.31 | 26% |
| Lomas de Cocoyoc | 137 | $1,662 | $258.05 | 28% |
| La Ladrillera | 28 | $1,655 | $277.53 | 26% |