Atlacholoaya Airbnb Market Analysis 2026: Short Term Rental Data & Vacation Rental Statistics in Morelos, Mexico
Is Airbnb profitable in Atlacholoaya in 2026? Explore comprehensive Airbnb analytics for Atlacholoaya, Morelos, Mexico to uncover income potential. This 2026 STR market report for Atlacholoaya, based on AirROI data from February 2025 to January 2026, reveals key trends in the niche market of 128 active listings.
Whether you're considering an Airbnb investment in Atlacholoaya, optimizing your existing vacation rental, or exploring rental arbitrage opportunities, understanding the Atlacholoaya Airbnb data is crucial. Leveraging the low regulation environment is key to maximizing your short term rental income potential. Let's dive into the specifics.
Key Atlacholoaya Airbnb Performance Metrics Overview
Monthly Airbnb Revenue Variations & Income Potential in Atlacholoaya (2026)
Understanding the monthly revenue variations for Airbnb listings in Atlacholoaya is key to maximizing your short term rental income potential. Seasonality significantly impacts earnings. Our analysis, based on data from the past 12 months, shows that the peak revenue month for STRs in Atlacholoaya is typically December, while February often presents the lowest earnings, highlighting opportunities for strategic pricing adjustments during shoulder and low seasons. Explore the typical Airbnb income in Atlacholoaya across different performance tiers:
- Best-in-class properties (Top 10%) achieve $1,940+ monthly, often utilizing dynamic pricing and superior guest experiences.
- Strong performing properties (Top 25%) earn $1,041 or more, indicating effective management and desirable locations/amenities.
- Typical properties (Median) generate around $544 per month, representing the average market performance.
- Entry-level properties (Bottom 25%) see earnings around $274, often with potential for optimization.
Average Monthly Airbnb Earnings Trend in Atlacholoaya
Atlacholoaya Airbnb Occupancy Rate Trends (2026)
Maximize your bookings by understanding the Atlacholoaya STR occupancy trends. Seasonal demand shifts significantly influence how often properties are booked. Typically, Aprilsees the highest demand (peak season occupancy), while January experiences the lowest (low season). Effective strategies, like adjusting minimum stays or offering promotions, can boost occupancy during slower periods. Here's how different property tiers perform in Atlacholoaya:
- Best-in-class properties (Top 10%) achieve 63%+ occupancy, indicating high desirability and potentially optimized availability.
- Strong performing properties (Top 25%) maintain 38% or higher occupancy, suggesting good market fit and guest satisfaction.
- Typical properties (Median) have an occupancy rate around 21%.
- Entry-level properties (Bottom 25%) average 11% occupancy, potentially facing higher vacancy.
Average Monthly Occupancy Rate Trend in Atlacholoaya
Average Daily Rate (ADR) Airbnb Trends in Atlacholoaya (2026)
Effective short term rental pricing strategy in Atlacholoaya involves understanding monthly ADR fluctuations. The Average Daily Rate (ADR) for Airbnb in Atlacholoaya typically peaks in December and dips lowest during March. Leveraging Airbnb dynamic pricing tools or strategies based on this seasonality can significantly boost revenue. Here's a look at the typical nightly rates achieved:
- Best-in-class properties (Top 10%) command rates of $160+ per night, often due to premium features or locations.
- Strong performing properties (Top 25%) achieve nightly rates of $109 or more.
- Typical properties (Median) charge around $83 per night.
- Entry-level properties (Bottom 25%) earn around $64 per night.
Average Daily Rate (ADR) Trend by Month in Atlacholoaya
Get Live Atlacholoaya Market Intelligence 👇

Explore Real-time Analytics
Airbnb Seasonality Analysis & Trends in Atlacholoaya (2026)
Peak Season (December, April, August)
- Revenue averages $987 per month
- Occupancy rates average 33.1%
- Daily rates average $101
Shoulder Season
- Revenue averages $782 per month
- Occupancy maintains around 27.3%
- Daily rates hold near $98
Low Season (January, February, May)
- Revenue drops to average $689 per month
- Occupancy decreases to average 24.2%
- Daily rates adjust to average $97
Seasonality Insights for Atlacholoaya
- The Airbnb seasonality in Atlacholoaya shows moderate seasonality with distinct peak and low periods. While the sections above show seasonal averages, it's also insightful to look at the extremes:
- During the high season, the absolute peak month showcases Atlacholoaya's highest earning potential, with monthly revenues capable of climbing to $1,130, occupancy reaching a high of 35.7%, and ADRs peaking at $111.
- Conversely, the slowest single month of the year, typically falling within the low season, marks the market's lowest point. In this month, revenue might dip to $620, occupancy could drop to 21.2%, and ADRs may adjust down to $89.
- Understanding both the seasonal averages and these monthly peaks and troughs in revenue, occupancy, and ADR is crucial for maximizing your Airbnb profit potential in Atlacholoaya.
Seasonal Strategies for Maximizing Profit
- Peak Season: Maximize revenue through premium pricing and potentially longer minimum stays. Ensure high availability.
- Low Season: Offer competitive pricing, special promotions (e.g., extended stay discounts), and flexible cancellation policies. Target off-season travelers like remote workers or budget-conscious guests.
- Shoulder Seasons: Implement dynamic pricing that balances peak and low rates. Target weekend travelers or specific events. Offer slightly more flexible terms than peak season.
- Regularly analyze your own performance against these Atlacholoaya seasonality benchmarks and adjust your pricing and availability strategy accordingly.
Best Areas for Airbnb Investment in Atlacholoaya (2026)
Exploring the top neighborhoods for short-term rentals in Atlacholoaya? This section highlights key areas, outlining why they are attractive for hosts and guests, along with notable local attractions. Consider these locations based on your target guest profile and investment strategy.
| Neighborhood / Area | Why Host Here? (Target Guests & Appeal) | Key Attractions & Landmarks |
|---|---|---|
| Atlacholoaya Central | The heart of Atlacholoaya, this area is known for its charming ambiance and accessibility. It’s an excellent location for tourists looking to explore the local culture and cuisine. | Local markets, Restaurants, Traditional fiestas |
| Cocoyoc | Cocoyoc is known for its beautiful weather and lush landscape, making it a favorite for those seeking relaxation. It’s an ideal spot for vacation homes and getaways. | Spa resorts, Golf courses, Natural parks |
| Tequesquitengo | Famous for its large lake and water sports, Tequesquitengo attracts adventure seekers and families looking for fun on the water. A hotspot for weekend getaways. | Tequesquitengo Lake, Water parks, Jet skiing |
| Tlaltizapán | This area is popular for its picturesque views and historical sites. Ideal for Airbnb hosts seeking to attract cultural tourists. | Historical ruins, Museums, Cultural festivals |
| Xochitepec | Known for its beautiful natural surroundings, Xochitepec offers a peaceful retreat and attracts nature lovers and families. | National parks, Outdoor activities, Ecological centers |
| Jojutla | A town with rich history and culture, Jojutla is appealing for its local ambience and proximity to various attractions. | Local arts and crafts, Cultural events, Historical landmarks |
| Cuernavaca | Though not in Atlacholoaya, nearby Cuernavaca is known as the 'City of Eternal Spring' and attracts many visitors. Great for Airbnb investments due to high tourist demand. | Palacio de Cortés, Borda Garden, Local museums |
| Tepoztlán | A popular tourist destination renowned for its magical town status, Tepoztlán offers a unique experience for visitors seeking culture and nature, making it a valuable Airbnb location. | Tepoztlán pyramid, Local markets, Hiking trails |
Understanding Airbnb License Requirements & STR Laws in Atlacholoaya (2026)
While Atlacholoaya, Morelos, Mexico currently shows low STR regulations, specific Airbnb license requirements might still exist or change. Always verify the latest short term rental regulations and Airbnb license requirements directly with local government authorities for Atlacholoaya to ensure full compliance before hosting.
(Source: AirROI data, 2026, finding no licensed listings among those analyzed)
Top Performing Airbnb Properties in Atlacholoaya (2026)
Benchmark your potential! Explore examples of top-performing Airbnb properties in Atlacholoayabased on Trailing Twelve Month (TTM) revenue. Analyze their characteristics, revenue, occupancy rate, and ADR to understand what drives success in this market.

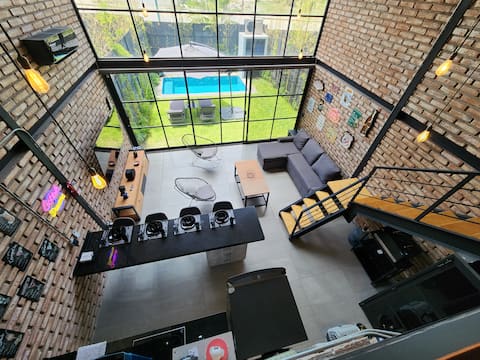
XochiLoft 19 with private pool
Entire Place • 2 bedrooms

Casa Quinta Santa Fe/Private heated pool
Entire Place • 2 bedrooms
Hollywood House (private pool)
Entire Place • 2 bedrooms
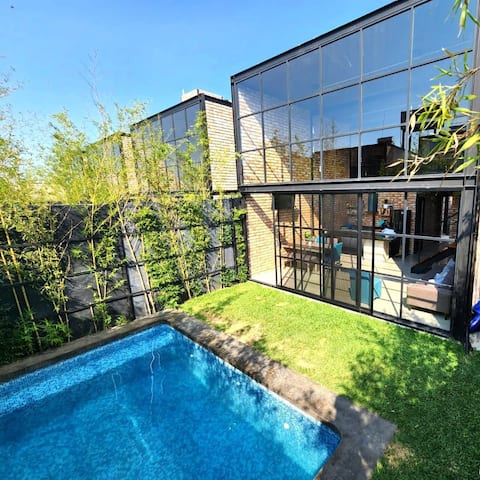
Loft with private pool
Entire Place • 2 bedrooms

Beautiful house to rest
Entire Place • 2 bedrooms

Modern Loft · Heated Pool & Garden Oasis
Entire Place • 2 bedrooms
Note: Performance varies based on location, size, amenities, seasonality, and management quality. Data reflects the past 12 months.
Top Performing Airbnb Hosts in Atlacholoaya (2026)
Learn from the best! This table showcases top-performing Airbnb hosts in Atlacholoaya based on the number of properties managed and estimated total revenue over the past year. Analyze their scale and performance metrics.
| Host Name | Properties | Grossing Revenue | Stay Reviews | Avg Rating |
|---|---|---|---|---|
| Edson | 2 | $41,434 | 82 | 4.87/5.0 |
| Andrea | 1 | $37,206 | 100 | 4.90/5.0 |
| Liz | 5 | $33,248 | 232 | 4.81/5.0 |
| Sait | 1 | $31,283 | 60 | 4.97/5.0 |
| Arturo | 1 | $29,542 | 82 | 4.85/5.0 |
| Antonio | 1 | $27,901 | 122 | 4.92/5.0 |
| Juan Manuel | 1 | $27,656 | 115 | 4.90/5.0 |
| Ada | 1 | $25,342 | 159 | 4.71/5.0 |
| Zury | 1 | $24,888 | 184 | 4.92/5.0 |
| Ramsés Salomón | 2 | $24,066 | 415 | 4.74/5.0 |
Analyzing the strategies of top hosts, such as their property selection, pricing, and guest communication, can offer valuable lessons for optimizing your own Airbnb operations in Atlacholoaya.
Dive Deeper: Advanced Atlacholoaya STR Market Data (2026)
Ready to unlock more insights? AirROI provides access to advanced metrics and comprehensive Airbnb data for Atlacholoaya. Explore detailed analytics beyond this report to refine your investment strategy, optimize pricing, and maximize your vacation rental profits.
Explore Advanced MetricsAtlacholoaya Short-Term Rental Market Composition (2026): Property & Room Types
Room Type Distribution
Property Type Distribution
Market Composition Insights for Atlacholoaya
- The Atlacholoaya Airbnb market composition is heavily skewed towards Entire Home/Apt listings, which make up 100% of the 128 active rentals. This indicates strong guest preference for privacy and space.
- Looking at the property type distribution in Atlacholoaya, House properties are the most common (80.5%), reflecting the local real estate landscape.
- Houses represent a significant 80.5% portion, catering likely to families or larger groups.
- Smaller segments like hotel/boutique, unique stays (combined 1.6%) offer potential for unique stay experiences.
Atlacholoaya Airbnb Room Capacity Analysis (2026): Bedroom Distribution
Distribution of Listings by Number of Bedrooms
Room Capacity Insights for Atlacholoaya
- The dominant room capacity in Atlacholoaya is 3 bedrooms listings, making up 55.5% of the market. This suggests a strong demand for properties suitable for families or small groups.
- Together, 3 bedrooms and 2 bedrooms properties represent 87.5% of the active Airbnb listings in Atlacholoaya, indicating a high concentration in these sizes.
- A significant 61.8% of listings offer 3+ bedrooms, catering to larger groups and families seeking more space in Atlacholoaya.
Atlacholoaya Vacation Rental Guest Capacity Trends (2026)
Distribution of Listings by Guest Capacity
Guest Capacity Insights for Atlacholoaya
- The most common guest capacity trend in Atlacholoaya vacation rentals is listings accommodating 6 guests (33.6%). This suggests the primary traveler segment is likely larger groups.
- Properties designed for 6 guests and 8+ guests dominate the Atlacholoaya STR market, accounting for 64.1% of listings.
- 74.3% of properties accommodate 6+ guests, serving the market segment for larger families or group travel in Atlacholoaya.
- On average, properties in Atlacholoaya are equipped to host 6.3 guests.
Atlacholoaya Airbnb Booking Patterns (2026): Available vs. Booked Days
Available Days Distribution
Booked Days Distribution
Booking Pattern Insights for Atlacholoaya
- The most common availability pattern in Atlacholoaya falls within the 271-366 days range, representing 73.4% of listings. This suggests many properties have significant open periods on their calendars.
- Approximately 91.4% of listings show high availability (181+ days open annually), indicating potential for increased bookings or specific owner usage patterns.
- For booked days, the 31-90 days range is most frequent in Atlacholoaya (43.8%), reflecting common guest stay durations or potential owner blocking patterns.
- A notable 8.6% of properties secure long booking periods (181+ days booked per year), highlighting successful long-term rental strategies or significant owner usage.
Atlacholoaya Airbnb Minimum Stay Requirements Analysis
Distribution of Listings by Minimum Night Requirement
1 Night
60 listings
46.9% of total
2 Nights
48 listings
37.5% of total
3 Nights
1 listings
0.8% of total
30+ Nights
19 listings
14.8% of total
Key Insights
- The most prevalent minimum stay requirement in Atlacholoaya is 1 Night, adopted by 46.9% of listings. This highlights the market's preference for shorter, flexible bookings.
- A strong majority (84.4%) of the Atlacholoaya Airbnb data shows acceptance of very short stays (1-2 nights), indicating a dynamic, high-turnover market.
- A significant segment (14.8%) caters to monthly stays (30+ nights) in Atlacholoaya, pointing to opportunities in the extended-stay market.
Recommendations
- Align with the market by considering a 1 Night minimum stay, as 46.9% of Atlacholoaya hosts use this setting.
- Explore offering discounts for stays of 30+ nights to attract the 14.8% of the market seeking extended stays.
- Adjust minimum nights based on seasonality – potentially shorter during low season and longer during peak demand periods in Atlacholoaya.
Atlacholoaya Airbnb Cancellation Policy Trends Analysis (2026)
Super Strict 30 Days
1 listings
0.8% of total
Flexible
56 listings
43.8% of total
Moderate
46 listings
35.9% of total
Firm
20 listings
15.6% of total
Strict
5 listings
3.9% of total
Cancellation Policy Insights for Atlacholoaya
- The prevailing Airbnb cancellation policy trend in Atlacholoaya is Flexible, used by 43.8% of listings.
- The market strongly favors guest-friendly terms, with 79.7% of listings offering Flexible or Moderate policies. This suggests guests in Atlacholoaya may expect booking flexibility.
- Strict cancellation policies are quite rare (3.9%), potentially making listings with this policy less competitive unless justified by high demand or property type.
Recommendations for Hosts
- Consider adopting a Flexible policy to align with the 43.8% market standard in Atlacholoaya.
- Using a Strict policy might deter some guests, as only 3.9% of listings use it. Evaluate if potential revenue protection outweighs possible lower booking rates.
- Regularly review your cancellation policy against competitors and market demand shifts in Atlacholoaya.
Atlacholoaya STR Booking Lead Time Analysis (2026)
Average Booking Lead Time by Month
Booking Lead Time Insights for Atlacholoaya
- The overall average booking lead time for vacation rentals in Atlacholoaya is 18 days.
- Guests book furthest in advance for stays during October (average 31 days), likely coinciding with peak travel demand or local events.
- The shortest booking windows occur for stays in March (average 11 days), indicating more last-minute travel plans during this time.
- Seasonally, Fall (23 days avg.) sees the longest lead times, while Spring (15 days avg.) has the shortest, reflecting typical travel planning cycles.
Recommendations for Hosts
- Use the overall average lead time (18 days) as a baseline for your pricing and availability strategy in Atlacholoaya.
- For October stays, consider implementing length-of-stay discounts or slightly higher rates for bookings made less than 31 days out to capitalize on advance planning.
- Target marketing efforts for the Fall season well in advance (at least 23 days) to capture early planners.
- Monitor your own booking lead times against these Atlacholoaya averages to identify opportunities for dynamic pricing adjustments.
Popular & Essential Airbnb Amenities in Atlacholoaya (2026)
Amenity Prevalence
Amenity Insights for Atlacholoaya
- Essential amenities in Atlacholoaya that guests expect include: Pool, Free parking on premises, Kitchen. Lacking these (any) could significantly impact bookings.
- Popular amenities like TV, Wifi, Refrigerator are common but not universal. Offering these can provide a competitive edge.
- Warning: Wifi is not universally provided but is considered essential globally. Ensure reliable Wifi is offered.
Recommendations for Hosts
- Ensure your listing includes all essential amenities for Atlacholoaya: Pool, Free parking on premises, Kitchen.
- Prioritize adding missing essentials: Kitchen.
- Consider adding popular differentiators like TV or Wifi to increase appeal.
- Highlight unique or less common amenities you offer (e.g., hot tub, dedicated workspace, EV charger) in your listing description and photos.
- Regularly check competitor amenities in Atlacholoaya to stay competitive.
Atlacholoaya Airbnb Guest Demographics & Profile Analysis (2026)
Guest Profile Summary for Atlacholoaya
- The typical guest profile for Airbnb in Atlacholoaya consists of primarily domestic travelers (96%), often arriving from nearby Mexico City, typically belonging to the Post-2000s (Gen Z/Alpha) group (50%), primarily speaking Spanish or English.
- Domestic travelers account for 95.8% of guests.
- Key international markets include Mexico (95.8%) and United States (2.2%).
- Top languages spoken are Spanish (54.2%) followed by English (36.7%).
- A significant demographic segment is the Post-2000s (Gen Z/Alpha) group, representing 50% of guests.
Recommendations for Hosts
- Target domestic marketing efforts towards travelers from Mexico City and Puebla.
- Tailor amenities and listing descriptions to appeal to the dominant Post-2000s (Gen Z/Alpha) demographic (e.g., highlight fast WiFi, smart home features, local guides).
- Highlight unique local experiences or amenities relevant to the primary guest profile.
- Consider seasonal promotions aligned with peak travel times for key origin markets.
Nearby Short-Term Rental Market Comparison
How does the Atlacholoaya Airbnb market stack up against its neighbors? Compare key performance metrics like average monthly revenue, ADR, and occupancy rates in surrounding areas to understand the broader regional STR landscape.
| Market | Active Properties | Monthly Revenue | Daily Rate | Avg. Occupancy |
|---|---|---|---|---|
| El Santuario | 44 | $2,583 | $420.27 | 25% |
| Cerro Gordo | 38 | $2,183 | $438.64 | 21% |
| Tepeji del Rio de Ocampo | 11 | $2,125 | $315.80 | 27% |
| Yautepec de Zaragoza | 16 | $2,032 | $269.32 | 26% |
| Xalmolonco | 24 | $1,944 | $281.85 | 28% |
| Avandaro | 212 | $1,892 | $411.24 | 24% |
| Guerrero | 28 | $1,795 | $223.86 | 29% |
| Rancho San Diego | 21 | $1,707 | $276.31 | 26% |
| Lomas de Cocoyoc | 137 | $1,662 | $258.05 | 28% |
| La Ladrillera | 28 | $1,655 | $277.53 | 26% |