San Pedro Nopancalco Airbnb Market Analysis 2026: Short Term Rental Data & Vacation Rental Statistics in Hidalgo, Mexico
Is Airbnb profitable in San Pedro Nopancalco in 2026? Explore comprehensive Airbnb analytics for San Pedro Nopancalco, Hidalgo, Mexico to uncover income potential. This 2026 STR market report for San Pedro Nopancalco, based on AirROI data from February 2025 to January 2026, reveals key trends in the niche market of 23 active listings.
Whether you're considering an Airbnb investment in San Pedro Nopancalco, optimizing your existing vacation rental, or exploring rental arbitrage opportunities, understanding the San Pedro Nopancalco Airbnb data is crucial. Leveraging the low regulation environment is key to maximizing your short term rental income potential. Let's dive into the specifics.
Key San Pedro Nopancalco Airbnb Performance Metrics Overview
Monthly Airbnb Revenue Variations & Income Potential in San Pedro Nopancalco (2026)
Understanding the monthly revenue variations for Airbnb listings in San Pedro Nopancalco is key to maximizing your short term rental income potential. Seasonality significantly impacts earnings. Our analysis, based on data from the past 12 months, shows that the peak revenue month for STRs in San Pedro Nopancalco is typically October, while March often presents the lowest earnings, highlighting opportunities for strategic pricing adjustments during shoulder and low seasons. Explore the typical Airbnb income in San Pedro Nopancalco across different performance tiers:
- Best-in-class properties (Top 10%) achieve $910+ monthly, often utilizing dynamic pricing and superior guest experiences.
- Strong performing properties (Top 25%) earn $623 or more, indicating effective management and desirable locations/amenities.
- Typical properties (Median) generate around $390 per month, representing the average market performance.
- Entry-level properties (Bottom 25%) see earnings around $193, often with potential for optimization.
Average Monthly Airbnb Earnings Trend in San Pedro Nopancalco
San Pedro Nopancalco Airbnb Occupancy Rate Trends (2026)
Maximize your bookings by understanding the San Pedro Nopancalco STR occupancy trends. Seasonal demand shifts significantly influence how often properties are booked. Typically, Octobersees the highest demand (peak season occupancy), while December experiences the lowest (low season). Effective strategies, like adjusting minimum stays or offering promotions, can boost occupancy during slower periods. Here's how different property tiers perform in San Pedro Nopancalco:
- Best-in-class properties (Top 10%) achieve 64%+ occupancy, indicating high desirability and potentially optimized availability.
- Strong performing properties (Top 25%) maintain 39% or higher occupancy, suggesting good market fit and guest satisfaction.
- Typical properties (Median) have an occupancy rate around 25%.
- Entry-level properties (Bottom 25%) average 15% occupancy, potentially facing higher vacancy.
Average Monthly Occupancy Rate Trend in San Pedro Nopancalco
Average Daily Rate (ADR) Airbnb Trends in San Pedro Nopancalco (2026)
Effective short term rental pricing strategy in San Pedro Nopancalco involves understanding monthly ADR fluctuations. The Average Daily Rate (ADR) for Airbnb in San Pedro Nopancalco typically peaks in December and dips lowest during March. Leveraging Airbnb dynamic pricing tools or strategies based on this seasonality can significantly boost revenue. Here's a look at the typical nightly rates achieved:
- Best-in-class properties (Top 10%) command rates of $76+ per night, often due to premium features or locations.
- Strong performing properties (Top 25%) achieve nightly rates of $61 or more.
- Typical properties (Median) charge around $57 per night.
- Entry-level properties (Bottom 25%) earn around $34 per night.
Average Daily Rate (ADR) Trend by Month in San Pedro Nopancalco
Get Live San Pedro Nopancalco Market Intelligence 👇
Explore Real-time Analytics
Airbnb Seasonality Analysis & Trends in San Pedro Nopancalco (2026)
Peak Season (October, September, July)
- Revenue averages $701 per month
- Occupancy rates average 43.4%
- Daily rates average $52
Shoulder Season
- Revenue averages $406 per month
- Occupancy maintains around 26.7%
- Daily rates hold near $51
Low Season (March, April, December)
- Revenue drops to average $323 per month
- Occupancy decreases to average 25.5%
- Daily rates adjust to average $50
Seasonality Insights for San Pedro Nopancalco
- The Airbnb seasonality in San Pedro Nopancalco shows highly seasonal trends requiring careful strategy. While the sections above show seasonal averages, it's also insightful to look at the extremes:
- During the high season, the absolute peak month showcases San Pedro Nopancalco's highest earning potential, with monthly revenues capable of climbing to $939, occupancy reaching a high of 53.4%, and ADRs peaking at $54.
- Conversely, the slowest single month of the year, typically falling within the low season, marks the market's lowest point. In this month, revenue might dip to $314, occupancy could drop to 22.3%, and ADRs may adjust down to $47.
- Understanding both the seasonal averages and these monthly peaks and troughs in revenue, occupancy, and ADR is crucial for maximizing your Airbnb profit potential in San Pedro Nopancalco.
Seasonal Strategies for Maximizing Profit
- Peak Season: Maximize revenue through premium pricing and potentially longer minimum stays. Ensure high availability.
- Low Season: Offer competitive pricing, special promotions (e.g., extended stay discounts), and flexible cancellation policies. Target off-season travelers like remote workers or budget-conscious guests.
- Shoulder Seasons: Implement dynamic pricing that balances peak and low rates. Target weekend travelers or specific events. Offer slightly more flexible terms than peak season.
- Regularly analyze your own performance against these San Pedro Nopancalco seasonality benchmarks and adjust your pricing and availability strategy accordingly.
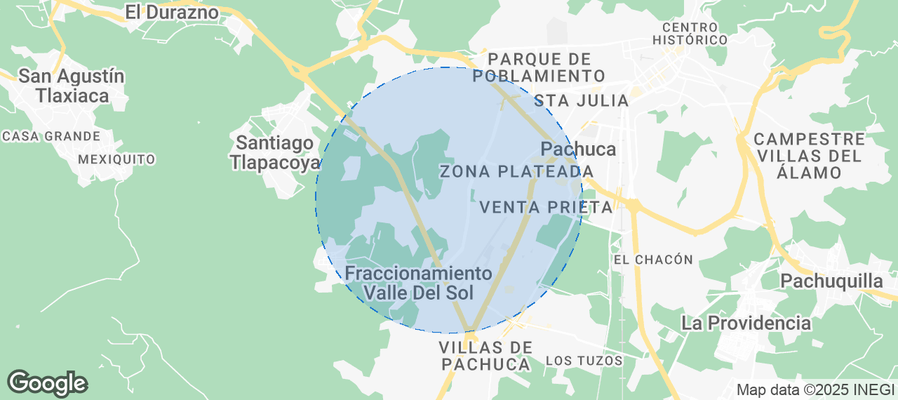
Best Areas for Airbnb Investment in San Pedro Nopancalco (2026)
Exploring the top neighborhoods for short-term rentals in San Pedro Nopancalco? This section highlights key areas, outlining why they are attractive for hosts and guests, along with notable local attractions. Consider these locations based on your target guest profile and investment strategy.
| Neighborhood / Area | Why Host Here? (Target Guests & Appeal) | Key Attractions & Landmarks |
|---|---|---|
| Centro Histórico de Tula | Historical center known for its archaeological sites and colonial architecture. A cultural hotspot attracting visitors interested in history and heritage. | Tula Archaeological Site, Temple of the Morning Star, Museo de Tula, Plaza de la Constitución, Iglesia de San José |
| Tula de Allende | A vibrant town near Tula with rich cultural heritage and proximity to natural reserves. Great for those seeking a mix of history and nature. | Cerro de Santiaguito, Huasca de Ocampo, Tolteca Cultural Center, Local markets, Nature trails |
| Pachuca | The capital city of Hidalgo, offering a blend of modern amenities and historical sites. It attracts both tourists and business travelers. | Pachuca's Clock Tower, Museo de Minería, Cueva del Cañón del Arroyo, Crisóstomo Cano, Plaza Independencia |
| Huasca de Ocampo | A picturesque village known for its natural beauty and adventure activities. Popular among eco-tourists and travelers seeking relaxation. | Huasca Prismas Basálticos, Museo de los Duendes, Pueblo Mágico, Cascadas de Agua Azul, Balsas de Huasca |
| Mineral del Chico | A scenic town set in the mountains, famous for its natural parks and outdoor activities. Ideal for nature lovers and hikers. | Cerro de las Navajas, Salto de los Novios, Parque Nacional El Chico, Pueblo Mágico, Mountain trails |
| Tulancingo | A bustling city with historical significance and ample amenities. Convenient for travelers visiting central Mexico. | Arco del Tiempo, Plaza de la Esperanza, Tulancingo Cathedral, Museo del Ferrocarril, Cerro de la Cruz |
| Pueblo Magico de Atotonilco el Grande | A charming magical village known for its natural hot springs and relaxation spots, ideal for wellness tourism. | Atotonilco Hot Springs, Iglesia de Atotonilco, Local artisan markets, Parks and gardens, Hiking trails |
| Actopan | A town celebrated for its ancient ruins and traditional cuisine, making it a cultural and culinary destination. | Actopan Ruins, Franciscan Monastery, Local food markets, Basilica de San Juan, Cultural festivals |
Understanding Airbnb License Requirements & STR Laws in San Pedro Nopancalco (2026)
While San Pedro Nopancalco, Hidalgo, Mexico currently shows low STR regulations, specific Airbnb license requirements might still exist or change. Always verify the latest short term rental regulations and Airbnb license requirements directly with local government authorities for San Pedro Nopancalco to ensure full compliance before hosting.
(Source: AirROI data, 2026, finding no licensed listings among those analyzed)
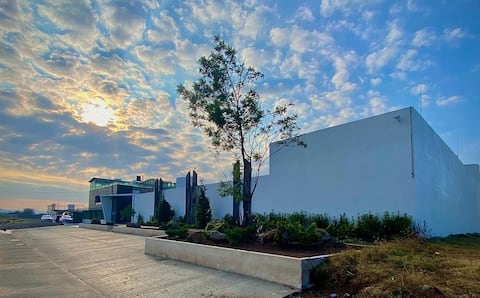
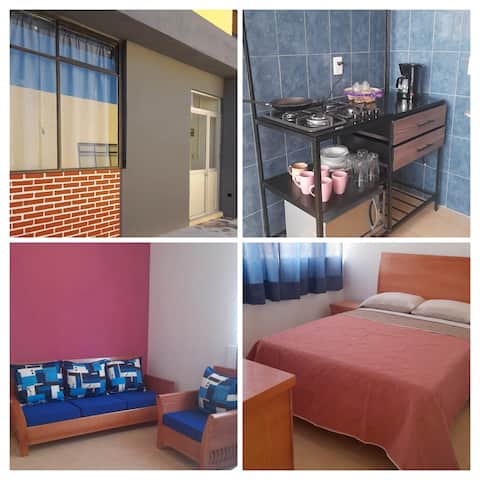
Top Performing Airbnb Properties in San Pedro Nopancalco (2026)
Benchmark your potential! Explore examples of top-performing Airbnb properties in San Pedro Nopancalcobased on Trailing Twelve Month (TTM) revenue. Analyze their characteristics, revenue, occupancy rate, and ADR to understand what drives success in this market.

Platinum Loft A3
Private Room • 1 bedroom
Platinum Loft B2
Private Room • 1 bedroom

Platinum Loft A4
Private Room • 1 bedroom
Nuevo Depto, with parking
Entire Place • 5 bedrooms

Platinum Loft B3
Private Room • 1 bedroom

Platinum Loft B4
Private Room • 1 bedroom

Spacious apartment and garage ideal for 11 guests
Entire Place • 3 bedrooms
Note: Performance varies based on location, size, amenities, seasonality, and management quality. Data reflects the past 12 months.
Top Performing Airbnb Hosts in San Pedro Nopancalco (2026)
Learn from the best! This table showcases top-performing Airbnb hosts in San Pedro Nopancalco based on the number of properties managed and estimated total revenue over the past year. Analyze their scale and performance metrics.
| Host Name | Properties | Grossing Revenue | Stay Reviews | Avg Rating |
|---|---|---|---|---|
| Angelica | 15 | $41,812 | 621 | 4.87/5.0 |
| Eduardo | 6 | $21,818 | 405 | 4.83/5.0 |
| Hussein | 2 | $2,656 | 63 | 4.95/5.0 |
Analyzing the strategies of top hosts, such as their property selection, pricing, and guest communication, can offer valuable lessons for optimizing your own Airbnb operations in San Pedro Nopancalco.
Dive Deeper: Advanced San Pedro Nopancalco STR Market Data (2026)
Ready to unlock more insights? AirROI provides access to advanced metrics and comprehensive Airbnb data for San Pedro Nopancalco. Explore detailed analytics beyond this report to refine your investment strategy, optimize pricing, and maximize your vacation rental profits.
Explore Advanced MetricsSan Pedro Nopancalco Short-Term Rental Market Composition (2026): Property & Room Types
Room Type Distribution
Property Type Distribution
Market Composition Insights for San Pedro Nopancalco
- The San Pedro Nopancalco Airbnb market composition is heavily skewed towards Private Room listings, which make up 73.9% of the 23 active rentals. This indicates strong guest preference for privacy and space.
- Looking at the property type distribution in San Pedro Nopancalco, Apartment/Condo properties are the most common (78.3%), reflecting the local real estate landscape.
- Smaller segments like others, hotel/boutique (combined 8.6%) offer potential for unique stay experiences.
San Pedro Nopancalco Airbnb Room Capacity Analysis (2026): Bedroom Distribution
Distribution of Listings by Number of Bedrooms
Room Capacity Insights for San Pedro Nopancalco
- The dominant room capacity in San Pedro Nopancalco is 1 bedroom listings, making up 60.9% of the market. This suggests a strong demand for properties suitable for couples or solo travelers.
- Together, 1 bedroom and 3 bedrooms properties represent 73.9% of the active Airbnb listings in San Pedro Nopancalco, indicating a high concentration in these sizes.
- With over half the market (60.9%) consisting of studios or 1-bedroom units, San Pedro Nopancalco is particularly well-suited for individuals or couples.
- A significant 21.6% of listings offer 3+ bedrooms, catering to larger groups and families seeking more space in San Pedro Nopancalco.
San Pedro Nopancalco Vacation Rental Guest Capacity Trends (2026)
Distribution of Listings by Guest Capacity
Guest Capacity Insights for San Pedro Nopancalco
- The most common guest capacity trend in San Pedro Nopancalco vacation rentals is listings accommodating 2 guests (60.9%). This suggests the primary traveler segment is likely couples or solo travelers.
- Properties designed for 2 guests and 8+ guests dominate the San Pedro Nopancalco STR market, accounting for 73.9% of listings.
- A significant 60.9% of listings cater specifically to 1-2 guests, highlighting strong demand from couples and solo travelers in San Pedro Nopancalco.
- 17.3% of properties accommodate 6+ guests, serving the market segment for larger families or group travel in San Pedro Nopancalco.
- On average, properties in San Pedro Nopancalco are equipped to host 2.9 guests.
San Pedro Nopancalco Airbnb Booking Patterns (2026): Available vs. Booked Days
Available Days Distribution
Booked Days Distribution
Booking Pattern Insights for San Pedro Nopancalco
- The most common availability pattern in San Pedro Nopancalco falls within the 271-366 days range, representing 69.6% of listings. This suggests many properties have significant open periods on their calendars.
- Approximately 100.0% of listings show high availability (181+ days open annually), indicating potential for increased bookings or specific owner usage patterns.
- For booked days, the 31-90 days range is most frequent in San Pedro Nopancalco (34.8%), reflecting common guest stay durations or potential owner blocking patterns.
San Pedro Nopancalco Airbnb Minimum Stay Requirements Analysis
Distribution of Listings by Minimum Night Requirement
1 Night
23 listings
100% of total
Key Insights
- The most prevalent minimum stay requirement in San Pedro Nopancalco is 1 Night, adopted by 100% of listings. This highlights the market's preference for shorter, flexible bookings.
- A strong majority (100.0%) of the San Pedro Nopancalco Airbnb data shows acceptance of very short stays (1-2 nights), indicating a dynamic, high-turnover market.
Recommendations
- Align with the market by considering a 1 Night minimum stay, as 100% of San Pedro Nopancalco hosts use this setting.
- Adjust minimum nights based on seasonality – potentially shorter during low season and longer during peak demand periods in San Pedro Nopancalco.
San Pedro Nopancalco Airbnb Cancellation Policy Trends Analysis (2026)
Flexible
3 listings
13% of total
Moderate
5 listings
21.7% of total
Firm
13 listings
56.5% of total
Strict
2 listings
8.7% of total
Cancellation Policy Insights for San Pedro Nopancalco
- The prevailing Airbnb cancellation policy trend in San Pedro Nopancalco is Firm, used by 56.5% of listings.
- A majority (65.2%) of hosts in San Pedro Nopancalco utilize Firm or Strict policies, indicating a market where hosts prioritize booking security.
- Strict cancellation policies are quite rare (8.7%), potentially making listings with this policy less competitive unless justified by high demand or property type.
Recommendations for Hosts
- Consider adopting a Firm policy to align with the 56.5% market standard in San Pedro Nopancalco.
- Using a Strict policy might deter some guests, as only 8.7% of listings use it. Evaluate if potential revenue protection outweighs possible lower booking rates.
- Regularly review your cancellation policy against competitors and market demand shifts in San Pedro Nopancalco.
San Pedro Nopancalco STR Booking Lead Time Analysis (2026)
Average Booking Lead Time by Month
Booking Lead Time Insights for San Pedro Nopancalco
- The overall average booking lead time for vacation rentals in San Pedro Nopancalco is 8 days.
- Guests book furthest in advance for stays during October (average 21 days), likely coinciding with peak travel demand or local events.
- The shortest booking windows occur for stays in December (average 4 days), indicating more last-minute travel plans during this time.
- Seasonally, Fall (12 days avg.) sees the longest lead times, while Winter (5 days avg.) has the shortest, reflecting typical travel planning cycles.
Recommendations for Hosts
- Use the overall average lead time (8 days) as a baseline for your pricing and availability strategy in San Pedro Nopancalco.
- For October stays, consider implementing length-of-stay discounts or slightly higher rates for bookings made less than 21 days out to capitalize on advance planning.
- Target marketing efforts for the Fall season well in advance (at least 12 days) to capture early planners.
- Monitor your own booking lead times against these San Pedro Nopancalco averages to identify opportunities for dynamic pricing adjustments.
Popular & Essential Airbnb Amenities in San Pedro Nopancalco (2026)
Amenity Prevalence
Amenity Insights for San Pedro Nopancalco
- Essential amenities in San Pedro Nopancalco that guests expect include: Long term stays allowed, Free parking on premises, Extra pillows and blankets, Wifi, Essentials, Hot water. Lacking these (any) could significantly impact bookings.
- Popular amenities like Kitchen, Bed linens, Room-darkening shades are common but not universal. Offering these can provide a competitive edge.
Recommendations for Hosts
- Ensure your listing includes all essential amenities for San Pedro Nopancalco: Long term stays allowed, Free parking on premises, Extra pillows and blankets, Wifi, Essentials, Hot water.
- Prioritize adding missing essentials: Hot water.
- Consider adding popular differentiators like Kitchen or Bed linens to increase appeal.
- Highlight unique or less common amenities you offer (e.g., hot tub, dedicated workspace, EV charger) in your listing description and photos.
- Regularly check competitor amenities in San Pedro Nopancalco to stay competitive.
San Pedro Nopancalco Airbnb Guest Demographics & Profile Analysis (2026)
Guest Profile Summary for San Pedro Nopancalco
- The typical guest profile for Airbnb in San Pedro Nopancalco consists of primarily domestic travelers (90%), often arriving from nearby Mexico City, typically belonging to the Post-2000s (Gen Z/Alpha) group (50%), primarily speaking Spanish or English.
- Domestic travelers account for 90.0% of guests.
- Key international markets include Mexico (90%) and United States (5%).
- Top languages spoken are Spanish (58.3%) followed by English (36.7%).
- A significant demographic segment is the Post-2000s (Gen Z/Alpha) group, representing 50% of guests.
Recommendations for Hosts
- Target domestic marketing efforts towards travelers from Mexico City and Pachuca.
- Tailor amenities and listing descriptions to appeal to the dominant Post-2000s (Gen Z/Alpha) demographic (e.g., highlight fast WiFi, smart home features, local guides).
- Highlight unique local experiences or amenities relevant to the primary guest profile.
- Consider seasonal promotions aligned with peak travel times for key origin markets.
Nearby Short-Term Rental Market Comparison
How does the San Pedro Nopancalco Airbnb market stack up against its neighbors? Compare key performance metrics like average monthly revenue, ADR, and occupancy rates in surrounding areas to understand the broader regional STR landscape.
| Market | Active Properties | Monthly Revenue | Daily Rate | Avg. Occupancy |
|---|---|---|---|---|
| Tepeji del Rio de Ocampo | 11 | $2,125 | $315.80 | 27% |
| La Tortuga | 71 | $1,658 | $239.12 | 28% |
| Cuauhtémoc | 13 | $1,344 | $93.02 | 54% |
| Juárez | 44 | $1,317 | $98.72 | 54% |
| Tzibantzá | 12 | $1,298 | $232.99 | 23% |
| Mexico City | 19,365 | $1,216 | $96.78 | 48% |
| San Francisco Mazapa | 15 | $1,155 | $93.59 | 39% |
| Jilotepec de Molina Enríquez | 10 | $1,138 | $169.51 | 23% |
| Ezequiel Montes | 33 | $1,096 | $137.22 | 23% |
| Santa Ana Portales | 175 | $1,062 | $187.63 | 22% |