San José Ocotillos Airbnb Market Analysis 2026: Short Term Rental Data & Vacation Rental Statistics in Hidalgo, Mexico
Is Airbnb profitable in San José Ocotillos in 2026? Explore comprehensive Airbnb analytics for San José Ocotillos, Hidalgo, Mexico to uncover income potential. This 2026 STR market report for San José Ocotillos, based on AirROI data from February 2025 to January 2026, reveals key trends in the niche market of 62 active listings.
Whether you're considering an Airbnb investment in San José Ocotillos, optimizing your existing vacation rental, or exploring rental arbitrage opportunities, understanding the San José Ocotillos Airbnb data is crucial. Leveraging the low regulation environment is key to maximizing your short term rental income potential. Let's dive into the specifics.
Key San José Ocotillos Airbnb Performance Metrics Overview
Monthly Airbnb Revenue Variations & Income Potential in San José Ocotillos (2026)
Understanding the monthly revenue variations for Airbnb listings in San José Ocotillos is key to maximizing your short term rental income potential. Seasonality significantly impacts earnings. Our analysis, based on data from the past 12 months, shows that the peak revenue month for STRs in San José Ocotillos is typically December, while March often presents the lowest earnings, highlighting opportunities for strategic pricing adjustments during shoulder and low seasons. Explore the typical Airbnb income in San José Ocotillos across different performance tiers:
- Best-in-class properties (Top 10%) achieve $2,265+ monthly, often utilizing dynamic pricing and superior guest experiences.
- Strong performing properties (Top 25%) earn $1,588 or more, indicating effective management and desirable locations/amenities.
- Typical properties (Median) generate around $846 per month, representing the average market performance.
- Entry-level properties (Bottom 25%) see earnings around $300, often with potential for optimization.
Average Monthly Airbnb Earnings Trend in San José Ocotillos
San José Ocotillos Airbnb Occupancy Rate Trends (2026)
Maximize your bookings by understanding the San José Ocotillos STR occupancy trends. Seasonal demand shifts significantly influence how often properties are booked. Typically, Decembersees the highest demand (peak season occupancy), while March experiences the lowest (low season). Effective strategies, like adjusting minimum stays or offering promotions, can boost occupancy during slower periods. Here's how different property tiers perform in San José Ocotillos:
- Best-in-class properties (Top 10%) achieve 53%+ occupancy, indicating high desirability and potentially optimized availability.
- Strong performing properties (Top 25%) maintain 36% or higher occupancy, suggesting good market fit and guest satisfaction.
- Typical properties (Median) have an occupancy rate around 22%.
- Entry-level properties (Bottom 25%) average 10% occupancy, potentially facing higher vacancy.
Average Monthly Occupancy Rate Trend in San José Ocotillos
Average Daily Rate (ADR) Airbnb Trends in San José Ocotillos (2026)
Effective short term rental pricing strategy in San José Ocotillos involves understanding monthly ADR fluctuations. The Average Daily Rate (ADR) for Airbnb in San José Ocotillos typically peaks in December and dips lowest during October. Leveraging Airbnb dynamic pricing tools or strategies based on this seasonality can significantly boost revenue. Here's a look at the typical nightly rates achieved:
- Best-in-class properties (Top 10%) command rates of $187+ per night, often due to premium features or locations.
- Strong performing properties (Top 25%) achieve nightly rates of $140 or more.
- Typical properties (Median) charge around $104 per night.
- Entry-level properties (Bottom 25%) earn around $78 per night.
Average Daily Rate (ADR) Trend by Month in San José Ocotillos
Get Live San José Ocotillos Market Intelligence 👇

Explore Real-time Analytics
Airbnb Seasonality Analysis & Trends in San José Ocotillos (2026)
Peak Season (December, August, July)
- Revenue averages $1,316 per month
- Occupancy rates average 31.5%
- Daily rates average $122
Shoulder Season
- Revenue averages $1,027 per month
- Occupancy maintains around 25.5%
- Daily rates hold near $118
Low Season (March, September, November)
- Revenue drops to average $849 per month
- Occupancy decreases to average 22.1%
- Daily rates adjust to average $116
Seasonality Insights for San José Ocotillos
- The Airbnb seasonality in San José Ocotillos shows moderate seasonality with distinct peak and low periods. While the sections above show seasonal averages, it's also insightful to look at the extremes:
- During the high season, the absolute peak month showcases San José Ocotillos's highest earning potential, with monthly revenues capable of climbing to $1,458, occupancy reaching a high of 32.5%, and ADRs peaking at $125.
- Conversely, the slowest single month of the year, typically falling within the low season, marks the market's lowest point. In this month, revenue might dip to $831, occupancy could drop to 21.4%, and ADRs may adjust down to $114.
- Understanding both the seasonal averages and these monthly peaks and troughs in revenue, occupancy, and ADR is crucial for maximizing your Airbnb profit potential in San José Ocotillos.
Seasonal Strategies for Maximizing Profit
- Peak Season: Maximize revenue through premium pricing and potentially longer minimum stays. Ensure high availability.
- Low Season: Offer competitive pricing, special promotions (e.g., extended stay discounts), and flexible cancellation policies. Target off-season travelers like remote workers or budget-conscious guests.
- Shoulder Seasons: Implement dynamic pricing that balances peak and low rates. Target weekend travelers or specific events. Offer slightly more flexible terms than peak season.
- Regularly analyze your own performance against these San José Ocotillos seasonality benchmarks and adjust your pricing and availability strategy accordingly.
Best Areas for Airbnb Investment in San José Ocotillos (2026)
Exploring the top neighborhoods for short-term rentals in San José Ocotillos? This section highlights key areas, outlining why they are attractive for hosts and guests, along with notable local attractions. Consider these locations based on your target guest profile and investment strategy.
| Neighborhood / Area | Why Host Here? (Target Guests & Appeal) | Key Attractions & Landmarks |
|---|---|---|
| Centro Histórico | The historic center of San José Ocotillos, featuring colonial architecture, cultural sites, and local markets. A vibrant place for tourists looking to explore the culture and history of the city. | Teatro de la Ciudad, Plaza Principal, Museum of Anthropology, Local artisan markets, Cathedral of San José |
| Parque Ecoturístico | A natural park offering lush green landscapes and outdoor activities. Popular with tourists seeking nature adventures and a peaceful retreat away from urban life. | Hiking trails, Picnic areas, Bird watching, Natural springs, Guided eco-tours |
| Zona de Restaurantes | A lively area filled with diverse dining options, attracting food lovers and those looking to experience local cuisine. | Local eateries, Food festivals, Street food markets, Culinary tours, Cafés and dessert shops |
| Barrio Antiguo | An old neighborhood with traditional architecture and historical significance. It offers a glimpse into the local culture and heritage. | Historical buildings, Artisan shops, Cultural festivals, Craft markets, Local music venues |
| Mercado Municipal | The municipal market is a hub for local products and an authentic cultural experience. Ideal for tourists looking to experience local life. | Fresh produce, Local handicrafts, Food stalls, Cultural events, Traditional snacks |
| Plaza de Toros | A well-known site for local events and entertainment, often attracting visitors looking for local festivals and bullfighting shows. | Bullfighting shows, Concerts, Cultural events, Food vendors, Local crafts |
| Colinas de San José | A residential area with beautiful views and quiet surroundings, appealing to families and those seeking tranquility. | Scenic views, Parks, Family-friendly activities, Walking trails, Community events |
| Universidad Autónoma | Nearby the main university, attracting students and visiting academics, providing a youthful and vibrant atmosphere. | University events, Art exhibitions, Student cafes, Library access, Cultural activities |
Understanding Airbnb License Requirements & STR Laws in San José Ocotillos (2026)
While San José Ocotillos, Hidalgo, Mexico currently shows low STR regulations, specific Airbnb license requirements might still exist or change. Always verify the latest short term rental regulations and Airbnb license requirements directly with local government authorities for San José Ocotillos to ensure full compliance before hosting.
(Source: AirROI data, 2026, based on 2% licensed listings)
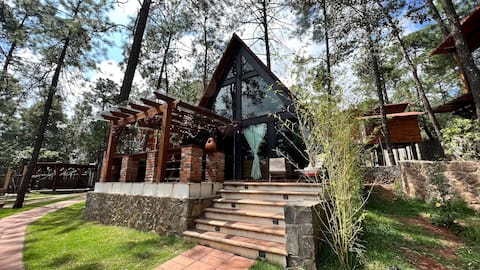
Top Performing Airbnb Properties in San José Ocotillos (2026)
Benchmark your potential! Explore examples of top-performing Airbnb properties in San José Ocotillosbased on Trailing Twelve Month (TTM) revenue. Analyze their characteristics, revenue, occupancy rate, and ADR to understand what drives success in this market.
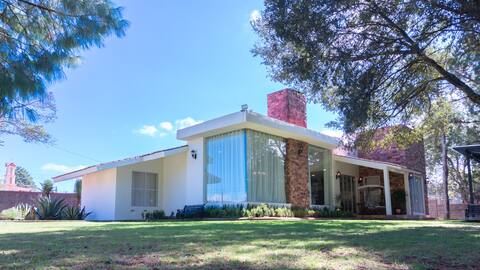
Tres Delias. Beautiful cabin in Huasca
Entire Place • 4 bedrooms
Forest hideaway 2
Entire Place • 2 bedrooms

Meraki by Punta del Bosque (Forest)
Entire Place • 2 bedrooms

Iguazú Cabin
Entire Place • 2 bedrooms
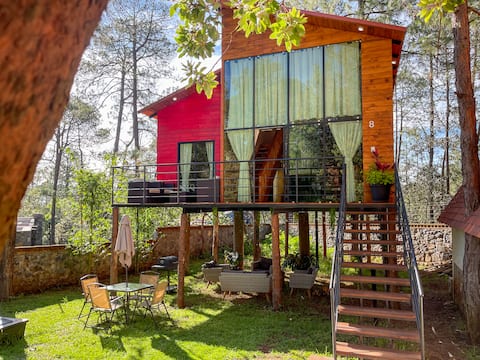
Forest hideaway 8
Entire Place • 3 bedrooms

Amazonia Cabana
Entire Place • 2 bedrooms
Note: Performance varies based on location, size, amenities, seasonality, and management quality. Data reflects the past 12 months.
Top Performing Airbnb Hosts in San José Ocotillos (2026)
Learn from the best! This table showcases top-performing Airbnb hosts in San José Ocotillos based on the number of properties managed and estimated total revenue over the past year. Analyze their scale and performance metrics.
| Host Name | Properties | Grossing Revenue | Stay Reviews | Avg Rating |
|---|---|---|---|---|
| Sergio | 8 | $163,397 | 406 | 4.83/5.0 |
| Ramón | 9 | $141,763 | 430 | 4.87/5.0 |
| José Ramon | 4 | $63,770 | 552 | 4.87/5.0 |
| Sandro De JESUS | 2 | $30,811 | 169 | 4.98/5.0 |
| Delia | 1 | $30,330 | 52 | 4.77/5.0 |
| Christian | 4 | $24,239 | 170 | 4.59/5.0 |
| Alma Gabriela | 2 | $20,970 | 30 | 4.97/5.0 |
| Eury | 1 | $18,148 | 33 | 4.73/5.0 |
| Regina | 1 | $16,253 | 24 | 4.67/5.0 |
| Erick | 2 | $15,467 | 202 | 4.78/5.0 |
Analyzing the strategies of top hosts, such as their property selection, pricing, and guest communication, can offer valuable lessons for optimizing your own Airbnb operations in San José Ocotillos.
Dive Deeper: Advanced San José Ocotillos STR Market Data (2026)
Ready to unlock more insights? AirROI provides access to advanced metrics and comprehensive Airbnb data for San José Ocotillos. Explore detailed analytics beyond this report to refine your investment strategy, optimize pricing, and maximize your vacation rental profits.
Explore Advanced MetricsSan José Ocotillos Short-Term Rental Market Composition (2026): Property & Room Types
Room Type Distribution
Property Type Distribution
Market Composition Insights for San José Ocotillos
- The San José Ocotillos Airbnb market composition is heavily skewed towards Entire Home/Apt listings, which make up 87.1% of the 62 active rentals. This indicates strong guest preference for privacy and space.
- Looking at the property type distribution in San José Ocotillos, Outdoor/Unique properties are the most common (46.8%), reflecting the local real estate landscape.
- Smaller segments like hotel/boutique, others (combined 4.8%) offer potential for unique stay experiences.
San José Ocotillos Airbnb Room Capacity Analysis (2026): Bedroom Distribution
Distribution of Listings by Number of Bedrooms
Room Capacity Insights for San José Ocotillos
- The dominant room capacity in San José Ocotillos is 2 bedrooms listings, making up 45.2% of the market. This suggests a strong demand for properties suitable for couples or solo travelers.
- Together, 2 bedrooms and 1 bedroom properties represent 77.5% of the active Airbnb listings in San José Ocotillos, indicating a high concentration in these sizes.
San José Ocotillos Vacation Rental Guest Capacity Trends (2026)
Distribution of Listings by Guest Capacity
Guest Capacity Insights for San José Ocotillos
- The most common guest capacity trend in San José Ocotillos vacation rentals is listings accommodating 4 guests (27.4%). This suggests the primary traveler segment is likely small families or groups.
- Properties designed for 4 guests and 2 guests dominate the San José Ocotillos STR market, accounting for 50.0% of listings.
- 27.4% of properties accommodate 6+ guests, serving the market segment for larger families or group travel in San José Ocotillos.
- On average, properties in San José Ocotillos are equipped to host 4.4 guests.
San José Ocotillos Airbnb Booking Patterns (2026): Available vs. Booked Days
Available Days Distribution
Booked Days Distribution
Booking Pattern Insights for San José Ocotillos
- The most common availability pattern in San José Ocotillos falls within the 271-366 days range, representing 62.9% of listings. This suggests many properties have significant open periods on their calendars.
- Approximately 93.5% of listings show high availability (181+ days open annually), indicating potential for increased bookings or specific owner usage patterns.
- For booked days, the 1-30 days range is most frequent in San José Ocotillos (37.1%), reflecting common guest stay durations or potential owner blocking patterns.
- A notable 6.5% of properties secure long booking periods (181+ days booked per year), highlighting successful long-term rental strategies or significant owner usage.
San José Ocotillos Airbnb Minimum Stay Requirements Analysis
Distribution of Listings by Minimum Night Requirement
1 Night
50 listings
80.6% of total
2 Nights
3 listings
4.8% of total
30+ Nights
9 listings
14.5% of total
Key Insights
- The most prevalent minimum stay requirement in San José Ocotillos is 1 Night, adopted by 80.6% of listings. This highlights the market's preference for shorter, flexible bookings.
- A strong majority (85.4%) of the San José Ocotillos Airbnb data shows acceptance of very short stays (1-2 nights), indicating a dynamic, high-turnover market.
- A significant segment (14.5%) caters to monthly stays (30+ nights) in San José Ocotillos, pointing to opportunities in the extended-stay market.
Recommendations
- Align with the market by considering a 1 Night minimum stay, as 80.6% of San José Ocotillos hosts use this setting.
- Explore offering discounts for stays of 30+ nights to attract the 14.5% of the market seeking extended stays.
- Adjust minimum nights based on seasonality – potentially shorter during low season and longer during peak demand periods in San José Ocotillos.
San José Ocotillos Airbnb Cancellation Policy Trends Analysis (2026)
Limited
1 listings
1.6% of total
Flexible
22 listings
35.5% of total
Moderate
26 listings
41.9% of total
Firm
13 listings
21% of total
Cancellation Policy Insights for San José Ocotillos
- The prevailing Airbnb cancellation policy trend in San José Ocotillos is Moderate, used by 41.9% of listings.
- The market strongly favors guest-friendly terms, with 77.4% of listings offering Flexible or Moderate policies. This suggests guests in San José Ocotillos may expect booking flexibility.
Recommendations for Hosts
- Consider adopting a Moderate policy to align with the 41.9% market standard in San José Ocotillos.
- Regularly review your cancellation policy against competitors and market demand shifts in San José Ocotillos.
San José Ocotillos STR Booking Lead Time Analysis (2026)
Average Booking Lead Time by Month
Booking Lead Time Insights for San José Ocotillos
- The overall average booking lead time for vacation rentals in San José Ocotillos is 27 days.
- Guests book furthest in advance for stays during December (average 57 days), likely coinciding with peak travel demand or local events.
- The shortest booking windows occur for stays in March (average 13 days), indicating more last-minute travel plans during this time.
- Seasonally, Winter (34 days avg.) sees the longest lead times, while Spring (17 days avg.) has the shortest, reflecting typical travel planning cycles.
Recommendations for Hosts
- Use the overall average lead time (27 days) as a baseline for your pricing and availability strategy in San José Ocotillos.
- For December stays, consider implementing length-of-stay discounts or slightly higher rates for bookings made less than 57 days out to capitalize on advance planning.
- During March, focus on last-minute booking availability and promotions, as guests book with very short notice (13 days avg.).
- Target marketing efforts for the Winter season well in advance (at least 34 days) to capture early planners.
- Monitor your own booking lead times against these San José Ocotillos averages to identify opportunities for dynamic pricing adjustments.
Popular & Essential Airbnb Amenities in San José Ocotillos (2026)
Amenity Prevalence
Amenity Insights for San José Ocotillos
- Essential amenities in San José Ocotillos that guests expect include: Free parking on premises. Lacking these (this) could significantly impact bookings.
- Popular amenities like Fire pit, Hot water, Fire extinguisher are common but not universal. Offering these can provide a competitive edge.
- Warning: Wifi is not universally provided but is considered essential globally. Ensure reliable Wifi is offered.
Recommendations for Hosts
- Ensure your listing includes all essential amenities for San José Ocotillos: Free parking on premises.
- Prioritize adding missing essentials: Free parking on premises.
- Consider adding popular differentiators like Fire pit or Hot water to increase appeal.
- Highlight unique or less common amenities you offer (e.g., hot tub, dedicated workspace, EV charger) in your listing description and photos.
- Regularly check competitor amenities in San José Ocotillos to stay competitive.
San José Ocotillos Airbnb Guest Demographics & Profile Analysis (2026)
Guest Profile Summary for San José Ocotillos
- The typical guest profile for Airbnb in San José Ocotillos consists of primarily domestic travelers (96%), often arriving from nearby Mexico City, typically belonging to the Post-2000s (Gen Z/Alpha) group (50%), primarily speaking Spanish or English.
- Domestic travelers account for 95.7% of guests.
- Key international markets include Mexico (95.7%) and United States (3.1%).
- Top languages spoken are Spanish (54.5%) followed by English (38.3%).
- A significant demographic segment is the Post-2000s (Gen Z/Alpha) group, representing 50% of guests.
Recommendations for Hosts
- Target domestic marketing efforts towards travelers from Mexico City and Santiago de Querétaro.
- Tailor amenities and listing descriptions to appeal to the dominant Post-2000s (Gen Z/Alpha) demographic (e.g., highlight fast WiFi, smart home features, local guides).
- Highlight unique local experiences or amenities relevant to the primary guest profile.
- Consider seasonal promotions aligned with peak travel times for key origin markets.
Nearby Short-Term Rental Market Comparison
How does the San José Ocotillos Airbnb market stack up against its neighbors? Compare key performance metrics like average monthly revenue, ADR, and occupancy rates in surrounding areas to understand the broader regional STR landscape.
| Market | Active Properties | Monthly Revenue | Daily Rate | Avg. Occupancy |
|---|---|---|---|---|
| Tepeji del Rio de Ocampo | 11 | $2,125 | $315.80 | 27% |
| La Tortuga | 71 | $1,658 | $239.12 | 28% |
| Cuauhtémoc | 13 | $1,344 | $93.02 | 54% |
| Juárez | 44 | $1,317 | $98.72 | 54% |
| Tzibantzá | 12 | $1,298 | $232.99 | 23% |
| Mexico City | 19,365 | $1,216 | $96.78 | 48% |
| San Francisco Mazapa | 15 | $1,155 | $93.59 | 39% |
| Jilotepec de Molina Enríquez | 10 | $1,138 | $169.51 | 23% |
| Ezequiel Montes | 33 | $1,096 | $137.22 | 23% |
| Santa Ana Portales | 175 | $1,062 | $187.63 | 22% |