San Antonio el Desmonte Airbnb Market Analysis 2026: Short Term Rental Data & Vacation Rental Statistics in Hidalgo, Mexico
Is Airbnb profitable in San Antonio el Desmonte in 2026? Explore comprehensive Airbnb analytics for San Antonio el Desmonte, Hidalgo, Mexico to uncover income potential. This 2026 STR market report for San Antonio el Desmonte, based on AirROI data from February 2025 to January 2026, reveals key trends in the niche market of 20 active listings.
Whether you're considering an Airbnb investment in San Antonio el Desmonte, optimizing your existing vacation rental, or exploring rental arbitrage opportunities, understanding the San Antonio el Desmonte Airbnb data is crucial. Leveraging the low regulation environment is key to maximizing your short term rental income potential. Let's dive into the specifics.
Key San Antonio el Desmonte Airbnb Performance Metrics Overview
Monthly Airbnb Revenue Variations & Income Potential in San Antonio el Desmonte (2026)
Understanding the monthly revenue variations for Airbnb listings in San Antonio el Desmonte is key to maximizing your short term rental income potential. Seasonality significantly impacts earnings. Our analysis, based on data from the past 12 months, shows that the peak revenue month for STRs in San Antonio el Desmonte is typically July, while January often presents the lowest earnings, highlighting opportunities for strategic pricing adjustments during shoulder and low seasons. Explore the typical Airbnb income in San Antonio el Desmonte across different performance tiers:
- Best-in-class properties (Top 10%) achieve $1,267+ monthly, often utilizing dynamic pricing and superior guest experiences.
- Strong performing properties (Top 25%) earn $720 or more, indicating effective management and desirable locations/amenities.
- Typical properties (Median) generate around $335 per month, representing the average market performance.
- Entry-level properties (Bottom 25%) see earnings around $166, often with potential for optimization.
Average Monthly Airbnb Earnings Trend in San Antonio el Desmonte
San Antonio el Desmonte Airbnb Occupancy Rate Trends (2026)
Maximize your bookings by understanding the San Antonio el Desmonte STR occupancy trends. Seasonal demand shifts significantly influence how often properties are booked. Typically, Octobersees the highest demand (peak season occupancy), while January experiences the lowest (low season). Effective strategies, like adjusting minimum stays or offering promotions, can boost occupancy during slower periods. Here's how different property tiers perform in San Antonio el Desmonte:
- Best-in-class properties (Top 10%) achieve 71%+ occupancy, indicating high desirability and potentially optimized availability.
- Strong performing properties (Top 25%) maintain 47% or higher occupancy, suggesting good market fit and guest satisfaction.
- Typical properties (Median) have an occupancy rate around 25%.
- Entry-level properties (Bottom 25%) average 15% occupancy, potentially facing higher vacancy.
Average Monthly Occupancy Rate Trend in San Antonio el Desmonte
Average Daily Rate (ADR) Airbnb Trends in San Antonio el Desmonte (2026)
Effective short term rental pricing strategy in San Antonio el Desmonte involves understanding monthly ADR fluctuations. The Average Daily Rate (ADR) for Airbnb in San Antonio el Desmonte typically peaks in January and dips lowest during September. Leveraging Airbnb dynamic pricing tools or strategies based on this seasonality can significantly boost revenue. Here's a look at the typical nightly rates achieved:
- Best-in-class properties (Top 10%) command rates of $84+ per night, often due to premium features or locations.
- Strong performing properties (Top 25%) achieve nightly rates of $55 or more.
- Typical properties (Median) charge around $33 per night.
- Entry-level properties (Bottom 25%) earn around $27 per night.
Average Daily Rate (ADR) Trend by Month in San Antonio el Desmonte
Get Live San Antonio el Desmonte Market Intelligence 👇

Explore Real-time Analytics
Airbnb Seasonality Analysis & Trends in San Antonio el Desmonte (2026)
Peak Season (July, October, December)
- Revenue averages $662 per month
- Occupancy rates average 40.1%
- Daily rates average $48
Shoulder Season
- Revenue averages $509 per month
- Occupancy maintains around 32.9%
- Daily rates hold near $47
Low Season (January, April, September)
- Revenue drops to average $381 per month
- Occupancy decreases to average 24.6%
- Daily rates adjust to average $48
Seasonality Insights for San Antonio el Desmonte
- The Airbnb seasonality in San Antonio el Desmonte shows highly seasonal trends requiring careful strategy. While the sections above show seasonal averages, it's also insightful to look at the extremes:
- During the high season, the absolute peak month showcases San Antonio el Desmonte's highest earning potential, with monthly revenues capable of climbing to $752, occupancy reaching a high of 41.9%, and ADRs peaking at $54.
- Conversely, the slowest single month of the year, typically falling within the low season, marks the market's lowest point. In this month, revenue might dip to $226, occupancy could drop to 16.8%, and ADRs may adjust down to $45.
- Understanding both the seasonal averages and these monthly peaks and troughs in revenue, occupancy, and ADR is crucial for maximizing your Airbnb profit potential in San Antonio el Desmonte.
Seasonal Strategies for Maximizing Profit
- Peak Season: Maximize revenue through premium pricing and potentially longer minimum stays. Ensure high availability.
- Low Season: Offer competitive pricing, special promotions (e.g., extended stay discounts), and flexible cancellation policies. Target off-season travelers like remote workers or budget-conscious guests.
- Shoulder Seasons: Implement dynamic pricing that balances peak and low rates. Target weekend travelers or specific events. Offer slightly more flexible terms than peak season.
- Regularly analyze your own performance against these San Antonio el Desmonte seasonality benchmarks and adjust your pricing and availability strategy accordingly.
Best Areas for Airbnb Investment in San Antonio el Desmonte (2026)
Exploring the top neighborhoods for short-term rentals in San Antonio el Desmonte? This section highlights key areas, outlining why they are attractive for hosts and guests, along with notable local attractions. Consider these locations based on your target guest profile and investment strategy.
| Neighborhood / Area | Why Host Here? (Target Guests & Appeal) | Key Attractions & Landmarks |
|---|---|---|
| Centro Histórico | Cultural heart of San Antonio with colonial architecture and rich history. Attracts tourists interested in history and local culture, with numerous monuments and museums. | Palacio Municipal, Parroquia San Antonio de Padua, Museo de Historia Mexicana, Plaza Principal, Mercado Juárez |
| Las Flores | A residential area that offers a local experience with proximity to local markets and parks. Ideal for families or long-term stays, providing a quieter atmosphere away from tourist crowds. | Parque Las Flores, Tianguis Las Flores (local market), Plaza de los Tres Cantos, Cafés and local eateries |
| Los Olivos | A peaceful neighborhood with modern amenities, popular with travelers seeking comfort and convenience. Close to shopping centers and parks, it suits families and longer stays well. | Centro Comercial Plaza del Sol, Parque Los Olivos, Cafés and shops, Local dining options |
| El Sáuz | Emerging area known for its affordability and proximity to natural attractions. Ideal for adventurous travelers looking for outdoor activities and local charm. | Cerro del Cujul, Ecological parks nearby, Hiking trails, Local artisan markets |
| Jardin | A vibrant neighborhood with a mix of traditional and modern influences, known for its food scene and lively atmosphere, attracting food enthusiasts and culture seekers. | Gastronomic fairs, Food markets, Artisan shops, Cafés and nightlife |
| Santa Rita | A family-friendly area with good schools and amenities, popular among local families and offers a home-like atmosphere for longer stays. | Parques de la comunidad, Local grocery stores, Community events, Nearby schools |
| La Cantimplora | Known for its scenic views and local parks, this neighborhood is perfect for nature lovers and those seeking a tranquil stay with access to outdoor activities. | Parks with scenic views, Walking trails, Local artisan workshops |
| San Miguel | A diverse area with a mix of locals and expatriates, known for its arts community and cultural activities. Ideal for creative travelers and those looking for a vibrant community experience. | Art galleries, Cultural festivals, Live music venues, Local craft fairs |
Understanding Airbnb License Requirements & STR Laws in San Antonio el Desmonte (2026)
While San Antonio el Desmonte, Hidalgo, Mexico currently shows low STR regulations, specific Airbnb license requirements might still exist or change. Always verify the latest short term rental regulations and Airbnb license requirements directly with local government authorities for San Antonio el Desmonte to ensure full compliance before hosting.
(Source: AirROI data, 2026, finding no licensed listings among those analyzed)
Top Performing Airbnb Properties in San Antonio el Desmonte (2026)
Benchmark your potential! Explore examples of top-performing Airbnb properties in San Antonio el Desmontebased on Trailing Twelve Month (TTM) revenue. Analyze their characteristics, revenue, occupancy rate, and ADR to understand what drives success in this market.

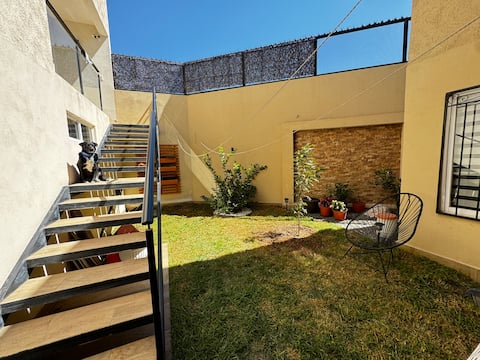
Casa Prisma, with an excellent location
Entire Place • 3 bedrooms
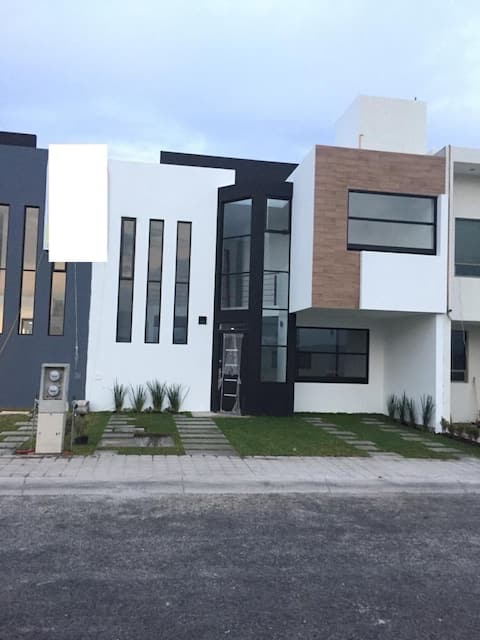
Casa Amadeus
Entire Place • 3 bedrooms

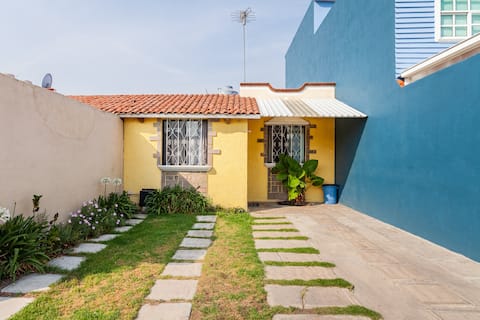
Beautiful house on the corner well located and safe
Entire Place • 3 bedrooms
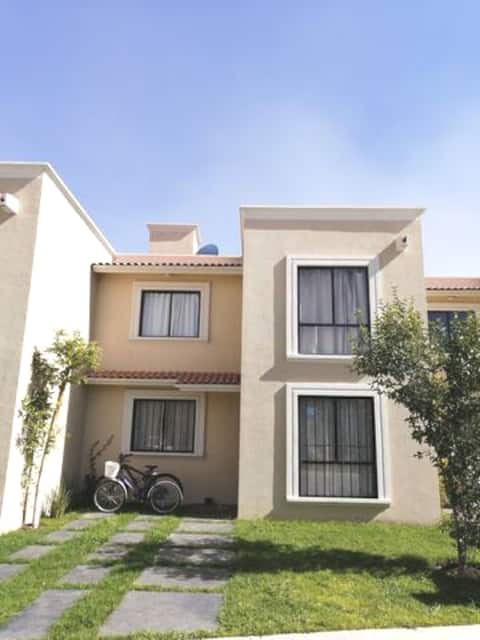
Casa Explanada 111
Entire Place • 3 bedrooms
My little house
Entire Place • 2 bedrooms
New house in Pachuca, one minute from ADO de Villas
Entire Place • 3 bedrooms
Note: Performance varies based on location, size, amenities, seasonality, and management quality. Data reflects the past 12 months.
Top Performing Airbnb Hosts in San Antonio el Desmonte (2026)
Learn from the best! This table showcases top-performing Airbnb hosts in San Antonio el Desmonte based on the number of properties managed and estimated total revenue over the past year. Analyze their scale and performance metrics.
| Host Name | Properties | Grossing Revenue | Stay Reviews | Avg Rating |
|---|---|---|---|---|
| Claudia | 1 | $13,922 | 33 | 4.91/5.0 |
| Lucero Salazar | 1 | $10,910 | 24 | 4.88/5.0 |
| Adriana | 1 | $10,507 | 35 | 4.94/5.0 |
| Iris | 1 | $10,057 | 10 | 4.40/5.0 |
| Luis Gerardo | 1 | $9,309 | 130 | 4.96/5.0 |
| David | 1 | $7,331 | 103 | 4.91/5.0 |
| Juan | 1 | $6,879 | 10 | 5.00/5.0 |
| Marco | 1 | $5,250 | 70 | 4.96/5.0 |
| Paola | 1 | $4,537 | 17 | 4.65/5.0 |
| Álvaro | 1 | $4,511 | 90 | 4.60/5.0 |
Analyzing the strategies of top hosts, such as their property selection, pricing, and guest communication, can offer valuable lessons for optimizing your own Airbnb operations in San Antonio el Desmonte.
Dive Deeper: Advanced San Antonio el Desmonte STR Market Data (2026)
Ready to unlock more insights? AirROI provides access to advanced metrics and comprehensive Airbnb data for San Antonio el Desmonte. Explore detailed analytics beyond this report to refine your investment strategy, optimize pricing, and maximize your vacation rental profits.
Explore Advanced MetricsSan Antonio el Desmonte Short-Term Rental Market Composition (2026): Property & Room Types
Room Type Distribution
Property Type Distribution
Market Composition Insights for San Antonio el Desmonte
- The San Antonio el Desmonte Airbnb market composition is heavily skewed towards Entire Home/Apt listings, which make up 75% of the 20 active rentals. This indicates strong guest preference for privacy and space.
- Looking at the property type distribution in San Antonio el Desmonte, House properties are the most common (80%), reflecting the local real estate landscape.
- Houses represent a significant 80% portion, catering likely to families or larger groups.
- The presence of 10% Hotel/Boutique listings indicates integration with traditional hospitality.
San Antonio el Desmonte Airbnb Room Capacity Analysis (2026): Bedroom Distribution
Distribution of Listings by Number of Bedrooms
Room Capacity Insights for San Antonio el Desmonte
- The dominant room capacity in San Antonio el Desmonte is 3 bedrooms listings, making up 45% of the market. This suggests a strong demand for properties suitable for families or small groups.
- Together, 3 bedrooms and 2 bedrooms properties represent 70.0% of the active Airbnb listings in San Antonio el Desmonte, indicating a high concentration in these sizes.
- A significant 45.0% of listings offer 3+ bedrooms, catering to larger groups and families seeking more space in San Antonio el Desmonte.
San Antonio el Desmonte Vacation Rental Guest Capacity Trends (2026)
Distribution of Listings by Guest Capacity
Guest Capacity Insights for San Antonio el Desmonte
- The most common guest capacity trend in San Antonio el Desmonte vacation rentals is listings accommodating 6 guests (20%). This suggests the primary traveler segment is likely larger groups.
- Properties designed for 6 guests and 4 guests dominate the San Antonio el Desmonte STR market, accounting for 40.0% of listings.
- 35.0% of properties accommodate 6+ guests, serving the market segment for larger families or group travel in San Antonio el Desmonte.
- On average, properties in San Antonio el Desmonte are equipped to host 4.1 guests.
San Antonio el Desmonte Airbnb Booking Patterns (2026): Available vs. Booked Days
Available Days Distribution
Booked Days Distribution
Booking Pattern Insights for San Antonio el Desmonte
- The most common availability pattern in San Antonio el Desmonte falls within the 181-270 days range, representing 55% of listings. This suggests many properties have significant open periods on their calendars.
- Approximately 90.0% of listings show high availability (181+ days open annually), indicating potential for increased bookings or specific owner usage patterns.
- For booked days, the 91-180 days range is most frequent in San Antonio el Desmonte (50%), reflecting common guest stay durations or potential owner blocking patterns.
- A notable 15.0% of properties secure long booking periods (181+ days booked per year), highlighting successful long-term rental strategies or significant owner usage.
San Antonio el Desmonte Airbnb Minimum Stay Requirements Analysis
Distribution of Listings by Minimum Night Requirement
1 Night
10 listings
50% of total
2 Nights
6 listings
30% of total
3 Nights
2 listings
10% of total
30+ Nights
2 listings
10% of total
Key Insights
- The most prevalent minimum stay requirement in San Antonio el Desmonte is 1 Night, adopted by 50% of listings. This highlights the market's preference for shorter, flexible bookings.
- A strong majority (80.0%) of the San Antonio el Desmonte Airbnb data shows acceptance of very short stays (1-2 nights), indicating a dynamic, high-turnover market.
Recommendations
- Align with the market by considering a 1 Night minimum stay, as 50% of San Antonio el Desmonte hosts use this setting.
- Explore offering discounts for stays of 30+ nights to attract the 10% of the market seeking extended stays.
- Adjust minimum nights based on seasonality – potentially shorter during low season and longer during peak demand periods in San Antonio el Desmonte.
San Antonio el Desmonte Airbnb Cancellation Policy Trends Analysis (2026)
Flexible
12 listings
60% of total
Moderate
6 listings
30% of total
Firm
1 listings
5% of total
Strict
1 listings
5% of total
Cancellation Policy Insights for San Antonio el Desmonte
- The prevailing Airbnb cancellation policy trend in San Antonio el Desmonte is Flexible, used by 60% of listings.
- The market strongly favors guest-friendly terms, with 90.0% of listings offering Flexible or Moderate policies. This suggests guests in San Antonio el Desmonte may expect booking flexibility.
- Strict cancellation policies are quite rare (5%), potentially making listings with this policy less competitive unless justified by high demand or property type.
Recommendations for Hosts
- Consider adopting a Flexible policy to align with the 60% market standard in San Antonio el Desmonte.
- Given the high prevalence of Flexible policies (60%), offering this can enhance booking appeal, especially during shoulder seasons.
- Using a Strict policy might deter some guests, as only 5% of listings use it. Evaluate if potential revenue protection outweighs possible lower booking rates.
- Regularly review your cancellation policy against competitors and market demand shifts in San Antonio el Desmonte.
San Antonio el Desmonte STR Booking Lead Time Analysis (2026)
Average Booking Lead Time by Month
Booking Lead Time Insights for San Antonio el Desmonte
- The overall average booking lead time for vacation rentals in San Antonio el Desmonte is 14 days.
- Guests book furthest in advance for stays during July (average 23 days), likely coinciding with peak travel demand or local events.
- The shortest booking windows occur for stays in June (average 6 days), indicating more last-minute travel plans during this time.
- Seasonally, Spring (16 days avg.) sees the longest lead times, while Fall (12 days avg.) has the shortest, reflecting typical travel planning cycles.
Recommendations for Hosts
- Use the overall average lead time (14 days) as a baseline for your pricing and availability strategy in San Antonio el Desmonte.
- During June, focus on last-minute booking availability and promotions, as guests book with very short notice (6 days avg.).
- Target marketing efforts for the Spring season well in advance (at least 16 days) to capture early planners.
- Monitor your own booking lead times against these San Antonio el Desmonte averages to identify opportunities for dynamic pricing adjustments.
Popular & Essential Airbnb Amenities in San Antonio el Desmonte (2026)
Amenity Prevalence
Amenity Insights for San Antonio el Desmonte
- Essential amenities in San Antonio el Desmonte that guests expect include: Wifi. Lacking these (this) could significantly impact bookings.
- Popular amenities like TV, Free parking on premises, Cooking basics are common but not universal. Offering these can provide a competitive edge.
Recommendations for Hosts
- Ensure your listing includes all essential amenities for San Antonio el Desmonte: Wifi.
- Prioritize adding missing essentials: Wifi.
- Consider adding popular differentiators like TV or Free parking on premises to increase appeal.
- Highlight unique or less common amenities you offer (e.g., hot tub, dedicated workspace, EV charger) in your listing description and photos.
- Regularly check competitor amenities in San Antonio el Desmonte to stay competitive.
San Antonio el Desmonte Airbnb Guest Demographics & Profile Analysis (2026)
Guest Profile Summary for San Antonio el Desmonte
- The typical guest profile for Airbnb in San Antonio el Desmonte consists of primarily domestic travelers (95%), often arriving from nearby Mexico City, typically belonging to the Post-2000s (Gen Z/Alpha) group (50%), primarily speaking Spanish or English.
- Domestic travelers account for 94.5% of guests.
- Key international markets include Mexico (94.5%) and United States (3.6%).
- Top languages spoken are Spanish (59.5%) followed by English (31.5%).
- A significant demographic segment is the Post-2000s (Gen Z/Alpha) group, representing 50% of guests.
Recommendations for Hosts
- Target domestic marketing efforts towards travelers from Mexico City and Santiago de Querétaro.
- Tailor amenities and listing descriptions to appeal to the dominant Post-2000s (Gen Z/Alpha) demographic (e.g., highlight fast WiFi, smart home features, local guides).
- Highlight unique local experiences or amenities relevant to the primary guest profile.
- Consider seasonal promotions aligned with peak travel times for key origin markets.
Nearby Short-Term Rental Market Comparison
How does the San Antonio el Desmonte Airbnb market stack up against its neighbors? Compare key performance metrics like average monthly revenue, ADR, and occupancy rates in surrounding areas to understand the broader regional STR landscape.
| Market | Active Properties | Monthly Revenue | Daily Rate | Avg. Occupancy |
|---|---|---|---|---|
| Tepeji del Rio de Ocampo | 11 | $2,125 | $315.80 | 27% |
| La Tortuga | 71 | $1,658 | $239.12 | 28% |
| Cuauhtémoc | 13 | $1,344 | $93.02 | 54% |
| Juárez | 44 | $1,317 | $98.72 | 54% |
| Tzibantzá | 12 | $1,298 | $232.99 | 23% |
| Mexico City | 19,365 | $1,216 | $96.78 | 48% |
| San Francisco Mazapa | 15 | $1,155 | $93.59 | 39% |
| Jilotepec de Molina Enríquez | 10 | $1,138 | $169.51 | 23% |
| Ezequiel Montes | 33 | $1,096 | $137.22 | 23% |
| Santa Ana Portales | 175 | $1,062 | $187.63 | 22% |