Mineral del Monte Airbnb Market Analysis 2026: Short Term Rental Data & Vacation Rental Statistics in Hidalgo, Mexico
Is Airbnb profitable in Mineral del Monte in 2026? Explore comprehensive Airbnb analytics for Mineral del Monte, Hidalgo, Mexico to uncover income potential. This 2026 STR market report for Mineral del Monte, based on AirROI data from February 2025 to January 2026, reveals key trends in the niche market of 122 active listings.
Whether you're considering an Airbnb investment in Mineral del Monte, optimizing your existing vacation rental, or exploring rental arbitrage opportunities, understanding the Mineral del Monte Airbnb data is crucial. Leveraging the low regulation environment is key to maximizing your short term rental income potential. Let's dive into the specifics.
Key Mineral del Monte Airbnb Performance Metrics Overview
Monthly Airbnb Revenue Variations & Income Potential in Mineral del Monte (2026)
Understanding the monthly revenue variations for Airbnb listings in Mineral del Monte is key to maximizing your short term rental income potential. Seasonality significantly impacts earnings. Our analysis, based on data from the past 12 months, shows that the peak revenue month for STRs in Mineral del Monte is typically December, while January often presents the lowest earnings, highlighting opportunities for strategic pricing adjustments during shoulder and low seasons. Explore the typical Airbnb income in Mineral del Monte across different performance tiers:
- Best-in-class properties (Top 10%) achieve $1,952+ monthly, often utilizing dynamic pricing and superior guest experiences.
- Strong performing properties (Top 25%) earn $1,117 or more, indicating effective management and desirable locations/amenities.
- Typical properties (Median) generate around $551 per month, representing the average market performance.
- Entry-level properties (Bottom 25%) see earnings around $238, often with potential for optimization.
Average Monthly Airbnb Earnings Trend in Mineral del Monte
Mineral del Monte Airbnb Occupancy Rate Trends (2026)
Maximize your bookings by understanding the Mineral del Monte STR occupancy trends. Seasonal demand shifts significantly influence how often properties are booked. Typically, Decembersees the highest demand (peak season occupancy), while January experiences the lowest (low season). Effective strategies, like adjusting minimum stays or offering promotions, can boost occupancy during slower periods. Here's how different property tiers perform in Mineral del Monte:
- Best-in-class properties (Top 10%) achieve 56%+ occupancy, indicating high desirability and potentially optimized availability.
- Strong performing properties (Top 25%) maintain 37% or higher occupancy, suggesting good market fit and guest satisfaction.
- Typical properties (Median) have an occupancy rate around 21%.
- Entry-level properties (Bottom 25%) average 10% occupancy, potentially facing higher vacancy.
Average Monthly Occupancy Rate Trend in Mineral del Monte
Average Daily Rate (ADR) Airbnb Trends in Mineral del Monte (2026)
Effective short term rental pricing strategy in Mineral del Monte involves understanding monthly ADR fluctuations. The Average Daily Rate (ADR) for Airbnb in Mineral del Monte typically peaks in December and dips lowest during March. Leveraging Airbnb dynamic pricing tools or strategies based on this seasonality can significantly boost revenue. Here's a look at the typical nightly rates achieved:
- Best-in-class properties (Top 10%) command rates of $143+ per night, often due to premium features or locations.
- Strong performing properties (Top 25%) achieve nightly rates of $102 or more.
- Typical properties (Median) charge around $78 per night.
- Entry-level properties (Bottom 25%) earn around $56 per night.
Average Daily Rate (ADR) Trend by Month in Mineral del Monte
Get Live Mineral del Monte Market Intelligence 👇

Explore Real-time Analytics
Airbnb Seasonality Analysis & Trends in Mineral del Monte (2026)
Peak Season (December, August, July)
- Revenue averages $1,121 per month
- Occupancy rates average 31.7%
- Daily rates average $96
Shoulder Season
- Revenue averages $786 per month
- Occupancy maintains around 24.7%
- Daily rates hold near $94
Low Season (January, March, April)
- Revenue drops to average $733 per month
- Occupancy decreases to average 23.4%
- Daily rates adjust to average $90
Seasonality Insights for Mineral del Monte
- The Airbnb seasonality in Mineral del Monte shows moderate seasonality with distinct peak and low periods. While the sections above show seasonal averages, it's also insightful to look at the extremes:
- During the high season, the absolute peak month showcases Mineral del Monte's highest earning potential, with monthly revenues capable of climbing to $1,251, occupancy reaching a high of 33.2%, and ADRs peaking at $109.
- Conversely, the slowest single month of the year, typically falling within the low season, marks the market's lowest point. In this month, revenue might dip to $718, occupancy could drop to 18.9%, and ADRs may adjust down to $82.
- Understanding both the seasonal averages and these monthly peaks and troughs in revenue, occupancy, and ADR is crucial for maximizing your Airbnb profit potential in Mineral del Monte.
Seasonal Strategies for Maximizing Profit
- Peak Season: Maximize revenue through premium pricing and potentially longer minimum stays. Ensure high availability.
- Low Season: Offer competitive pricing, special promotions (e.g., extended stay discounts), and flexible cancellation policies. Target off-season travelers like remote workers or budget-conscious guests.
- Shoulder Seasons: Implement dynamic pricing that balances peak and low rates. Target weekend travelers or specific events. Offer slightly more flexible terms than peak season.
- Regularly analyze your own performance against these Mineral del Monte seasonality benchmarks and adjust your pricing and availability strategy accordingly.
Best Areas for Airbnb Investment in Mineral del Monte (2026)
Exploring the top neighborhoods for short-term rentals in Mineral del Monte? This section highlights key areas, outlining why they are attractive for hosts and guests, along with notable local attractions. Consider these locations based on your target guest profile and investment strategy.
| Neighborhood / Area | Why Host Here? (Target Guests & Appeal) | Key Attractions & Landmarks |
|---|---|---|
| Pueblo Mágico de Mineral del Monte | This charming town is known for its colonial architecture, mining history, and pleasant climate. It's an attractive destination for tourists interested in culture and nature. | Templo de San Juan Bautista, Museo del Paste, Pueblo Fantasma de Real del Monte, Ex-hacienda de Acosta, Mirador de Mineral del Monte |
| La Cueva de los Cañones | A natural wonder with stunning rock formations and hiking opportunities. Great for nature enthusiasts and adventure travelers. | Cañon de Pachuquilla, Cueva del Cañon, La Vista, Rutas de senderismo, Picnic areas |
| El Cañón del Zopilote | Known for its breathtaking landscapes and outdoor activities. Attracts hikers and visitors looking for a peaceful escape in nature. | Sendero del Zopilote, Miradores, Áreas de camping, Rutas de escalada |
| Parque Nacional Los Archivos | A beautiful national park offering diverse flora and fauna. Popular for outdoor activities such as camping and hiking. | Senderos, Áreas de picnic, Fauna diversa, Miradores |
| Mineral del Monte Hot Springs | The town's hot springs provide a relaxing getaway for visitors looking to unwind after a day of exploring. | Aguas termales, Spas, Zonas de descanso |
| Historic Mining Sites | The rich mining history attracts tourists who are interested in the heritage and history of the area. Guided tours are popular. | Old mine tours, Historical museums, Mining exhibits |
| Cafés and Bakeries District | Home to delightful cafés and bakeries that serve traditional Mexican treats, making it a foodie hotspot within the town. | Pastelería San Ramiro, Café de la Tía, Chocolate artesanal, Local restaurants |
| Cultural Festivals | Mineral del Monte hosts various cultural festivals throughout the year, attracting visitors and providing a vibrant atmosphere. | Festival del Paste, Cultural events, Local artisans |
Understanding Airbnb License Requirements & STR Laws in Mineral del Monte (2026)
While Mineral del Monte, Hidalgo, Mexico currently shows low STR regulations, specific Airbnb license requirements might still exist or change. Always verify the latest short term rental regulations and Airbnb license requirements directly with local government authorities for Mineral del Monte to ensure full compliance before hosting.
(Source: AirROI data, 2026, finding no licensed listings among those analyzed)
Top Performing Airbnb Properties in Mineral del Monte (2026)
Benchmark your potential! Explore examples of top-performing Airbnb properties in Mineral del Montebased on Trailing Twelve Month (TTM) revenue. Analyze their characteristics, revenue, occupancy rate, and ADR to understand what drives success in this market.
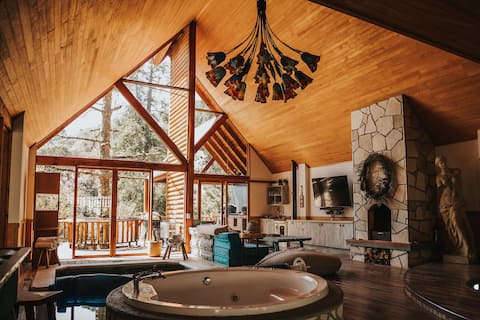
The forest's embrace.
Entire Place • 4 bedrooms
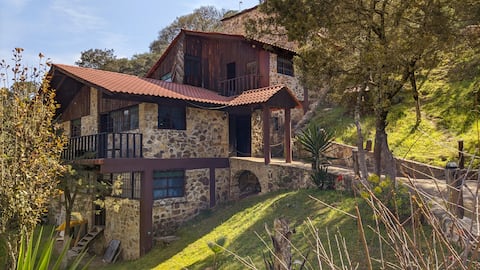
La Fortaleza
Entire Place • 5 bedrooms

Sleeping cabin
Entire Place • 3 bedrooms
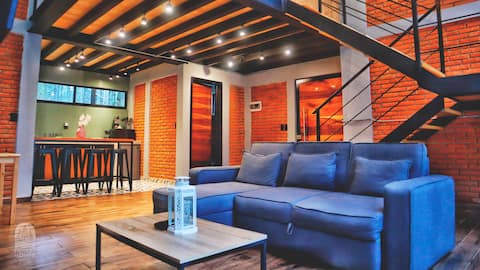
Forest House 4, Boutique Cabin
Entire Place • 1 bedroom
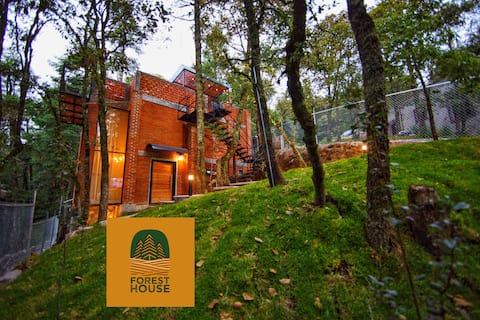
Forest House Cabin 1 Boutique Mineral del Monte
Entire Place • 1 bedroom

Forest Bathing Cabin
Entire Place • 5 bedrooms
Note: Performance varies based on location, size, amenities, seasonality, and management quality. Data reflects the past 12 months.
Top Performing Airbnb Hosts in Mineral del Monte (2026)
Learn from the best! This table showcases top-performing Airbnb hosts in Mineral del Monte based on the number of properties managed and estimated total revenue over the past year. Analyze their scale and performance metrics.
| Host Name | Properties | Grossing Revenue | Stay Reviews | Avg Rating |
|---|---|---|---|---|
| Carlos Franco | 13 | $96,436 | 1036 | 4.81/5.0 |
| Víctor Manuel | 3 | $84,863 | 875 | 4.97/5.0 |
| Gabriela | 7 | $76,276 | 1493 | 4.90/5.0 |
| Paulina | 1 | $67,744 | 42 | 4.79/5.0 |
| Luis | 2 | $50,288 | 376 | 4.92/5.0 |
| Edgar | 2 | $45,775 | 681 | 4.83/5.0 |
| Alejandra | 6 | $35,824 | 1022 | 4.76/5.0 |
| Troy | 3 | $33,407 | 313 | 4.83/5.0 |
| Gabriel | 1 | $31,598 | 91 | 4.98/5.0 |
| Luis Alberto | 2 | $29,198 | 63 | 4.62/5.0 |
Analyzing the strategies of top hosts, such as their property selection, pricing, and guest communication, can offer valuable lessons for optimizing your own Airbnb operations in Mineral del Monte.
Dive Deeper: Advanced Mineral del Monte STR Market Data (2026)
Ready to unlock more insights? AirROI provides access to advanced metrics and comprehensive Airbnb data for Mineral del Monte. Explore detailed analytics beyond this report to refine your investment strategy, optimize pricing, and maximize your vacation rental profits.
Explore Advanced MetricsMineral del Monte Short-Term Rental Market Composition (2026): Property & Room Types
Room Type Distribution
Property Type Distribution
Market Composition Insights for Mineral del Monte
- The Mineral del Monte Airbnb market composition is heavily skewed towards Entire Home/Apt listings, which make up 83.6% of the 122 active rentals. This indicates strong guest preference for privacy and space.
- Looking at the property type distribution in Mineral del Monte, Outdoor/Unique properties are the most common (53.3%), reflecting the local real estate landscape.
- Houses represent a significant 29.5% portion, catering likely to families or larger groups.
- The presence of 6.6% Hotel/Boutique listings indicates integration with traditional hospitality.
- Smaller segments like apartment/condo, others, unique stays (combined 10.6%) offer potential for unique stay experiences.
Mineral del Monte Airbnb Room Capacity Analysis (2026): Bedroom Distribution
Distribution of Listings by Number of Bedrooms
Room Capacity Insights for Mineral del Monte
- The dominant room capacity in Mineral del Monte is 1 bedroom listings, making up 58.2% of the market. This suggests a strong demand for properties suitable for couples or solo travelers.
- Together, 1 bedroom and 2 bedrooms properties represent 75.4% of the active Airbnb listings in Mineral del Monte, indicating a high concentration in these sizes.
- With over half the market (58.2%) consisting of studios or 1-bedroom units, Mineral del Monte is particularly well-suited for individuals or couples.
Mineral del Monte Vacation Rental Guest Capacity Trends (2026)
Distribution of Listings by Guest Capacity
Guest Capacity Insights for Mineral del Monte
- The most common guest capacity trend in Mineral del Monte vacation rentals is listings accommodating 2 guests (34.4%). This suggests the primary traveler segment is likely couples or solo travelers.
- Properties designed for 2 guests and 4 guests dominate the Mineral del Monte STR market, accounting for 60.6% of listings.
- 22.9% of properties accommodate 6+ guests, serving the market segment for larger families or group travel in Mineral del Monte.
- On average, properties in Mineral del Monte are equipped to host 3.8 guests.
Mineral del Monte Airbnb Booking Patterns (2026): Available vs. Booked Days
Available Days Distribution
Booked Days Distribution
Booking Pattern Insights for Mineral del Monte
- The most common availability pattern in Mineral del Monte falls within the 271-366 days range, representing 68.9% of listings. This suggests many properties have significant open periods on their calendars.
- Approximately 94.3% of listings show high availability (181+ days open annually), indicating potential for increased bookings or specific owner usage patterns.
- For booked days, the 31-90 days range is most frequent in Mineral del Monte (39.3%), reflecting common guest stay durations or potential owner blocking patterns.
- A notable 5.7% of properties secure long booking periods (181+ days booked per year), highlighting successful long-term rental strategies or significant owner usage.
Mineral del Monte Airbnb Minimum Stay Requirements Analysis
Distribution of Listings by Minimum Night Requirement
1 Night
103 listings
84.4% of total
2 Nights
14 listings
11.5% of total
4-6 Nights
1 listings
0.8% of total
30+ Nights
4 listings
3.3% of total
Key Insights
- The most prevalent minimum stay requirement in Mineral del Monte is 1 Night, adopted by 84.4% of listings. This highlights the market's preference for shorter, flexible bookings.
- A strong majority (95.9%) of the Mineral del Monte Airbnb data shows acceptance of very short stays (1-2 nights), indicating a dynamic, high-turnover market.
Recommendations
- Align with the market by considering a 1 Night minimum stay, as 84.4% of Mineral del Monte hosts use this setting.
- Adjust minimum nights based on seasonality – potentially shorter during low season and longer during peak demand periods in Mineral del Monte.
Mineral del Monte Airbnb Cancellation Policy Trends Analysis (2026)
Limited
2 listings
1.6% of total
Flexible
34 listings
27.9% of total
Moderate
54 listings
44.3% of total
Firm
25 listings
20.5% of total
Strict
7 listings
5.7% of total
Cancellation Policy Insights for Mineral del Monte
- The prevailing Airbnb cancellation policy trend in Mineral del Monte is Moderate, used by 44.3% of listings.
- The market strongly favors guest-friendly terms, with 72.2% of listings offering Flexible or Moderate policies. This suggests guests in Mineral del Monte may expect booking flexibility.
- Strict cancellation policies are quite rare (5.7%), potentially making listings with this policy less competitive unless justified by high demand or property type.
Recommendations for Hosts
- Consider adopting a Moderate policy to align with the 44.3% market standard in Mineral del Monte.
- Using a Strict policy might deter some guests, as only 5.7% of listings use it. Evaluate if potential revenue protection outweighs possible lower booking rates.
- Regularly review your cancellation policy against competitors and market demand shifts in Mineral del Monte.
Mineral del Monte STR Booking Lead Time Analysis (2026)
Average Booking Lead Time by Month
Booking Lead Time Insights for Mineral del Monte
- The overall average booking lead time for vacation rentals in Mineral del Monte is 17 days.
- Guests book furthest in advance for stays during December (average 29 days), likely coinciding with peak travel demand or local events.
- The shortest booking windows occur for stays in June (average 11 days), indicating more last-minute travel plans during this time.
- Seasonally, Winter (19 days avg.) sees the longest lead times, while Spring (13 days avg.) has the shortest, reflecting typical travel planning cycles.
Recommendations for Hosts
- Use the overall average lead time (17 days) as a baseline for your pricing and availability strategy in Mineral del Monte.
- For December stays, consider implementing length-of-stay discounts or slightly higher rates for bookings made less than 29 days out to capitalize on advance planning.
- Target marketing efforts for the Winter season well in advance (at least 19 days) to capture early planners.
- Monitor your own booking lead times against these Mineral del Monte averages to identify opportunities for dynamic pricing adjustments.
Popular & Essential Airbnb Amenities in Mineral del Monte (2026)
Amenity Prevalence
Amenity Insights for Mineral del Monte
- Essential amenities in Mineral del Monte that guests expect include: Wifi. Lacking these (this) could significantly impact bookings.
- Popular amenities like Hot water, Free parking on premises, Essentials are common but not universal. Offering these can provide a competitive edge.
Recommendations for Hosts
- Ensure your listing includes all essential amenities for Mineral del Monte: Wifi.
- Prioritize adding missing essentials: Wifi.
- Consider adding popular differentiators like Hot water or Free parking on premises to increase appeal.
- Highlight unique or less common amenities you offer (e.g., hot tub, dedicated workspace, EV charger) in your listing description and photos.
- Regularly check competitor amenities in Mineral del Monte to stay competitive.
Mineral del Monte Airbnb Guest Demographics & Profile Analysis (2026)
Guest Profile Summary for Mineral del Monte
- The typical guest profile for Airbnb in Mineral del Monte consists of primarily domestic travelers (96%), often arriving from nearby Mexico City, typically belonging to the Post-2000s (Gen Z/Alpha) group (50%), primarily speaking Spanish or English.
- Domestic travelers account for 96.4% of guests.
- Key international markets include Mexico (96.4%) and United States (1.3%).
- Top languages spoken are Spanish (54.4%) followed by English (35.3%).
- A significant demographic segment is the Post-2000s (Gen Z/Alpha) group, representing 50% of guests.
Recommendations for Hosts
- Target domestic marketing efforts towards travelers from Mexico City and Pachuca.
- Tailor amenities and listing descriptions to appeal to the dominant Post-2000s (Gen Z/Alpha) demographic (e.g., highlight fast WiFi, smart home features, local guides).
- Highlight unique local experiences or amenities relevant to the primary guest profile.
- Consider seasonal promotions aligned with peak travel times for key origin markets.
Nearby Short-Term Rental Market Comparison
How does the Mineral del Monte Airbnb market stack up against its neighbors? Compare key performance metrics like average monthly revenue, ADR, and occupancy rates in surrounding areas to understand the broader regional STR landscape.
| Market | Active Properties | Monthly Revenue | Daily Rate | Avg. Occupancy |
|---|---|---|---|---|
| Tepeji del Rio de Ocampo | 11 | $2,125 | $315.80 | 27% |
| La Tortuga | 71 | $1,658 | $239.12 | 28% |
| Cuauhtémoc | 13 | $1,344 | $93.02 | 54% |
| Juárez | 44 | $1,317 | $98.72 | 54% |
| Tzibantzá | 12 | $1,298 | $232.99 | 23% |
| Mexico City | 19,365 | $1,216 | $96.78 | 48% |
| San Francisco Mazapa | 15 | $1,155 | $93.59 | 39% |
| Jilotepec de Molina Enríquez | 10 | $1,138 | $169.51 | 23% |
| Ezequiel Montes | 33 | $1,096 | $137.22 | 23% |
| Santa Ana Portales | 175 | $1,062 | $187.63 | 22% |