Zihuatanejo Airbnb Market Analysis 2026: Short Term Rental Data & Vacation Rental Statistics in Guerrero, Mexico
Is Airbnb profitable in Zihuatanejo in 2026? Explore comprehensive Airbnb analytics for Zihuatanejo, Guerrero, Mexico to uncover income potential. This 2026 STR market report for Zihuatanejo, based on AirROI data from February 2025 to January 2026, reveals key trends in the market of 716 active listings.
Whether you're considering an Airbnb investment in Zihuatanejo, optimizing your existing vacation rental, or exploring rental arbitrage opportunities, understanding the Zihuatanejo Airbnb data is crucial. Leveraging the low regulation environment is key to maximizing your short term rental income potential. Let's dive into the specifics.
Key Zihuatanejo Airbnb Performance Metrics Overview
Monthly Airbnb Revenue Variations & Income Potential in Zihuatanejo (2026)
Understanding the monthly revenue variations for Airbnb listings in Zihuatanejo is key to maximizing your short term rental income potential. Seasonality significantly impacts earnings. Our analysis, based on data from the past 12 months, shows that the peak revenue month for STRs in Zihuatanejo is typically February, while September often presents the lowest earnings, highlighting opportunities for strategic pricing adjustments during shoulder and low seasons. Explore the typical Airbnb income in Zihuatanejo across different performance tiers:
- Best-in-class properties (Top 10%) achieve $4,174+ monthly, often utilizing dynamic pricing and superior guest experiences.
- Strong performing properties (Top 25%) earn $2,001 or more, indicating effective management and desirable locations/amenities.
- Typical properties (Median) generate around $868 per month, representing the average market performance.
- Entry-level properties (Bottom 25%) see earnings around $344, often with potential for optimization.
Average Monthly Airbnb Earnings Trend in Zihuatanejo
Zihuatanejo Airbnb Occupancy Rate Trends (2026)
Maximize your bookings by understanding the Zihuatanejo STR occupancy trends. Seasonal demand shifts significantly influence how often properties are booked. Typically, Februarysees the highest demand (peak season occupancy), while September experiences the lowest (low season). Effective strategies, like adjusting minimum stays or offering promotions, can boost occupancy during slower periods. Here's how different property tiers perform in Zihuatanejo:
- Best-in-class properties (Top 10%) achieve 69%+ occupancy, indicating high desirability and potentially optimized availability.
- Strong performing properties (Top 25%) maintain 48% or higher occupancy, suggesting good market fit and guest satisfaction.
- Typical properties (Median) have an occupancy rate around 27%.
- Entry-level properties (Bottom 25%) average 12% occupancy, potentially facing higher vacancy.
Average Monthly Occupancy Rate Trend in Zihuatanejo
Average Daily Rate (ADR) Airbnb Trends in Zihuatanejo (2026)
Effective short term rental pricing strategy in Zihuatanejo involves understanding monthly ADR fluctuations. The Average Daily Rate (ADR) for Airbnb in Zihuatanejo typically peaks in December and dips lowest during May. Leveraging Airbnb dynamic pricing tools or strategies based on this seasonality can significantly boost revenue. Here's a look at the typical nightly rates achieved:
- Best-in-class properties (Top 10%) command rates of $335+ per night, often due to premium features or locations.
- Strong performing properties (Top 25%) achieve nightly rates of $174 or more.
- Typical properties (Median) charge around $100 per night.
- Entry-level properties (Bottom 25%) earn around $60 per night.
Average Daily Rate (ADR) Trend by Month in Zihuatanejo
Get Live Zihuatanejo Market Intelligence 👇

Explore Real-time Analytics
Airbnb Seasonality Analysis & Trends in Zihuatanejo (2026)
Peak Season (February, March, December)
- Revenue averages $2,445 per month
- Occupancy rates average 43.6%
- Daily rates average $174
Shoulder Season
- Revenue averages $1,742 per month
- Occupancy maintains around 30.4%
- Daily rates hold near $169
Low Season (June, August, September)
- Revenue drops to average $1,288 per month
- Occupancy decreases to average 25.8%
- Daily rates adjust to average $160
Seasonality Insights for Zihuatanejo
- The Airbnb seasonality in Zihuatanejo shows highly seasonal trends requiring careful strategy. While the sections above show seasonal averages, it's also insightful to look at the extremes:
- During the high season, the absolute peak month showcases Zihuatanejo's highest earning potential, with monthly revenues capable of climbing to $2,670, occupancy reaching a high of 50.7%, and ADRs peaking at $191.
- Conversely, the slowest single month of the year, typically falling within the low season, marks the market's lowest point. In this month, revenue might dip to $1,132, occupancy could drop to 22.8%, and ADRs may adjust down to $158.
- Understanding both the seasonal averages and these monthly peaks and troughs in revenue, occupancy, and ADR is crucial for maximizing your Airbnb profit potential in Zihuatanejo.
Seasonal Strategies for Maximizing Profit
- Peak Season: Maximize revenue through premium pricing and potentially longer minimum stays. Ensure high availability.
- Low Season: Offer competitive pricing, special promotions (e.g., extended stay discounts), and flexible cancellation policies. Target off-season travelers like remote workers or budget-conscious guests.
- Shoulder Seasons: Implement dynamic pricing that balances peak and low rates. Target weekend travelers or specific events. Offer slightly more flexible terms than peak season.
- Regularly analyze your own performance against these Zihuatanejo seasonality benchmarks and adjust your pricing and availability strategy accordingly.
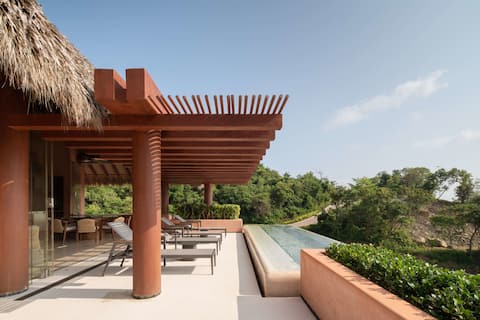
Best Areas for Airbnb Investment in Zihuatanejo (2026)
Exploring the top neighborhoods for short-term rentals in Zihuatanejo? This section highlights key areas, outlining why they are attractive for hosts and guests, along with notable local attractions. Consider these locations based on your target guest profile and investment strategy.
| Neighborhood / Area | Why Host Here? (Target Guests & Appeal) | Key Attractions & Landmarks |
|---|---|---|
| La Ropa Beach | One of the most popular beaches in Zihuatanejo, known for its beautiful sunsets, calm waters, and vibrant atmosphere. Ideal for tourists looking for relaxation and water activities. | Zihuatanejo Bay, La Ropa Beach restaurants, Water sports activities, Sunset views |
| Downtown Zihuatanejo | A charming area with local markets, shops, and restaurants that offer an authentic Mexican experience. Great for visitors who want to immerse themselves in the local culture. | Zocalo, Cultural center, Local food markets, Artisan shops |
| Ixtapa | A modern resort area that offers upscale amenities, golf courses, and a lively nightlife. Attracts tourists looking for a more luxurious vacation experience. | Ixtapa Island, Golf courses, Marinas, Nightclubs |
| Playa Las Gatas | A secluded beach famous for its tranquil waters and scenic beauty, perfect for family vacations and snorkeling enthusiasts. | Snorkeling spots, Beach clubs, Fresh seafood dining |
| Cerro del Vigia | A hillside area offering panoramic views of the bay and ocean. Popular for vacation rentals that provide a more private and exclusive experience. | Viewpoints, Hiking trails, Luxury villas |
| Playa Larga | A quieter, less crowded beach option that appeals to those looking for peace and tranquility while still being close to Zihuatanejo's attractions. | Beautiful scenery, Relaxed atmosphere, Fishing opportunities |
| Las Salinas | A beautiful beachfront area with a mix of local culture and tourist amenities. It’s known for its beautiful beach and access to local attractions. | Local eateries, Water sports, Scenic beach walks |
| Pueblo Nuevo | An up-and-coming neighborhood with affordable lodging and a taste of local life. Ideal for budget travelers who want to explore Zihuatanejo without overspending. | Local markets, Authentic food stalls, Community events |
Understanding Airbnb License Requirements & STR Laws in Zihuatanejo (2026)
While Zihuatanejo, Guerrero, Mexico currently shows low STR regulations, specific Airbnb license requirements might still exist or change. Always verify the latest short term rental regulations and Airbnb license requirements directly with local government authorities for Zihuatanejo to ensure full compliance before hosting.
(Source: AirROI data, 2026, based on 1% licensed listings)
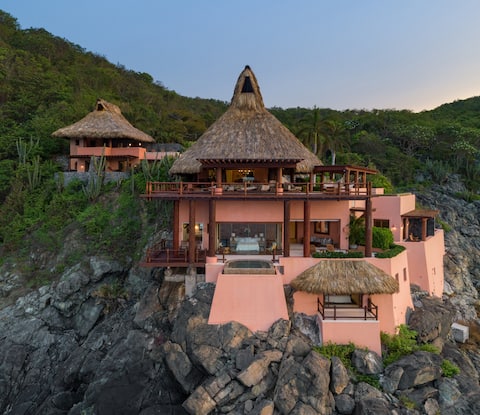
Top Performing Airbnb Properties in Zihuatanejo (2026)
Benchmark your potential! Explore examples of top-performing Airbnb properties in Zihuatanejobased on Trailing Twelve Month (TTM) revenue. Analyze their characteristics, revenue, occupancy rate, and ADR to understand what drives success in this market.

Beachfront Home in La Ropa with Pickleball Court!
Entire Place • 4 bedrooms

Casa Angelina: 5 Pools, Big Views & Walk to Beach
Entire Place • 7 bedrooms

Casa Yuri Luxury Cliffside Villa
Entire Place • 6 bedrooms
Exclusive Penthouse with Access to Playa las Gatas
Entire Place • 3 bedrooms
Casa Garrobo: Staffed Oceanfront Estate, 3 Pools
Entire Place • 7 bedrooms

Exclusive Villa in Punta Garrobo Playa Las Gatas
Entire Place • 3 bedrooms
Note: Performance varies based on location, size, amenities, seasonality, and management quality. Data reflects the past 12 months.
Top Performing Airbnb Hosts in Zihuatanejo (2026)
Learn from the best! This table showcases top-performing Airbnb hosts in Zihuatanejo based on the number of properties managed and estimated total revenue over the past year. Analyze their scale and performance metrics.
| Host Name | Properties | Grossing Revenue | Stay Reviews | Avg Rating |
|---|---|---|---|---|
| Property Rental Club | 25 | $628,553 | 630 | 4.72/5.0 |
| Eric | 2 | $305,793 | 17 | 5.00/5.0 |
| J A B Properties | 2 | $264,117 | 256 | 4.90/5.0 |
| Hector Felipe | 4 | $247,638 | 178 | 4.80/5.0 |
| Maru & Joaquín Caraza | 7 | $226,088 | 377 | 4.96/5.0 |
| Gil | 1 | $185,838 | 62 | 4.92/5.0 |
| Mauricio | 1 | $161,092 | 1 | Not Rated |
| Aharon | 3 | $157,894 | 10 | 5.00/5.0 |
| Derek | 6 | $150,961 | 300 | 4.91/5.0 |
| Rita | 5 | $129,576 | 793 | 4.87/5.0 |
Analyzing the strategies of top hosts, such as their property selection, pricing, and guest communication, can offer valuable lessons for optimizing your own Airbnb operations in Zihuatanejo.
Dive Deeper: Advanced Zihuatanejo STR Market Data (2026)
Ready to unlock more insights? AirROI provides access to advanced metrics and comprehensive Airbnb data for Zihuatanejo. Explore detailed analytics beyond this report to refine your investment strategy, optimize pricing, and maximize your vacation rental profits.
Explore Advanced MetricsZihuatanejo Short-Term Rental Market Composition (2026): Property & Room Types
Room Type Distribution
Property Type Distribution
Market Composition Insights for Zihuatanejo
- The Zihuatanejo Airbnb market composition is heavily skewed towards Entire Home/Apt listings, which make up 72.6% of the 716 active rentals. This indicates strong guest preference for privacy and space.
- Looking at the property type distribution in Zihuatanejo, Apartment/Condo properties are the most common (50.1%), reflecting the local real estate landscape.
- Houses represent a significant 31.4% portion, catering likely to families or larger groups.
- The presence of 15.1% Hotel/Boutique listings indicates integration with traditional hospitality.
- Smaller segments like others, outdoor/unique, unique stays (combined 3.4%) offer potential for unique stay experiences.
Zihuatanejo Airbnb Room Capacity Analysis (2026): Bedroom Distribution
Distribution of Listings by Number of Bedrooms
Room Capacity Insights for Zihuatanejo
- The dominant room capacity in Zihuatanejo is 1 bedroom listings, making up 43.3% of the market. This suggests a strong demand for properties suitable for couples or solo travelers.
- Together, 1 bedroom and 2 bedrooms properties represent 66.5% of the active Airbnb listings in Zihuatanejo, indicating a high concentration in these sizes.
- A significant 20.4% of listings offer 3+ bedrooms, catering to larger groups and families seeking more space in Zihuatanejo.
Zihuatanejo Vacation Rental Guest Capacity Trends (2026)
Distribution of Listings by Guest Capacity
Guest Capacity Insights for Zihuatanejo
- The most common guest capacity trend in Zihuatanejo vacation rentals is listings accommodating 2 guests (26.3%). This suggests the primary traveler segment is likely couples or solo travelers.
- Properties designed for 2 guests and 4 guests dominate the Zihuatanejo STR market, accounting for 49.8% of listings.
- 26.0% of properties accommodate 6+ guests, serving the market segment for larger families or group travel in Zihuatanejo.
- On average, properties in Zihuatanejo are equipped to host 3.8 guests.
Zihuatanejo Airbnb Booking Patterns (2026): Available vs. Booked Days
Available Days Distribution
Booked Days Distribution
Booking Pattern Insights for Zihuatanejo
- The most common availability pattern in Zihuatanejo falls within the 271-366 days range, representing 70.9% of listings. This suggests many properties have significant open periods on their calendars.
- Approximately 93.4% of listings show high availability (181+ days open annually), indicating potential for increased bookings or specific owner usage patterns.
- For booked days, the 31-90 days range is most frequent in Zihuatanejo (37.8%), reflecting common guest stay durations or potential owner blocking patterns.
- A notable 7.0% of properties secure long booking periods (181+ days booked per year), highlighting successful long-term rental strategies or significant owner usage.
Zihuatanejo Airbnb Minimum Stay Requirements Analysis
Distribution of Listings by Minimum Night Requirement
1 Night
176 listings
24.6% of total
2 Nights
218 listings
30.4% of total
3 Nights
63 listings
8.8% of total
4-6 Nights
59 listings
8.2% of total
7-29 Nights
8 listings
1.1% of total
30+ Nights
192 listings
26.8% of total
Key Insights
- The most prevalent minimum stay requirement in Zihuatanejo is 2 Nights, adopted by 30.4% of listings. This highlights the market's preference for shorter, flexible bookings.
- A significant segment (26.8%) caters to monthly stays (30+ nights) in Zihuatanejo, pointing to opportunities in the extended-stay market.
Recommendations
- Align with the market by considering a 2 Nights minimum stay, as 30.4% of Zihuatanejo hosts use this setting.
- If feasible, allowing 1-night stays, especially midweek or during low season, could capture last-minute bookings, as only 24.6% currently do.
- Explore offering discounts for stays of 30+ nights to attract the 26.8% of the market seeking extended stays.
- Adjust minimum nights based on seasonality – potentially shorter during low season and longer during peak demand periods in Zihuatanejo.
Zihuatanejo Airbnb Cancellation Policy Trends Analysis (2026)
Limited
4 listings
0.6% of total
Super Strict 30 Days
24 listings
3.4% of total
Super Strict 60 Days
7 listings
1% of total
Flexible
177 listings
24.8% of total
Moderate
158 listings
22.2% of total
Firm
261 listings
36.6% of total
Strict
82 listings
11.5% of total
Cancellation Policy Insights for Zihuatanejo
- The prevailing Airbnb cancellation policy trend in Zihuatanejo is Firm, used by 36.6% of listings.
- There's a relatively balanced mix between guest-friendly (47.0%) and stricter (48.1%) policies, offering choices for different guest needs.
Recommendations for Hosts
- Consider adopting a Firm policy to align with the 36.6% market standard in Zihuatanejo.
- Using a Strict policy might deter some guests, as only 11.5% of listings use it. Evaluate if potential revenue protection outweighs possible lower booking rates.
- Regularly review your cancellation policy against competitors and market demand shifts in Zihuatanejo.
Zihuatanejo STR Booking Lead Time Analysis (2026)
Average Booking Lead Time by Month
Booking Lead Time Insights for Zihuatanejo
- The overall average booking lead time for vacation rentals in Zihuatanejo is 61 days.
- Guests book furthest in advance for stays during February (average 104 days), likely coinciding with peak travel demand or local events.
- The shortest booking windows occur for stays in August (average 28 days), indicating more last-minute travel plans during this time.
- Seasonally, Winter (89 days avg.) sees the longest lead times, while Summer (29 days avg.) has the shortest, reflecting typical travel planning cycles.
Recommendations for Hosts
- Use the overall average lead time (61 days) as a baseline for your pricing and availability strategy in Zihuatanejo.
- For February stays, consider implementing length-of-stay discounts or slightly higher rates for bookings made less than 104 days out to capitalize on advance planning.
- Target marketing efforts for the Winter season well in advance (at least 89 days) to capture early planners.
- Monitor your own booking lead times against these Zihuatanejo averages to identify opportunities for dynamic pricing adjustments.
Popular & Essential Airbnb Amenities in Zihuatanejo (2026)
Amenity Prevalence
Amenity Insights for Zihuatanejo
- Essential amenities in Zihuatanejo that guests expect include: Wifi, Air conditioning. Lacking these (any) could significantly impact bookings.
- Popular amenities like Kitchen, TV, Essentials are common but not universal. Offering these can provide a competitive edge.
Recommendations for Hosts
- Ensure your listing includes all essential amenities for Zihuatanejo: Wifi, Air conditioning.
- Prioritize adding missing essentials: Wifi, Air conditioning.
- Consider adding popular differentiators like Kitchen or TV to increase appeal.
- Highlight unique or less common amenities you offer (e.g., hot tub, dedicated workspace, EV charger) in your listing description and photos.
- Regularly check competitor amenities in Zihuatanejo to stay competitive.
Zihuatanejo Airbnb Guest Demographics & Profile Analysis (2026)
Guest Profile Summary for Zihuatanejo
- The typical guest profile for Airbnb in Zihuatanejo consists of a mix of domestic (53%) and international guests, often arriving from nearby Mexico City, typically belonging to the Post-2000s (Gen Z/Alpha) group (50%), primarily speaking Spanish or English.
- Domestic travelers account for 52.7% of guests.
- Key international markets include Mexico (52.7%) and United States (30.2%).
- Top languages spoken are Spanish (46%) followed by English (42.8%).
- A significant demographic segment is the Post-2000s (Gen Z/Alpha) group, representing 50% of guests.
Recommendations for Hosts
- Balance marketing efforts between domestic and international channels based on the guest mix.
- Tailor amenities and listing descriptions to appeal to the dominant Post-2000s (Gen Z/Alpha) demographic (e.g., highlight fast WiFi, smart home features, local guides).
- Highlight unique local experiences or amenities relevant to the primary guest profile.
- Consider seasonal promotions aligned with peak travel times for key origin markets.
Nearby Short-Term Rental Market Comparison
How does the Zihuatanejo Airbnb market stack up against its neighbors? Compare key performance metrics like average monthly revenue, ADR, and occupancy rates in surrounding areas to understand the broader regional STR landscape.
| Market | Active Properties | Monthly Revenue | Daily Rate | Avg. Occupancy |
|---|---|---|---|---|
| Playa La Saladita | 27 | $2,397 | $225.80 | 44% |
| Troncones | 175 | $1,831 | $286.23 | 29% |
| Colonia Aeropuerto | 92 | $1,819 | $305.45 | 27% |
| Guerrero | 28 | $1,795 | $223.86 | 29% |
| La Saladita | 26 | $1,667 | $193.82 | 34% |
| Ixtapa | 316 | $1,616 | $272.62 | 31% |
| Pie de la Cuesta | 69 | $1,248 | $181.81 | 26% |
| Playa Blanca | 20 | $1,191 | $259.61 | 26% |
| Barra de Potosí | 18 | $968 | $148.57 | 27% |
| Playa Azul | 18 | $930 | $178.22 | 21% |