Taxco Airbnb Market Analysis 2026: Short Term Rental Data & Vacation Rental Statistics in Guerrero, Mexico
Is Airbnb profitable in Taxco in 2026? Explore comprehensive Airbnb analytics for Taxco, Guerrero, Mexico to uncover income potential. This 2026 STR market report for Taxco, based on AirROI data from February 2025 to January 2026, reveals key trends in the market of 360 active listings.
Whether you're considering an Airbnb investment in Taxco, optimizing your existing vacation rental, or exploring rental arbitrage opportunities, understanding the Taxco Airbnb data is crucial. Leveraging the low regulation environment is key to maximizing your short term rental income potential. Let's dive into the specifics.
Key Taxco Airbnb Performance Metrics Overview
Monthly Airbnb Revenue Variations & Income Potential in Taxco (2026)
Understanding the monthly revenue variations for Airbnb listings in Taxco is key to maximizing your short term rental income potential. Seasonality significantly impacts earnings. Our analysis, based on data from the past 12 months, shows that the peak revenue month for STRs in Taxco is typically December, while June often presents the lowest earnings, highlighting opportunities for strategic pricing adjustments during shoulder and low seasons. Explore the typical Airbnb income in Taxco across different performance tiers:
- Best-in-class properties (Top 10%) achieve $860+ monthly, often utilizing dynamic pricing and superior guest experiences.
- Strong performing properties (Top 25%) earn $526 or more, indicating effective management and desirable locations/amenities.
- Typical properties (Median) generate around $273 per month, representing the average market performance.
- Entry-level properties (Bottom 25%) see earnings around $137, often with potential for optimization.
Average Monthly Airbnb Earnings Trend in Taxco
Taxco Airbnb Occupancy Rate Trends (2026)
Maximize your bookings by understanding the Taxco STR occupancy trends. Seasonal demand shifts significantly influence how often properties are booked. Typically, Decembersees the highest demand (peak season occupancy), while June experiences the lowest (low season). Effective strategies, like adjusting minimum stays or offering promotions, can boost occupancy during slower periods. Here's how different property tiers perform in Taxco:
- Best-in-class properties (Top 10%) achieve 49%+ occupancy, indicating high desirability and potentially optimized availability.
- Strong performing properties (Top 25%) maintain 34% or higher occupancy, suggesting good market fit and guest satisfaction.
- Typical properties (Median) have an occupancy rate around 19%.
- Entry-level properties (Bottom 25%) average 9% occupancy, potentially facing higher vacancy.
Average Monthly Occupancy Rate Trend in Taxco
Average Daily Rate (ADR) Airbnb Trends in Taxco (2026)
Effective short term rental pricing strategy in Taxco involves understanding monthly ADR fluctuations. The Average Daily Rate (ADR) for Airbnb in Taxco typically peaks in December and dips lowest during March. Leveraging Airbnb dynamic pricing tools or strategies based on this seasonality can significantly boost revenue. Here's a look at the typical nightly rates achieved:
- Best-in-class properties (Top 10%) command rates of $109+ per night, often due to premium features or locations.
- Strong performing properties (Top 25%) achieve nightly rates of $70 or more.
- Typical properties (Median) charge around $47 per night.
- Entry-level properties (Bottom 25%) earn around $34 per night.
Average Daily Rate (ADR) Trend by Month in Taxco
Get Live Taxco Market Intelligence 👇

Explore Real-time Analytics
Airbnb Seasonality Analysis & Trends in Taxco (2026)
Peak Season (December, July, November)
- Revenue averages $519 per month
- Occupancy rates average 26.9%
- Daily rates average $65
Shoulder Season
- Revenue averages $387 per month
- Occupancy maintains around 22.6%
- Daily rates hold near $62
Low Season (February, March, June)
- Revenue drops to average $319 per month
- Occupancy decreases to average 21.7%
- Daily rates adjust to average $59
Seasonality Insights for Taxco
- The Airbnb seasonality in Taxco shows highly seasonal trends requiring careful strategy. While the sections above show seasonal averages, it's also insightful to look at the extremes:
- During the high season, the absolute peak month showcases Taxco's highest earning potential, with monthly revenues capable of climbing to $649, occupancy reaching a high of 29.8%, and ADRs peaking at $68.
- Conversely, the slowest single month of the year, typically falling within the low season, marks the market's lowest point. In this month, revenue might dip to $302, occupancy could drop to 19.3%, and ADRs may adjust down to $57.
- Understanding both the seasonal averages and these monthly peaks and troughs in revenue, occupancy, and ADR is crucial for maximizing your Airbnb profit potential in Taxco.
Seasonal Strategies for Maximizing Profit
- Peak Season: Maximize revenue through premium pricing and potentially longer minimum stays. Ensure high availability.
- Low Season: Offer competitive pricing, special promotions (e.g., extended stay discounts), and flexible cancellation policies. Target off-season travelers like remote workers or budget-conscious guests.
- Shoulder Seasons: Implement dynamic pricing that balances peak and low rates. Target weekend travelers or specific events. Offer slightly more flexible terms than peak season.
- Regularly analyze your own performance against these Taxco seasonality benchmarks and adjust your pricing and availability strategy accordingly.
Best Areas for Airbnb Investment in Taxco (2026)
Exploring the top neighborhoods for short-term rentals in Taxco? This section highlights key areas, outlining why they are attractive for hosts and guests, along with notable local attractions. Consider these locations based on your target guest profile and investment strategy.
| Neighborhood / Area | Why Host Here? (Target Guests & Appeal) | Key Attractions & Landmarks |
|---|---|---|
| Centro Histórico | The historic center of Taxco, known for its colonial architecture and vibrant atmosphere. A prime location for visitors exploring the rich history and culture of the town. | Santa Prisca Church, Plaza Borda, Taxco Silver Museum, Casa de la Cultura, Eagle Monument, Local artisan shops |
| Vista Alegre | This area offers stunning views of Taxco and is known for its luxury accommodations. Popular with travelers looking for a relaxing stay with breathtaking scenery. | Mirador de Taxco, Silverado Hotel, Art galleries, Nature trails, Convenient access to dining options |
| El Tepozteco | A beautiful area located in the mountains surrounding Taxco, popular for nature lovers and outdoor enthusiasts. Ideal for hiking and enjoying the natural beauty of the region. | Hiking trails, Natural parks, Scenic views, Birdwatching opportunities, Local flora and fauna |
| Plaza de las Victorias | A vibrant area with shopping, dining, and entertainment options. Great for travelers interested in the local lifestyle and nightlife. | Local markets, Restaurants, Cafes, Artisan shops, Nightlife venues |
| Taxco Viejo | This neighborhood retains the old-world charm of Taxco with narrow streets and colonial-style homes. Perfect for visitors looking for an authentic experience. | Cobblestone streets, Historical buildings, Local markets, Traditional restaurants, Cultural festivals |
| Jardín de la Borda | A picturesque park area that's great for relaxation and socializing. Attracts families and couples looking for a serene environment. | Beautiful gardens, Water features, Public art, Seating areas, Cafes nearby |
| Las Palomas | A quieter residential area that provides a peaceful retreat for guests. Ideal for those looking for a tranquil stay away from the hustle and bustle. | Local parks, Family-friendly atmosphere, Quiet streets, Close to public transport, Overlooks the town |
| Santa María | An emerging neighborhood that's gaining popularity for its affordability and charm. Suitable for budget travelers and long-term stays. | Local eateries, Markets, Community events, Artisan workshops, Affordable accommodations |
Understanding Airbnb License Requirements & STR Laws in Taxco (2026)
While Taxco, Guerrero, Mexico currently shows low STR regulations, specific Airbnb license requirements might still exist or change. Always verify the latest short term rental regulations and Airbnb license requirements directly with local government authorities for Taxco to ensure full compliance before hosting.
(Source: AirROI data, 2026, based on 0% licensed listings)
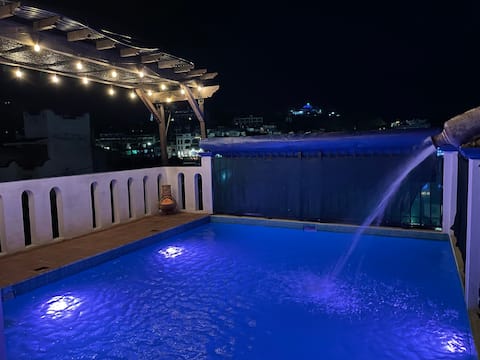
Top Performing Airbnb Properties in Taxco (2026)
Benchmark your potential! Explore examples of top-performing Airbnb properties in Taxcobased on Trailing Twelve Month (TTM) revenue. Analyze their characteristics, revenue, occupancy rate, and ADR to understand what drives success in this market.
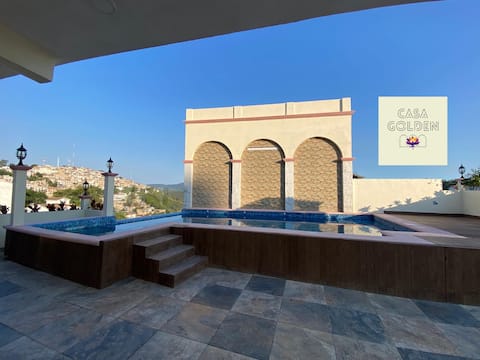
Golden House: residence for 12 people
Entire Place • 3 bedrooms
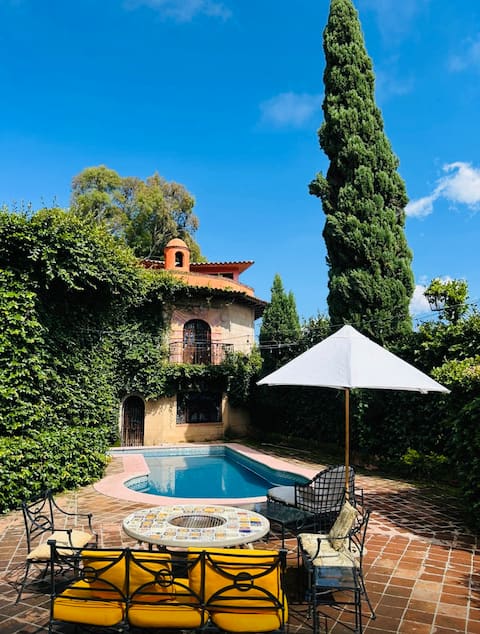
Garden of the Suns Californian-style residence
Entire Place • 7 bedrooms
Casa El Mirador Taxco | Jacuzzi and Terrace.
Entire Place • 3 bedrooms
Casa Galena
Entire Place • 4 bedrooms
House in the center of Taxco with a swimming pool.
Entire Place • 4 bedrooms

Rustic house, 3 bedrooms, with parking.
Entire Place • 3 bedrooms
Note: Performance varies based on location, size, amenities, seasonality, and management quality. Data reflects the past 12 months.
Top Performing Airbnb Hosts in Taxco (2026)
Learn from the best! This table showcases top-performing Airbnb hosts in Taxco based on the number of properties managed and estimated total revenue over the past year. Analyze their scale and performance metrics.
| Host Name | Properties | Grossing Revenue | Stay Reviews | Avg Rating |
|---|---|---|---|---|
| Ilse | 9 | $81,503 | 3012 | 4.89/5.0 |
| Javier | 5 | $53,575 | 94 | 4.94/5.0 |
| Céntrico | 16 | $41,859 | 636 | 4.72/5.0 |
| Hospedaje Taxco | 4 | $35,297 | 348 | 4.77/5.0 |
| Teresa | 3 | $34,364 | 491 | 4.94/5.0 |
| Ivett | 4 | $31,839 | 833 | 4.81/5.0 |
| Roberto | 15 | $29,621 | 1261 | 4.59/5.0 |
| Rebecca | 5 | $29,220 | 924 | 4.93/5.0 |
| HostPal | 2 | $26,693 | 103 | 4.58/5.0 |
| Mireya | 6 | $26,573 | 1161 | 4.93/5.0 |
Analyzing the strategies of top hosts, such as their property selection, pricing, and guest communication, can offer valuable lessons for optimizing your own Airbnb operations in Taxco.
Dive Deeper: Advanced Taxco STR Market Data (2026)
Ready to unlock more insights? AirROI provides access to advanced metrics and comprehensive Airbnb data for Taxco. Explore detailed analytics beyond this report to refine your investment strategy, optimize pricing, and maximize your vacation rental profits.
Explore Advanced MetricsTaxco Short-Term Rental Market Composition (2026): Property & Room Types
Room Type Distribution
Property Type Distribution
Market Composition Insights for Taxco
- The Taxco Airbnb market composition is heavily skewed towards Entire Home/Apt listings, which make up 53.6% of the 360 active rentals. This indicates strong guest preference for privacy and space.
- However, a notable 45.3% share for Private Rooms suggests opportunities for budget-conscious travelers or hosts renting out spare rooms.
- Looking at the property type distribution in Taxco, Apartment/Condo properties are the most common (38.9%), reflecting the local real estate landscape.
- Houses represent a significant 32.5% portion, catering likely to families or larger groups.
- The presence of 20.6% Hotel/Boutique listings indicates integration with traditional hospitality.
- Smaller segments like others, outdoor/unique (combined 8.0%) offer potential for unique stay experiences.
Taxco Airbnb Room Capacity Analysis (2026): Bedroom Distribution
Distribution of Listings by Number of Bedrooms
Room Capacity Insights for Taxco
- The dominant room capacity in Taxco is 1 bedroom listings, making up 43.9% of the market. This suggests a strong demand for properties suitable for couples or solo travelers.
- Together, 1 bedroom and 2 bedrooms properties represent 66.7% of the active Airbnb listings in Taxco, indicating a high concentration in these sizes.
Taxco Vacation Rental Guest Capacity Trends (2026)
Distribution of Listings by Guest Capacity
Guest Capacity Insights for Taxco
- The most common guest capacity trend in Taxco vacation rentals is listings accommodating 2 guests (25.6%). This suggests the primary traveler segment is likely couples or solo travelers.
- Properties designed for 2 guests and 4 guests dominate the Taxco STR market, accounting for 47.5% of listings.
- 20.5% of properties accommodate 6+ guests, serving the market segment for larger families or group travel in Taxco.
- On average, properties in Taxco are equipped to host 3.4 guests.
Taxco Airbnb Booking Patterns (2026): Available vs. Booked Days
Available Days Distribution
Booked Days Distribution
Booking Pattern Insights for Taxco
- The most common availability pattern in Taxco falls within the 271-366 days range, representing 76.9% of listings. This suggests many properties have significant open periods on their calendars.
- Approximately 98.6% of listings show high availability (181+ days open annually), indicating potential for increased bookings or specific owner usage patterns.
- For booked days, the 31-90 days range is most frequent in Taxco (39.2%), reflecting common guest stay durations or potential owner blocking patterns.
- A notable 1.9% of properties secure long booking periods (181+ days booked per year), highlighting successful long-term rental strategies or significant owner usage.
Taxco Airbnb Minimum Stay Requirements Analysis
Distribution of Listings by Minimum Night Requirement
1 Night
315 listings
87.5% of total
2 Nights
29 listings
8.1% of total
30+ Nights
16 listings
4.4% of total
Key Insights
- The most prevalent minimum stay requirement in Taxco is 1 Night, adopted by 87.5% of listings. This highlights the market's preference for shorter, flexible bookings.
- A strong majority (95.6%) of the Taxco Airbnb data shows acceptance of very short stays (1-2 nights), indicating a dynamic, high-turnover market.
Recommendations
- Align with the market by considering a 1 Night minimum stay, as 87.5% of Taxco hosts use this setting.
- Adjust minimum nights based on seasonality – potentially shorter during low season and longer during peak demand periods in Taxco.
Taxco Airbnb Cancellation Policy Trends Analysis (2026)
Limited
2 listings
0.6% of total
Flexible
186 listings
51.7% of total
Moderate
83 listings
23.1% of total
Firm
62 listings
17.2% of total
Strict
27 listings
7.5% of total
Cancellation Policy Insights for Taxco
- The prevailing Airbnb cancellation policy trend in Taxco is Flexible, used by 51.7% of listings.
- The market strongly favors guest-friendly terms, with 74.8% of listings offering Flexible or Moderate policies. This suggests guests in Taxco may expect booking flexibility.
- Strict cancellation policies are quite rare (7.5%), potentially making listings with this policy less competitive unless justified by high demand or property type.
Recommendations for Hosts
- Consider adopting a Flexible policy to align with the 51.7% market standard in Taxco.
- Given the high prevalence of Flexible policies (51.7%), offering this can enhance booking appeal, especially during shoulder seasons.
- Using a Strict policy might deter some guests, as only 7.5% of listings use it. Evaluate if potential revenue protection outweighs possible lower booking rates.
- Regularly review your cancellation policy against competitors and market demand shifts in Taxco.
Taxco STR Booking Lead Time Analysis (2026)
Average Booking Lead Time by Month
Booking Lead Time Insights for Taxco
- The overall average booking lead time for vacation rentals in Taxco is 20 days.
- Guests book furthest in advance for stays during April (average 30 days), likely coinciding with peak travel demand or local events.
- The shortest booking windows occur for stays in February (average 12 days), indicating more last-minute travel plans during this time.
- Seasonally, Fall (25 days avg.) sees the longest lead times, while Summer (17 days avg.) has the shortest, reflecting typical travel planning cycles.
Recommendations for Hosts
- Use the overall average lead time (20 days) as a baseline for your pricing and availability strategy in Taxco.
- During February, focus on last-minute booking availability and promotions, as guests book with very short notice (12 days avg.).
- Target marketing efforts for the Fall season well in advance (at least 25 days) to capture early planners.
- Monitor your own booking lead times against these Taxco averages to identify opportunities for dynamic pricing adjustments.
Popular & Essential Airbnb Amenities in Taxco (2026)
Amenity Prevalence
Amenity Insights for Taxco
- Essential amenities in Taxco that guests expect include: Wifi. Lacking these (this) could significantly impact bookings.
- Popular amenities like TV, Hot water, Essentials are common but not universal. Offering these can provide a competitive edge.
Recommendations for Hosts
- Ensure your listing includes all essential amenities for Taxco: Wifi.
- Prioritize adding missing essentials: Wifi.
- Consider adding popular differentiators like TV or Hot water to increase appeal.
- Highlight unique or less common amenities you offer (e.g., hot tub, dedicated workspace, EV charger) in your listing description and photos.
- Regularly check competitor amenities in Taxco to stay competitive.
Taxco Airbnb Guest Demographics & Profile Analysis (2026)
Guest Profile Summary for Taxco
- The typical guest profile for Airbnb in Taxco consists of primarily domestic travelers (77%), often arriving from nearby Mexico City, typically belonging to the Post-2000s (Gen Z/Alpha) group (50%), primarily speaking Spanish or English.
- Domestic travelers account for 76.7% of guests.
- Key international markets include Mexico (76.7%) and United States (9.9%).
- Top languages spoken are Spanish (51.7%) followed by English (35.2%).
- A significant demographic segment is the Post-2000s (Gen Z/Alpha) group, representing 50% of guests.
Recommendations for Hosts
- Target domestic marketing efforts towards travelers from Mexico City and Toluca.
- Tailor amenities and listing descriptions to appeal to the dominant Post-2000s (Gen Z/Alpha) demographic (e.g., highlight fast WiFi, smart home features, local guides).
- Highlight unique local experiences or amenities relevant to the primary guest profile.
- Consider seasonal promotions aligned with peak travel times for key origin markets.
Nearby Short-Term Rental Market Comparison
How does the Taxco Airbnb market stack up against its neighbors? Compare key performance metrics like average monthly revenue, ADR, and occupancy rates in surrounding areas to understand the broader regional STR landscape.
| Market | Active Properties | Monthly Revenue | Daily Rate | Avg. Occupancy |
|---|---|---|---|---|
| El Santuario | 44 | $2,583 | $420.27 | 25% |
| Cerro Gordo | 38 | $2,183 | $438.64 | 21% |
| Tepeji del Rio de Ocampo | 11 | $2,125 | $315.80 | 27% |
| Yautepec de Zaragoza | 16 | $2,032 | $269.32 | 26% |
| Xalmolonco | 24 | $1,944 | $281.85 | 28% |
| Avandaro | 212 | $1,892 | $411.24 | 24% |
| Guerrero | 28 | $1,795 | $223.86 | 29% |
| Rancho San Diego | 21 | $1,707 | $276.31 | 26% |
| Lomas de Cocoyoc | 137 | $1,662 | $258.05 | 28% |
| La Ladrillera | 28 | $1,655 | $277.53 | 26% |