Barra de Potosí Airbnb Market Analysis 2025: Short Term Rental Data & Vacation Rental Statistics in Guerrero, Mexico
Is Airbnb profitable in Barra de Potosí in 2025? Explore comprehensive Airbnb analytics for Barra de Potosí, Guerrero, Mexico to uncover income potential. This 2025 STR market report for Barra de Potosí, based on AirROI data from November 2024 to October 2025, reveals key trends in the niche market of 20 active listings.
Whether you're considering an Airbnb investment in Barra de Potosí, optimizing your existing vacation rental, or exploring rental arbitrage opportunities, understanding the Barra de Potosí Airbnb data is crucial. Leveraging the low regulation environment is key to maximizing your short term rental income potential. Let's dive into the specifics.
Key Barra de Potosí Airbnb Performance Metrics Overview
Monthly Airbnb Revenue Variations & Income Potential in Barra de Potosí (2025)
Understanding the monthly revenue variations for Airbnb listings in Barra de Potosí is key to maximizing your short term rental income potential. Seasonality significantly impacts earnings. Our analysis, based on data from the past 12 months, shows that the peak revenue month for STRs in Barra de Potosí is typically June, while October often presents the lowest earnings, highlighting opportunities for strategic pricing adjustments during shoulder and low seasons. Explore the typical Airbnb income in Barra de Potosí across different performance tiers:
- Best-in-class properties (Top 10%) achieve $6,011+ monthly, often utilizing dynamic pricing and superior guest experiences.
- Strong performing properties (Top 25%) earn $3,222 or more, indicating effective management and desirable locations/amenities.
- Typical properties (Median) generate around $561 per month, representing the average market performance.
- Entry-level properties (Bottom 25%) see earnings around $223, often with potential for optimization.
Average Monthly Airbnb Earnings Trend in Barra de Potosí
Barra de Potosí Airbnb Occupancy Rate Trends (2025)
Maximize your bookings by understanding the Barra de Potosí STR occupancy trends. Seasonal demand shifts significantly influence how often properties are booked. Typically, Februarysees the highest demand (peak season occupancy), while October experiences the lowest (low season). Effective strategies, like adjusting minimum stays or offering promotions, can boost occupancy during slower periods. Here's how different property tiers perform in Barra de Potosí:
- Best-in-class properties (Top 10%) achieve 60%+ occupancy, indicating high desirability and potentially optimized availability.
- Strong performing properties (Top 25%) maintain 42% or higher occupancy, suggesting good market fit and guest satisfaction.
- Typical properties (Median) have an occupancy rate around 16%.
- Entry-level properties (Bottom 25%) average 10% occupancy, potentially facing higher vacancy.
Average Monthly Occupancy Rate Trend in Barra de Potosí
Average Daily Rate (ADR) Airbnb Trends in Barra de Potosí (2025)
Effective short term rental pricing strategy in Barra de Potosí involves understanding monthly ADR fluctuations. The Average Daily Rate (ADR) for Airbnb in Barra de Potosí typically peaks in January and dips lowest during July. Leveraging Airbnb dynamic pricing tools or strategies based on this seasonality can significantly boost revenue. Here's a look at the typical nightly rates achieved:
- Best-in-class properties (Top 10%) command rates of $286+ per night, often due to premium features or locations.
- Strong performing properties (Top 25%) achieve nightly rates of $178 or more.
- Typical properties (Median) charge around $117 per night.
- Entry-level properties (Bottom 25%) earn around $86 per night.
Average Daily Rate (ADR) Trend by Month in Barra de Potosí
Get Live Barra de Potosí Market Intelligence 👇

Explore Real-time Analytics
Airbnb Seasonality Analysis & Trends in Barra de Potosí (2025)
Peak Season (June, August, July)
- Revenue averages $4,239 per month
- Occupancy rates average 26.4%
- Daily rates average $135
Shoulder Season
- Revenue averages $2,843 per month
- Occupancy maintains around 33.5%
- Daily rates hold near $157
Low Season (March, May, October)
- Revenue drops to average $1,147 per month
- Occupancy decreases to average 19.7%
- Daily rates adjust to average $149
Seasonality Insights for Barra de Potosí
- The Airbnb seasonality in Barra de Potosí shows highly seasonal trends requiring careful strategy. While the sections above show seasonal averages, it's also insightful to look at the extremes:
- During the high season, the absolute peak month showcases Barra de Potosí's highest earning potential, with monthly revenues capable of climbing to $4,708, occupancy reaching a high of 46.1%, and ADRs peaking at $168.
- Conversely, the slowest single month of the year, typically falling within the low season, marks the market's lowest point. In this month, revenue might dip to $470, occupancy could drop to 9.7%, and ADRs may adjust down to $133.
- Understanding both the seasonal averages and these monthly peaks and troughs in revenue, occupancy, and ADR is crucial for maximizing your Airbnb profit potential in Barra de Potosí.
Seasonal Strategies for Maximizing Profit
- Peak Season: Maximize revenue through premium pricing and potentially longer minimum stays. Ensure high availability.
- Low Season: Offer competitive pricing, special promotions (e.g., extended stay discounts), and flexible cancellation policies. Target off-season travelers like remote workers or budget-conscious guests.
- Shoulder Seasons: Implement dynamic pricing that balances peak and low rates. Target weekend travelers or specific events. Offer slightly more flexible terms than peak season.
- Regularly analyze your own performance against these Barra de Potosí seasonality benchmarks and adjust your pricing and availability strategy accordingly.
Best Areas for Airbnb Investment in Barra de Potosí (2025)
Exploring the top neighborhoods for short-term rentals in Barra de Potosí? This section highlights key areas, outlining why they are attractive for hosts and guests, along with notable local attractions. Consider these locations based on your target guest profile and investment strategy.
| Neighborhood / Area | Why Host Here? (Target Guests & Appeal) | Key Attractions & Landmarks |
|---|---|---|
| Playa Barra de Potosí | A serene beach destination known for its beautiful sands and picturesque views, ideal for tourists seeking relaxation and water activities. Perfect for families and couples wanting a getaway in nature. | Playa Barra de Potosí, Laguna de Potosí, Local seafood restaurants, Birdwatching spots, Water sports activities, Cultural tours |
| Town of Barra de Potosí | A charming local town that provides an authentic cultural experience of Guerrero. Hosts can attract travelers looking for local cuisine and community engagement. | Local markets, Traditional restaurants, Cultural events, Fishing boat excursions, Historic sites |
| Petacalco | A nearby beachfront area known for its waves, great for surfing enthusiasts. Attracts younger crowds and adventure seekers. | Surfing spots, Fishing sites, Beachfront bars, Community events, Nature trails |
| Ixtapa | A well-known tourist destination with luxury hotels and vibrant nightlife. Ideal for attracting international travelers. | Ixtapa Island, Marina Ixtapa, Golf courses, Nightclubs, Shopping centers |
| Zihuatanejo | Famous for its laid-back vibe and stunning beaches. Appeals to both families and solo travelers looking for a relaxed atmosphere. | Playa La Ropa, Historical town center, Artisan markets, Cultural festivals, Snorkeling and diving spots |
| La Saladita | A quiet beach known for its consistent surf conditions, attracting surfers and those looking for a calm vacation spot. | Surfing waves, Beachfront accommodations, Relaxation spots |
| Los Achotes | A rural area near the coast offering a unique agro-tourism experience. Hosts can offer visitors an opportunity to learn about local farming and traditions. | Organic farms, Local tours, Wildlife viewing, Cultural workshops |
| Paseo del Mar | A scenic waterfront area that provides access to both beach activities and the charm of local restaurants. Great for families and tourists seeking convenience. | Beaches, Promenade for walking and biking, Restaurants with local cuisine, Access to water sports |
Understanding Airbnb License Requirements & STR Laws in Barra de Potosí (2025)
While Barra de Potosí, Guerrero, Mexico currently shows low STR regulations, specific Airbnb license requirements might still exist or change. Always verify the latest short term rental regulations and Airbnb license requirements directly with local government authorities for Barra de Potosí to ensure full compliance before hosting.
(Source: AirROI data, 2025, finding no licensed listings among those analyzed)
Top Performing Airbnb Properties in Barra de Potosí (2025)
Benchmark your potential! Explore examples of top-performing Airbnb properties in Barra de Potosíbased on Trailing Twelve Month (TTM) revenue. Analyze their characteristics, revenue, occupancy rate, and ADR to understand what drives success in this market.

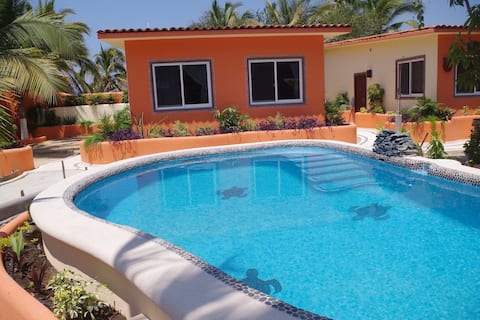
Tropical Villa, 2 swimming pools, by the beach
Entire Place • 7 bedrooms
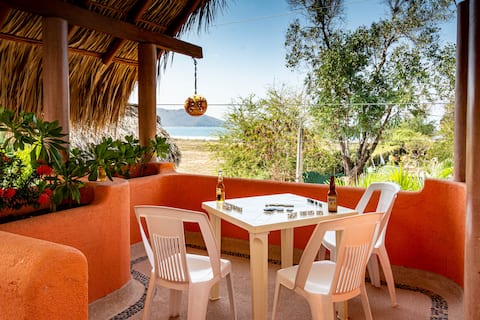
Casitas Bajo Las Estrellas-2, pool AC beach access
Entire Place • 1 bedroom
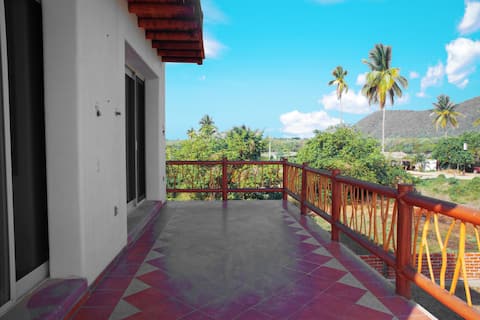
Casitas Bajo Las Estrellas-3, pool & beach access.
Entire Place • N/A

Casitas Bajo Las Estrellas-4, pool & beach access.
Entire Place • N/A
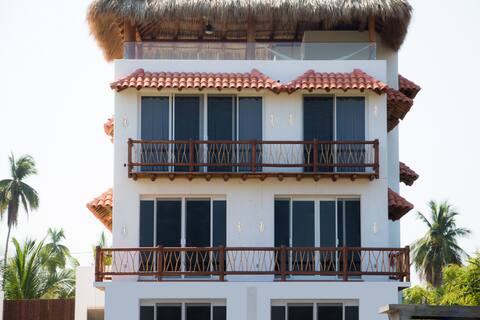
Beautiful Villa w/ 2 Homes! Shared Pool & roofdeck
Entire Place • 5 bedrooms
Huge Villa with Pool, Rooftop Deck, & Beach views
Entire Place • 3 bedrooms
Note: Performance varies based on location, size, amenities, seasonality, and management quality. Data reflects the past 12 months.
Top Performing Airbnb Hosts in Barra de Potosí (2025)
Learn from the best! This table showcases top-performing Airbnb hosts in Barra de Potosí based on the number of properties managed and estimated total revenue over the past year. Analyze their scale and performance metrics.
| Host Name | Properties | Grossing Revenue | Stay Reviews | Avg Rating |
|---|---|---|---|---|
| Stasya | 3 | $157,376 | 51 | 4.80/5.0 |
| Ken | 3 | $39,696 | 126 | 4.97/5.0 |
| Nofar | 4 | $9,824 | 24 | 4.31/5.0 |
| Lori | 3 | $8,216 | 76 | 4.66/5.0 |
| Ron | 1 | $7,736 | 9 | 4.44/5.0 |
| Patricia | 3 | $5,587 | 5 | Not Rated |
| Fernanda | 1 | $3,783 | 4 | 4.00/5.0 |
| Rosa | 1 | $2,430 | 1 | Not Rated |
| Gema Vianey | 1 | $1,274 | 3 | 5.00/5.0 |
Analyzing the strategies of top hosts, such as their property selection, pricing, and guest communication, can offer valuable lessons for optimizing your own Airbnb operations in Barra de Potosí.
Dive Deeper: Advanced Barra de Potosí STR Market Data (2025)
Ready to unlock more insights? AirROI provides access to advanced metrics and comprehensive Airbnb data for Barra de Potosí. Explore detailed analytics beyond this report to refine your investment strategy, optimize pricing, and maximize your vacation rental profits.
Explore Advanced MetricsBarra de Potosí Short-Term Rental Market Composition (2025): Property & Room Types
Room Type Distribution
Property Type Distribution
Market Composition Insights for Barra de Potosí
- The Barra de Potosí Airbnb market composition is heavily skewed towards Entire Home/Apt listings, which make up 55% of the 20 active rentals. This indicates strong guest preference for privacy and space.
- However, a notable 45% share for Private Rooms suggests opportunities for budget-conscious travelers or hosts renting out spare rooms.
- Looking at the property type distribution in Barra de Potosí, House properties are the most common (40%), reflecting the local real estate landscape.
- Houses represent a significant 40% portion, catering likely to families or larger groups.
- The presence of 35% Hotel/Boutique listings indicates integration with traditional hospitality.
Barra de Potosí Airbnb Room Capacity Analysis (2025): Bedroom Distribution
Distribution of Listings by Number of Bedrooms
Room Capacity Insights for Barra de Potosí
- The dominant room capacity in Barra de Potosí is 1 bedroom listings, making up 50% of the market. This suggests a strong demand for properties suitable for couples or solo travelers.
- Together, 1 bedroom and 3 bedrooms properties represent 65.0% of the active Airbnb listings in Barra de Potosí, indicating a high concentration in these sizes.
- A significant 25.0% of listings offer 3+ bedrooms, catering to larger groups and families seeking more space in Barra de Potosí.
Barra de Potosí Vacation Rental Guest Capacity Trends (2025)
Distribution of Listings by Guest Capacity
Guest Capacity Insights for Barra de Potosí
- The most common guest capacity trend in Barra de Potosí vacation rentals is listings accommodating 2 guests (45%). This suggests the primary traveler segment is likely couples or solo travelers.
- Properties designed for 2 guests and 6 guests dominate the Barra de Potosí STR market, accounting for 60.0% of listings.
- A significant 45.0% of listings cater specifically to 1-2 guests, highlighting strong demand from couples and solo travelers in Barra de Potosí.
- 25.0% of properties accommodate 6+ guests, serving the market segment for larger families or group travel in Barra de Potosí.
- On average, properties in Barra de Potosí are equipped to host 3.3 guests.
Barra de Potosí Airbnb Booking Patterns (2025): Available vs. Booked Days
Available Days Distribution
Booked Days Distribution
Booking Pattern Insights for Barra de Potosí
- The most common availability pattern in Barra de Potosí falls within the 271-366 days range, representing 85% of listings. This suggests many properties have significant open periods on their calendars.
- Approximately 95.0% of listings show high availability (181+ days open annually), indicating potential for increased bookings or specific owner usage patterns.
- For booked days, the 1-30 days range is most frequent in Barra de Potosí (50%), reflecting common guest stay durations or potential owner blocking patterns.
- A notable 5.0% of properties secure long booking periods (181+ days booked per year), highlighting successful long-term rental strategies or significant owner usage.
Barra de Potosí Airbnb Minimum Stay Requirements Analysis
Distribution of Listings by Minimum Night Requirement
1 Night
8 listings
40% of total
2 Nights
11 listings
55% of total
30+ Nights
1 listings
5% of total
Key Insights
- The most prevalent minimum stay requirement in Barra de Potosí is 2 Nights, adopted by 55% of listings. This highlights the market's preference for shorter, flexible bookings.
- A strong majority (95.0%) of the Barra de Potosí Airbnb data shows acceptance of very short stays (1-2 nights), indicating a dynamic, high-turnover market.
Recommendations
- Align with the market by considering a 2 Nights minimum stay, as 55% of Barra de Potosí hosts use this setting.
- Adjust minimum nights based on seasonality – potentially shorter during low season and longer during peak demand periods in Barra de Potosí.
Barra de Potosí Airbnb Cancellation Policy Trends Analysis (2025)
Flexible
6 listings
30% of total
Moderate
8 listings
40% of total
Firm
6 listings
30% of total
Cancellation Policy Insights for Barra de Potosí
- The prevailing Airbnb cancellation policy trend in Barra de Potosí is Moderate, used by 40% of listings.
- There's a relatively balanced mix between guest-friendly (70.0%) and stricter (30.0%) policies, offering choices for different guest needs.
Recommendations for Hosts
- Consider adopting a Moderate policy to align with the 40% market standard in Barra de Potosí.
- Regularly review your cancellation policy against competitors and market demand shifts in Barra de Potosí.
Barra de Potosí STR Booking Lead Time Analysis (2025)
Average Booking Lead Time by Month
Booking Lead Time Insights for Barra de Potosí
- The overall average booking lead time for vacation rentals in Barra de Potosí is 40 days.
- Guests book furthest in advance for stays during November (average 118 days), likely coinciding with peak travel demand or local events.
- The shortest booking windows occur for stays in September (average 13 days), indicating more last-minute travel plans during this time.
- Seasonally, Winter (74 days avg.) sees the longest lead times, while Spring (32 days avg.) has the shortest, reflecting typical travel planning cycles.
Recommendations for Hosts
- Use the overall average lead time (40 days) as a baseline for your pricing and availability strategy in Barra de Potosí.
- For November stays, consider implementing length-of-stay discounts or slightly higher rates for bookings made less than 118 days out to capitalize on advance planning.
- During September, focus on last-minute booking availability and promotions, as guests book with very short notice (13 days avg.).
- Target marketing efforts for the Winter season well in advance (at least 74 days) to capture early planners.
- Monitor your own booking lead times against these Barra de Potosí averages to identify opportunities for dynamic pricing adjustments.
Popular & Essential Airbnb Amenities in Barra de Potosí (2025)
Amenity Prevalence
Amenity Insights for Barra de Potosí
- Essential amenities in Barra de Potosí that guests expect include: Wifi, Kitchen. Lacking these (any) could significantly impact bookings.
- Popular amenities like Free parking on premises, Refrigerator, Dishes and silverware are common but not universal. Offering these can provide a competitive edge.
Recommendations for Hosts
- Ensure your listing includes all essential amenities for Barra de Potosí: Wifi, Kitchen.
- Prioritize adding missing essentials: Kitchen.
- Consider adding popular differentiators like Free parking on premises or Refrigerator to increase appeal.
- Highlight unique or less common amenities you offer (e.g., hot tub, dedicated workspace, EV charger) in your listing description and photos.
- Regularly check competitor amenities in Barra de Potosí to stay competitive.
Barra de Potosí Airbnb Guest Demographics & Profile Analysis (2025)
Guest Profile Summary for Barra de Potosí
- The typical guest profile for Airbnb in Barra de Potosí consists of a mix of domestic (48%) and international guests, with top international origins including United States, typically belonging to the Post-2000s (Gen Z/Alpha) group (50%), primarily speaking English or Spanish.
- Domestic travelers account for 47.5% of guests.
- Key international markets include Mexico (47.5%) and United States (27.5%).
- Top languages spoken are English (54.2%) followed by Spanish (33.3%).
- A significant demographic segment is the Post-2000s (Gen Z/Alpha) group, representing 50% of guests.
Recommendations for Hosts
- Balance marketing efforts between domestic and international channels based on the guest mix.
- Tailor amenities and listing descriptions to appeal to the dominant Post-2000s (Gen Z/Alpha) demographic (e.g., highlight fast WiFi, smart home features, local guides).
- Highlight unique local experiences or amenities relevant to the primary guest profile.
- Consider seasonal promotions aligned with peak travel times for key origin markets.
Nearby Short-Term Rental Market Comparison
How does the Barra de Potosí Airbnb market stack up against its neighbors? Compare key performance metrics like average monthly revenue, ADR, and occupancy rates in surrounding areas to understand the broader regional STR landscape.
| Market | Active Properties | Monthly Revenue | Daily Rate | Avg. Occupancy |
|---|---|---|---|---|
| Playa La Saladita | 29 | $2,454 | $229.70 | 44% |
| La Saladita | 18 | $2,210 | $199.63 | 39% |
| Colonia Aeropuerto | 95 | $2,088 | $302.20 | 29% |
| Troncones | 173 | $1,937 | $292.86 | 31% |
| Ixtapa | 322 | $1,814 | $285.03 | 33% |
| Guerrero | 34 | $1,692 | $220.04 | 28% |
| Playa Blanca | 16 | $1,538 | $260.00 | 28% |
| Zihuatanejo | 669 | $1,195 | $176.37 | 32% |
| Pie de la Cuesta | 69 | $1,182 | $189.82 | 25% |
| La Majahua | 13 | $1,132 | $199.08 | 28% |