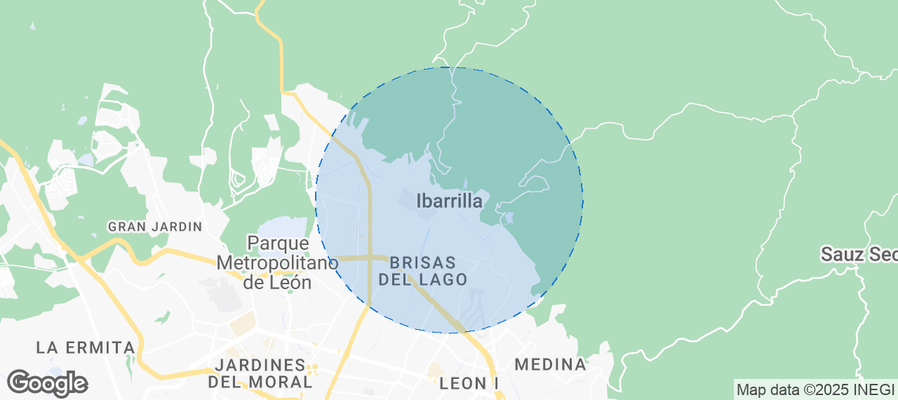
Ibarrilla Airbnb Market Analysis 2026: Short Term Rental Data & Vacation Rental Statistics in Guanajuato, Mexico
Is Airbnb profitable in Ibarrilla in 2026? Explore comprehensive Airbnb analytics for Ibarrilla, Guanajuato, Mexico to uncover income potential. This 2026 STR market report for Ibarrilla, based on AirROI data from February 2025 to January 2026, reveals key trends in the niche market of 20 active listings.
Whether you're considering an Airbnb investment in Ibarrilla, optimizing your existing vacation rental, or exploring rental arbitrage opportunities, understanding the Ibarrilla Airbnb data is crucial. Leveraging the low regulation environment is key to maximizing your short term rental income potential. Let's dive into the specifics.
Key Ibarrilla Airbnb Performance Metrics Overview
Monthly Airbnb Revenue Variations & Income Potential in Ibarrilla (2026)
Understanding the monthly revenue variations for Airbnb listings in Ibarrilla is key to maximizing your short term rental income potential. Seasonality significantly impacts earnings. Our analysis, based on data from the past 12 months, shows that the peak revenue month for STRs in Ibarrilla is typically July, while April often presents the lowest earnings, highlighting opportunities for strategic pricing adjustments during shoulder and low seasons. Explore the typical Airbnb income in Ibarrilla across different performance tiers:
- Best-in-class properties (Top 10%) achieve $1,698+ monthly, often utilizing dynamic pricing and superior guest experiences.
- Strong performing properties (Top 25%) earn $918 or more, indicating effective management and desirable locations/amenities.
- Typical properties (Median) generate around $474 per month, representing the average market performance.
- Entry-level properties (Bottom 25%) see earnings around $225, often with potential for optimization.
Average Monthly Airbnb Earnings Trend in Ibarrilla
Ibarrilla Airbnb Occupancy Rate Trends (2026)
Maximize your bookings by understanding the Ibarrilla STR occupancy trends. Seasonal demand shifts significantly influence how often properties are booked. Typically, Julysees the highest demand (peak season occupancy), while August experiences the lowest (low season). Effective strategies, like adjusting minimum stays or offering promotions, can boost occupancy during slower periods. Here's how different property tiers perform in Ibarrilla:
- Best-in-class properties (Top 10%) achieve 66%+ occupancy, indicating high desirability and potentially optimized availability.
- Strong performing properties (Top 25%) maintain 53% or higher occupancy, suggesting good market fit and guest satisfaction.
- Typical properties (Median) have an occupancy rate around 35%.
- Entry-level properties (Bottom 25%) average 16% occupancy, potentially facing higher vacancy.
Average Monthly Occupancy Rate Trend in Ibarrilla
Average Daily Rate (ADR) Airbnb Trends in Ibarrilla (2026)
Effective short term rental pricing strategy in Ibarrilla involves understanding monthly ADR fluctuations. The Average Daily Rate (ADR) for Airbnb in Ibarrilla typically peaks in November and dips lowest during April. Leveraging Airbnb dynamic pricing tools or strategies based on this seasonality can significantly boost revenue. Here's a look at the typical nightly rates achieved:
- Best-in-class properties (Top 10%) command rates of $98+ per night, often due to premium features or locations.
- Strong performing properties (Top 25%) achieve nightly rates of $57 or more.
- Typical properties (Median) charge around $44 per night.
- Entry-level properties (Bottom 25%) earn around $28 per night.
Average Daily Rate (ADR) Trend by Month in Ibarrilla
Get Live Ibarrilla Market Intelligence 👇
Explore Real-time Analytics
Airbnb Seasonality Analysis & Trends in Ibarrilla (2026)
Peak Season (July, October, November)
- Revenue averages $975 per month
- Occupancy rates average 41.6%
- Daily rates average $57
Shoulder Season
- Revenue averages $739 per month
- Occupancy maintains around 34.7%
- Daily rates hold near $55
Low Season (February, March, April)
- Revenue drops to average $474 per month
- Occupancy decreases to average 37.0%
- Daily rates adjust to average $49
Seasonality Insights for Ibarrilla
- The Airbnb seasonality in Ibarrilla shows highly seasonal trends requiring careful strategy. While the sections above show seasonal averages, it's also insightful to look at the extremes:
- During the high season, the absolute peak month showcases Ibarrilla's highest earning potential, with monthly revenues capable of climbing to $1,073, occupancy reaching a high of 52.9%, and ADRs peaking at $63.
- Conversely, the slowest single month of the year, typically falling within the low season, marks the market's lowest point. In this month, revenue might dip to $450, occupancy could drop to 31.0%, and ADRs may adjust down to $47.
- Understanding both the seasonal averages and these monthly peaks and troughs in revenue, occupancy, and ADR is crucial for maximizing your Airbnb profit potential in Ibarrilla.
Seasonal Strategies for Maximizing Profit
- Peak Season: Maximize revenue through premium pricing and potentially longer minimum stays. Ensure high availability.
- Low Season: Offer competitive pricing, special promotions (e.g., extended stay discounts), and flexible cancellation policies. Target off-season travelers like remote workers or budget-conscious guests.
- Shoulder Seasons: Implement dynamic pricing that balances peak and low rates. Target weekend travelers or specific events. Offer slightly more flexible terms than peak season.
- Regularly analyze your own performance against these Ibarrilla seasonality benchmarks and adjust your pricing and availability strategy accordingly.
Best Areas for Airbnb Investment in Ibarrilla (2026)
Exploring the top neighborhoods for short-term rentals in Ibarrilla? This section highlights key areas, outlining why they are attractive for hosts and guests, along with notable local attractions. Consider these locations based on your target guest profile and investment strategy.
| Neighborhood / Area | Why Host Here? (Target Guests & Appeal) | Key Attractions & Landmarks |
|---|---|---|
| Centro Histórico | The historic center of Ibarrilla, known for its local culture, traditional architecture, and vibrant streets. It attracts visitors interested in experiencing authentic Mexican heritage. | Plaza Principal, Templo de San Miguel Arcángel, local artisan shops, street food vendors, seasonal festivals |
| Natural Parks | Ibarrilla is close to several natural parks that offer beautiful landscapes and outdoor activities. This area attracts nature lovers and adventure seekers. | Sierra de Guanajuato, Cuenca de los Leones, hiking trails, wildlife watching, picnic spots |
| Art and Culture District | This neighborhood is known for its local artists and cultural events. Ideal for visitors looking for an immersive cultural experience and local art flair. | local art galleries, cultural festivals, craft workshops, traditional music events, art exhibitions |
| Wine Region | Nearby vineyards and wine-producing areas attract wine enthusiasts and those interested in the local gastronomy. This brings a unique tourism aspect to Ibarrilla. | local wineries, wine tastings, vineyard tours, food festivals, culinary experiences |
| Rural Retreats | Ibarrilla's surrounding countryside offers a peaceful escape for guests looking to relax away from the city. Ideal for wellness retreats and eco-friendly stays. | organic farms, wellness spas, nature walks, yoga retreats, tranquil landscapes |
| Adventure Sports Zone | This area is known for various adventure sports, attracting thrill-seekers and outdoor enthusiasts who are looking for exciting activities. | rock climbing, mountain biking, zip-lining, ATV tours, rafting opportunities |
| Local Cuisine Hub | A neighborhood known for its diverse food scene. Visitors come to Ibarrilla for its authentic culinary offerings, making it perfect for food-focused travelers. | traditional eateries, culinary tours, food markets, street food fairs, cooking classes |
| Family-Friendly Area | A part of Ibarrilla that offers amenities and activities suitable for families, making it an attractive destination for parents traveling with children. | parks and playgrounds, family-friendly restaurants, educational museums, family activities, community events |
Understanding Airbnb License Requirements & STR Laws in Ibarrilla (2026)
While Ibarrilla, Guanajuato, Mexico currently shows low STR regulations, specific Airbnb license requirements might still exist or change. Always verify the latest short term rental regulations and Airbnb license requirements directly with local government authorities for Ibarrilla to ensure full compliance before hosting.
(Source: AirROI data, 2026, finding no licensed listings among those analyzed)
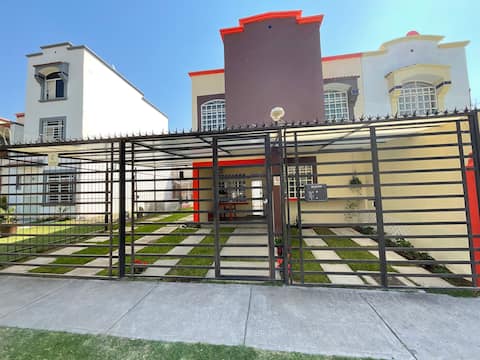
Top Performing Airbnb Properties in Ibarrilla (2026)
Benchmark your potential! Explore examples of top-performing Airbnb properties in Ibarrillabased on Trailing Twelve Month (TTM) revenue. Analyze their characteristics, revenue, occupancy rate, and ADR to understand what drives success in this market.

House with 5 bedrooms 4km from Fest. Globo and 2km zoological
Entire Place • 5 bedrooms

Residence in León in a Private Area
Entire Place • 3 bedrooms
Cozy 4-bedroom house with fire pit
Entire Place • 4 bedrooms

House near Plaza Mayor and downtown
Entire Place • 3 bedrooms

House near the Poliforum and Metropolitan Park
Entire Place • 3 bedrooms

Puma Lodge & Accommodation
Entire Place • 3 bedrooms
Note: Performance varies based on location, size, amenities, seasonality, and management quality. Data reflects the past 12 months.
Top Performing Airbnb Hosts in Ibarrilla (2026)
Learn from the best! This table showcases top-performing Airbnb hosts in Ibarrilla based on the number of properties managed and estimated total revenue over the past year. Analyze their scale and performance metrics.
| Host Name | Properties | Grossing Revenue | Stay Reviews | Avg Rating |
|---|---|---|---|---|
| Mari Mer | 2 | $34,236 | 125 | 4.96/5.0 |
| Salvador | 1 | $19,483 | 73 | 4.86/5.0 |
| Fernando | 1 | $14,312 | 96 | 4.79/5.0 |
| Rogelio | 1 | $12,901 | 160 | 4.78/5.0 |
| Nora Angelica | 2 | $12,433 | 122 | 4.92/5.0 |
| Andres | 1 | $9,693 | 144 | 4.80/5.0 |
| Hugo | 2 | $7,742 | 38 | 4.67/5.0 |
| Edgar | 1 | $6,789 | 26 | 4.88/5.0 |
| Rocio | 1 | $4,828 | 17 | 4.76/5.0 |
| Lucia | 3 | $4,033 | 34 | 5.00/5.0 |
Analyzing the strategies of top hosts, such as their property selection, pricing, and guest communication, can offer valuable lessons for optimizing your own Airbnb operations in Ibarrilla.
Dive Deeper: Advanced Ibarrilla STR Market Data (2026)
Ready to unlock more insights? AirROI provides access to advanced metrics and comprehensive Airbnb data for Ibarrilla. Explore detailed analytics beyond this report to refine your investment strategy, optimize pricing, and maximize your vacation rental profits.
Explore Advanced MetricsIbarrilla Short-Term Rental Market Composition (2026): Property & Room Types
Room Type Distribution
Property Type Distribution
Market Composition Insights for Ibarrilla
- The Ibarrilla Airbnb market composition is heavily skewed towards Entire Home/Apt listings, which make up 90% of the 20 active rentals. This indicates strong guest preference for privacy and space.
- Looking at the property type distribution in Ibarrilla, House properties are the most common (95%), reflecting the local real estate landscape.
- Houses represent a significant 95% portion, catering likely to families or larger groups.
Ibarrilla Airbnb Room Capacity Analysis (2026): Bedroom Distribution
Distribution of Listings by Number of Bedrooms
Room Capacity Insights for Ibarrilla
- The dominant room capacity in Ibarrilla is 3 bedrooms listings, making up 45% of the market. This suggests a strong demand for properties suitable for families or small groups.
- Together, 3 bedrooms and 2 bedrooms properties represent 65.0% of the active Airbnb listings in Ibarrilla, indicating a high concentration in these sizes.
- A significant 55.0% of listings offer 3+ bedrooms, catering to larger groups and families seeking more space in Ibarrilla.
Ibarrilla Vacation Rental Guest Capacity Trends (2026)
Distribution of Listings by Guest Capacity
Guest Capacity Insights for Ibarrilla
- The most common guest capacity trend in Ibarrilla vacation rentals is listings accommodating 4 guests (30%). This suggests the primary traveler segment is likely small families or groups.
- Properties designed for 4 guests and 8+ guests dominate the Ibarrilla STR market, accounting for 55.0% of listings.
- 50.0% of properties accommodate 6+ guests, serving the market segment for larger families or group travel in Ibarrilla.
- On average, properties in Ibarrilla are equipped to host 5.0 guests.
Ibarrilla Airbnb Booking Patterns (2026): Available vs. Booked Days
Available Days Distribution
Booked Days Distribution
Booking Pattern Insights for Ibarrilla
- The most common availability pattern in Ibarrilla falls within the 181-270 days range, representing 45% of listings. This suggests many properties have significant open periods on their calendars.
- Approximately 85.0% of listings show high availability (181+ days open annually), indicating potential for increased bookings or specific owner usage patterns.
- For booked days, the 91-180 days range is most frequent in Ibarrilla (40%), reflecting common guest stay durations or potential owner blocking patterns.
- A notable 20.0% of properties secure long booking periods (181+ days booked per year), highlighting successful long-term rental strategies or significant owner usage.
Ibarrilla Airbnb Minimum Stay Requirements Analysis
Distribution of Listings by Minimum Night Requirement
1 Night
10 listings
50% of total
2 Nights
7 listings
35% of total
30+ Nights
3 listings
15% of total
Key Insights
- The most prevalent minimum stay requirement in Ibarrilla is 1 Night, adopted by 50% of listings. This highlights the market's preference for shorter, flexible bookings.
- A strong majority (85.0%) of the Ibarrilla Airbnb data shows acceptance of very short stays (1-2 nights), indicating a dynamic, high-turnover market.
- A significant segment (15%) caters to monthly stays (30+ nights) in Ibarrilla, pointing to opportunities in the extended-stay market.
Recommendations
- Align with the market by considering a 1 Night minimum stay, as 50% of Ibarrilla hosts use this setting.
- Explore offering discounts for stays of 30+ nights to attract the 15% of the market seeking extended stays.
- Adjust minimum nights based on seasonality – potentially shorter during low season and longer during peak demand periods in Ibarrilla.
Ibarrilla Airbnb Cancellation Policy Trends Analysis (2026)
Flexible
5 listings
25% of total
Moderate
7 listings
35% of total
Firm
7 listings
35% of total
Strict
1 listings
5% of total
Cancellation Policy Insights for Ibarrilla
- The prevailing Airbnb cancellation policy trend in Ibarrilla is Moderate, used by 35% of listings.
- There's a relatively balanced mix between guest-friendly (60.0%) and stricter (40.0%) policies, offering choices for different guest needs.
- Strict cancellation policies are quite rare (5%), potentially making listings with this policy less competitive unless justified by high demand or property type.
Recommendations for Hosts
- Consider adopting a Moderate policy to align with the 35% market standard in Ibarrilla.
- Using a Strict policy might deter some guests, as only 5% of listings use it. Evaluate if potential revenue protection outweighs possible lower booking rates.
- Regularly review your cancellation policy against competitors and market demand shifts in Ibarrilla.
Ibarrilla STR Booking Lead Time Analysis (2026)
Average Booking Lead Time by Month
Booking Lead Time Insights for Ibarrilla
- The overall average booking lead time for vacation rentals in Ibarrilla is 22 days.
- Guests book furthest in advance for stays during July (average 44 days), likely coinciding with peak travel demand or local events.
- The shortest booking windows occur for stays in October (average 8 days), indicating more last-minute travel plans during this time.
- Seasonally, Summer (28 days avg.) sees the longest lead times, while Spring (12 days avg.) has the shortest, reflecting typical travel planning cycles.
Recommendations for Hosts
- Use the overall average lead time (22 days) as a baseline for your pricing and availability strategy in Ibarrilla.
- For July stays, consider implementing length-of-stay discounts or slightly higher rates for bookings made less than 44 days out to capitalize on advance planning.
- During October, focus on last-minute booking availability and promotions, as guests book with very short notice (8 days avg.).
- Target marketing efforts for the Summer season well in advance (at least 28 days) to capture early planners.
- Monitor your own booking lead times against these Ibarrilla averages to identify opportunities for dynamic pricing adjustments.
Popular & Essential Airbnb Amenities in Ibarrilla (2026)
Amenity Prevalence
Amenity Insights for Ibarrilla
- Essential amenities in Ibarrilla that guests expect include: Wifi, Hot water, TV. Lacking these (any) could significantly impact bookings.
- Popular amenities like Kitchen, Dishes and silverware, Clothing storage are common but not universal. Offering these can provide a competitive edge.
Recommendations for Hosts
- Ensure your listing includes all essential amenities for Ibarrilla: Wifi, Hot water, TV.
- Prioritize adding missing essentials: TV.
- Consider adding popular differentiators like Kitchen or Dishes and silverware to increase appeal.
- Highlight unique or less common amenities you offer (e.g., hot tub, dedicated workspace, EV charger) in your listing description and photos.
- Regularly check competitor amenities in Ibarrilla to stay competitive.
Ibarrilla Airbnb Guest Demographics & Profile Analysis (2026)
Guest Profile Summary for Ibarrilla
- The typical guest profile for Airbnb in Ibarrilla consists of primarily domestic travelers (93%), often arriving from nearby Monterrey, typically belonging to the Post-2000s (Gen Z/Alpha) group (50%), primarily speaking Spanish or English.
- Domestic travelers account for 93.4% of guests.
- Key international markets include Mexico (93.4%) and United States (5.7%).
- Top languages spoken are Spanish (57.8%) followed by English (32.5%).
- A significant demographic segment is the Post-2000s (Gen Z/Alpha) group, representing 50% of guests.
Recommendations for Hosts
- Target domestic marketing efforts towards travelers from Monterrey and Mexico City.
- Tailor amenities and listing descriptions to appeal to the dominant Post-2000s (Gen Z/Alpha) demographic (e.g., highlight fast WiFi, smart home features, local guides).
- Highlight unique local experiences or amenities relevant to the primary guest profile.
- Consider seasonal promotions aligned with peak travel times for key origin markets.
Nearby Short-Term Rental Market Comparison
How does the Ibarrilla Airbnb market stack up against its neighbors? Compare key performance metrics like average monthly revenue, ADR, and occupancy rates in surrounding areas to understand the broader regional STR landscape.
| Market | Active Properties | Monthly Revenue | Daily Rate | Avg. Occupancy |
|---|---|---|---|---|
| Alcocer | 11 | $1,642 | $271.32 | 21% |
| San Miguel de Allende | 2,169 | $1,470 | $194.10 | 32% |
| Lomas de Comanjilla | 21 | $1,382 | $183.03 | 27% |
| Cañajo | 40 | $1,005 | $144.20 | 28% |
| Fraccionamiento Zirándaro | 10 | $1,002 | $101.05 | 34% |
| San Miguel | 11 | $998 | $120.23 | 25% |
| Héroes de León | 13 | $830 | $327.68 | 36% |
| El Refugio | 40 | $770 | $70.47 | 39% |
| Zibatá | 131 | $706 | $77.71 | 37% |
| San Isidro El Viejo | 15 | $702 | $95.79 | 33% |