Los Lirios Airbnb Market Analysis 2026: Short Term Rental Data & Vacation Rental Statistics in Coahuila, Mexico
Is Airbnb profitable in Los Lirios in 2026? Explore comprehensive Airbnb analytics for Los Lirios, Coahuila, Mexico to uncover income potential. This 2026 STR market report for Los Lirios, based on AirROI data from February 2025 to January 2026, reveals key trends in the niche market of 27 active listings.
Whether you're considering an Airbnb investment in Los Lirios, optimizing your existing vacation rental, or exploring rental arbitrage opportunities, understanding the Los Lirios Airbnb data is crucial. Leveraging the low regulation environment is key to maximizing your short term rental income potential. Let's dive into the specifics.
Key Los Lirios Airbnb Performance Metrics Overview
Monthly Airbnb Revenue Variations & Income Potential in Los Lirios (2026)
Understanding the monthly revenue variations for Airbnb listings in Los Lirios is key to maximizing your short term rental income potential. Seasonality significantly impacts earnings. Our analysis, based on data from the past 12 months, shows that the peak revenue month for STRs in Los Lirios is typically December, while May often presents the lowest earnings, highlighting opportunities for strategic pricing adjustments during shoulder and low seasons. Explore the typical Airbnb income in Los Lirios across different performance tiers:
- Best-in-class properties (Top 10%) achieve $2,275+ monthly, often utilizing dynamic pricing and superior guest experiences.
- Strong performing properties (Top 25%) earn $1,471 or more, indicating effective management and desirable locations/amenities.
- Typical properties (Median) generate around $824 per month, representing the average market performance.
- Entry-level properties (Bottom 25%) see earnings around $420, often with potential for optimization.
Average Monthly Airbnb Earnings Trend in Los Lirios
Los Lirios Airbnb Occupancy Rate Trends (2026)
Maximize your bookings by understanding the Los Lirios STR occupancy trends. Seasonal demand shifts significantly influence how often properties are booked. Typically, Decembersees the highest demand (peak season occupancy), while May experiences the lowest (low season). Effective strategies, like adjusting minimum stays or offering promotions, can boost occupancy during slower periods. Here's how different property tiers perform in Los Lirios:
- Best-in-class properties (Top 10%) achieve 38%+ occupancy, indicating high desirability and potentially optimized availability.
- Strong performing properties (Top 25%) maintain 25% or higher occupancy, suggesting good market fit and guest satisfaction.
- Typical properties (Median) have an occupancy rate around 14%.
- Entry-level properties (Bottom 25%) average 7% occupancy, potentially facing higher vacancy.
Average Monthly Occupancy Rate Trend in Los Lirios
Average Daily Rate (ADR) Airbnb Trends in Los Lirios (2026)
Effective short term rental pricing strategy in Los Lirios involves understanding monthly ADR fluctuations. The Average Daily Rate (ADR) for Airbnb in Los Lirios typically peaks in December and dips lowest during February. Leveraging Airbnb dynamic pricing tools or strategies based on this seasonality can significantly boost revenue. Here's a look at the typical nightly rates achieved:
- Best-in-class properties (Top 10%) command rates of $291+ per night, often due to premium features or locations.
- Strong performing properties (Top 25%) achieve nightly rates of $247 or more.
- Typical properties (Median) charge around $184 per night.
- Entry-level properties (Bottom 25%) earn around $123 per night.
Average Daily Rate (ADR) Trend by Month in Los Lirios
Get Live Los Lirios Market Intelligence 👇

Explore Real-time Analytics
Airbnb Seasonality Analysis & Trends in Los Lirios (2026)
Peak Season (December, September, April)
- Revenue averages $1,476 per month
- Occupancy rates average 24.2%
- Daily rates average $204
Shoulder Season
- Revenue averages $1,023 per month
- Occupancy maintains around 16.7%
- Daily rates hold near $202
Low Season (May, June, July)
- Revenue drops to average $776 per month
- Occupancy decreases to average 13.5%
- Daily rates adjust to average $197
Seasonality Insights for Los Lirios
- The Airbnb seasonality in Los Lirios shows highly seasonal trends requiring careful strategy. While the sections above show seasonal averages, it's also insightful to look at the extremes:
- During the high season, the absolute peak month showcases Los Lirios's highest earning potential, with monthly revenues capable of climbing to $2,072, occupancy reaching a high of 26.9%, and ADRs peaking at $214.
- Conversely, the slowest single month of the year, typically falling within the low season, marks the market's lowest point. In this month, revenue might dip to $605, occupancy could drop to 11.9%, and ADRs may adjust down to $193.
- Understanding both the seasonal averages and these monthly peaks and troughs in revenue, occupancy, and ADR is crucial for maximizing your Airbnb profit potential in Los Lirios.
Seasonal Strategies for Maximizing Profit
- Peak Season: Maximize revenue through premium pricing and potentially longer minimum stays. Ensure high availability.
- Low Season: Offer competitive pricing, special promotions (e.g., extended stay discounts), and flexible cancellation policies. Target off-season travelers like remote workers or budget-conscious guests.
- Shoulder Seasons: Implement dynamic pricing that balances peak and low rates. Target weekend travelers or specific events. Offer slightly more flexible terms than peak season.
- Regularly analyze your own performance against these Los Lirios seasonality benchmarks and adjust your pricing and availability strategy accordingly.
Best Areas for Airbnb Investment in Los Lirios (2026)
Exploring the top neighborhoods for short-term rentals in Los Lirios? This section highlights key areas, outlining why they are attractive for hosts and guests, along with notable local attractions. Consider these locations based on your target guest profile and investment strategy.
| Neighborhood / Area | Why Host Here? (Target Guests & Appeal) | Key Attractions & Landmarks |
|---|---|---|
| Centro de Torreón | The bustling center of Torreón offers a mix of business and leisure attractions. It’s perfect for tourists looking for culture, dining, and easy access to transportation. | Catedral de Torreón, Museo Arocena, Plaza Mayor, Teatro Isauro Martínez, Casa del Campesino |
| Gómez Palacio | Close to Torreón, this area combines traditional culture with modern amenities and is great for families and tourists seeking local experiences. | Catedral de Gómez Palacio, Laguna de Mayrán, Museo del Ferrocarril, Parque Benito Juárez, Mercado de Gómez Palacio |
| Laguna Region | Known for its scenic landscapes and outdoor activities, this region attracts nature lovers and adventure seekers. | Cuatrociénegas, National Park of Las Maravillas, El Bosque de la Ciudad, Cañón de San Lorenzo, Cerro de la Silla |
| Plaza Periférico | A commercial hub with malls and entertainment options, ideal for visitors looking for shopping and dining. | Plaza Periférico, Cinemex, Liverpool, Starbucks, Chili's |
| Paseo de la Reforma | This avenue is lined with shops, restaurants, and parks, making it a vibrant area for both locals and tourists. | Parque Francés, Café del Centro, Librerías Gandhi, Teatro Nazas, Catedral Corona |
| San Pedro de las Colonias | A quieter area with a charming small-town feel, perfect for those seeking peace or visiting local attractions. | Parque Municipal, Santuario de Nuestra Señora de la Luz, Museo de San Pedro, Centro Cultural, Casa de la Cultura |
| Francisco I. Madero | An up-and-coming area popular with younger crowds, offering nightlife, restaurants, and cultural experiences. | Café El Puente, Teatro Centenario, Parque El Refugio, Museo de Arte, Restaurante El Pórtico |
| Torreón Airport Area | Convenient location for business travelers and tourists needing quick access to the airport. | Centro Internacional de Negocios, Parque Las Etapas, Restaurantes de comida rápida, Hotel Sede Torreón, Zona de Food Trucks |
Understanding Airbnb License Requirements & STR Laws in Los Lirios (2026)
While Los Lirios, Coahuila, Mexico currently shows low STR regulations, specific Airbnb license requirements might still exist or change. Always verify the latest short term rental regulations and Airbnb license requirements directly with local government authorities for Los Lirios to ensure full compliance before hosting.
(Source: AirROI data, 2026, finding no licensed listings among those analyzed)
Top Performing Airbnb Properties in Los Lirios (2026)
Benchmark your potential! Explore examples of top-performing Airbnb properties in Los Liriosbased on Trailing Twelve Month (TTM) revenue. Analyze their characteristics, revenue, occupancy rate, and ADR to understand what drives success in this market.

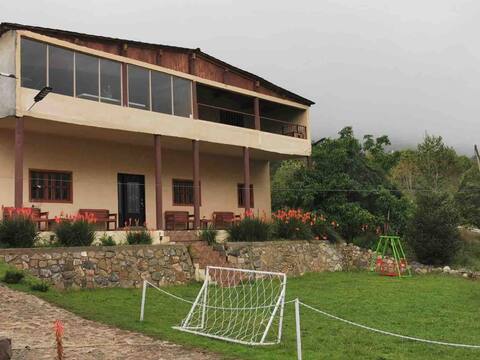
Cabin in Los Lirios, Arteaga
Entire Place • 3 bedrooms

Los Osos Cabin
Entire Place • 3 bedrooms

Casa la Escondida
Entire Place • 1 bedroom
El Gran Chaparral Los Lirios Cabin, Coahuila
Entire Place • 5 bedrooms
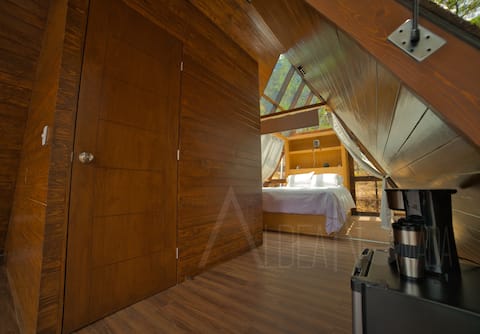
Andromeda Nomadic Village Glamping
Entire Place • 1 bedroom
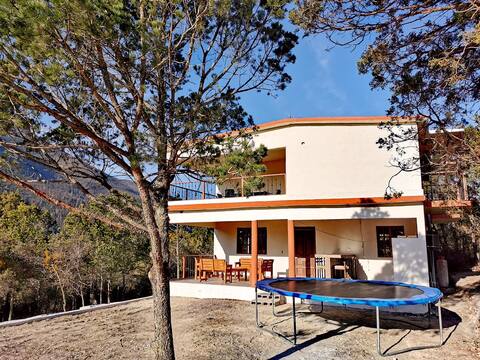
Cabin in Los Lirios, Coahuila
Entire Place • 2 bedrooms
Note: Performance varies based on location, size, amenities, seasonality, and management quality. Data reflects the past 12 months.
Top Performing Airbnb Hosts in Los Lirios (2026)
Learn from the best! This table showcases top-performing Airbnb hosts in Los Lirios based on the number of properties managed and estimated total revenue over the past year. Analyze their scale and performance metrics.
| Host Name | Properties | Grossing Revenue | Stay Reviews | Avg Rating |
|---|---|---|---|---|
| Darwin | 2 | $34,176 | 83 | 5.00/5.0 |
| Armando | 2 | $31,917 | 22 | 4.76/5.0 |
| Rafael | 2 | $31,788 | 2 | Not Rated |
| Melissa | 4 | $27,439 | 194 | 4.78/5.0 |
| Lety | 5 | $23,056 | 254 | 4.72/5.0 |
| Carlos | 1 | $19,791 | 123 | 4.71/5.0 |
| Hugo | 1 | $18,599 | 22 | 4.95/5.0 |
| Abel | 4 | $12,741 | 29 | 4.60/5.0 |
| Cesar Alberto | 1 | $11,265 | 117 | 4.70/5.0 |
| Madia Gisselle | 1 | $10,732 | 2 | Not Rated |
Analyzing the strategies of top hosts, such as their property selection, pricing, and guest communication, can offer valuable lessons for optimizing your own Airbnb operations in Los Lirios.
Dive Deeper: Advanced Los Lirios STR Market Data (2026)
Ready to unlock more insights? AirROI provides access to advanced metrics and comprehensive Airbnb data for Los Lirios. Explore detailed analytics beyond this report to refine your investment strategy, optimize pricing, and maximize your vacation rental profits.
Explore Advanced MetricsLos Lirios Short-Term Rental Market Composition (2026): Property & Room Types
Room Type Distribution
Property Type Distribution
Market Composition Insights for Los Lirios
- The Los Lirios Airbnb market composition is heavily skewed towards Entire Home/Apt listings, which make up 88.9% of the 27 active rentals. This indicates strong guest preference for privacy and space.
- Looking at the property type distribution in Los Lirios, Outdoor/Unique properties are the most common (88.9%), reflecting the local real estate landscape.
- Smaller segments like house (combined 3.7%) offer potential for unique stay experiences.
Los Lirios Airbnb Room Capacity Analysis (2026): Bedroom Distribution
Distribution of Listings by Number of Bedrooms
Room Capacity Insights for Los Lirios
- The dominant room capacity in Los Lirios is 1 bedroom listings, making up 44.4% of the market. This suggests a strong demand for properties suitable for couples or solo travelers.
- Together, 1 bedroom and 3 bedrooms properties represent 66.6% of the active Airbnb listings in Los Lirios, indicating a high concentration in these sizes.
- A significant 33.3% of listings offer 3+ bedrooms, catering to larger groups and families seeking more space in Los Lirios.
Los Lirios Vacation Rental Guest Capacity Trends (2026)
Distribution of Listings by Guest Capacity
Guest Capacity Insights for Los Lirios
- The most common guest capacity trend in Los Lirios vacation rentals is listings accommodating 8+ guests (40.7%). This suggests the primary traveler segment is likely larger groups.
- Properties designed for 8+ guests and 6 guests dominate the Los Lirios STR market, accounting for 66.6% of listings.
- 66.6% of properties accommodate 6+ guests, serving the market segment for larger families or group travel in Los Lirios.
- On average, properties in Los Lirios are equipped to host 5.6 guests.
Los Lirios Airbnb Booking Patterns (2026): Available vs. Booked Days
Available Days Distribution
Booked Days Distribution
Booking Pattern Insights for Los Lirios
- The most common availability pattern in Los Lirios falls within the 271-366 days range, representing 92.6% of listings. This suggests many properties have significant open periods on their calendars.
- Approximately 100.0% of listings show high availability (181+ days open annually), indicating potential for increased bookings or specific owner usage patterns.
- For booked days, the 1-30 days range is most frequent in Los Lirios (44.4%), reflecting common guest stay durations or potential owner blocking patterns.
Los Lirios Airbnb Minimum Stay Requirements Analysis
Distribution of Listings by Minimum Night Requirement
1 Night
26 listings
96.3% of total
30+ Nights
1 listings
3.7% of total
Key Insights
- The most prevalent minimum stay requirement in Los Lirios is 1 Night, adopted by 96.3% of listings. This highlights the market's preference for shorter, flexible bookings.
- A strong majority (96.3%) of the Los Lirios Airbnb data shows acceptance of very short stays (1-2 nights), indicating a dynamic, high-turnover market.
Recommendations
- Align with the market by considering a 1 Night minimum stay, as 96.3% of Los Lirios hosts use this setting.
- Adjust minimum nights based on seasonality – potentially shorter during low season and longer during peak demand periods in Los Lirios.
Los Lirios Airbnb Cancellation Policy Trends Analysis (2026)
Super Strict 30 Days
2 listings
7.4% of total
Flexible
2 listings
7.4% of total
Moderate
10 listings
37% of total
Firm
13 listings
48.1% of total
Cancellation Policy Insights for Los Lirios
- The prevailing Airbnb cancellation policy trend in Los Lirios is Firm, used by 48.1% of listings.
- There's a relatively balanced mix between guest-friendly (44.4%) and stricter (48.1%) policies, offering choices for different guest needs.
Recommendations for Hosts
- Consider adopting a Firm policy to align with the 48.1% market standard in Los Lirios.
- Regularly review your cancellation policy against competitors and market demand shifts in Los Lirios.
Los Lirios STR Booking Lead Time Analysis (2026)
Average Booking Lead Time by Month
Booking Lead Time Insights for Los Lirios
- The overall average booking lead time for vacation rentals in Los Lirios is 27 days.
- Guests book furthest in advance for stays during November (average 50 days), likely coinciding with peak travel demand or local events.
- The shortest booking windows occur for stays in June (average 9 days), indicating more last-minute travel plans during this time.
- Seasonally, Fall (37 days avg.) sees the longest lead times, while Summer (16 days avg.) has the shortest, reflecting typical travel planning cycles.
Recommendations for Hosts
- Use the overall average lead time (27 days) as a baseline for your pricing and availability strategy in Los Lirios.
- For November stays, consider implementing length-of-stay discounts or slightly higher rates for bookings made less than 50 days out to capitalize on advance planning.
- During June, focus on last-minute booking availability and promotions, as guests book with very short notice (9 days avg.).
- Target marketing efforts for the Fall season well in advance (at least 37 days) to capture early planners.
- Monitor your own booking lead times against these Los Lirios averages to identify opportunities for dynamic pricing adjustments.
Popular & Essential Airbnb Amenities in Los Lirios (2026)
Amenity Prevalence
Amenity Insights for Los Lirios
- Essential amenities in Los Lirios that guests expect include: BBQ grill, Free parking on premises. Lacking these (any) could significantly impact bookings.
- Popular amenities like Fire extinguisher, Kitchen, Hot water are common but not universal. Offering these can provide a competitive edge.
Recommendations for Hosts
- Ensure your listing includes all essential amenities for Los Lirios: BBQ grill, Free parking on premises.
- Consider adding popular differentiators like Fire extinguisher or Kitchen to increase appeal.
- Highlight unique or less common amenities you offer (e.g., hot tub, dedicated workspace, EV charger) in your listing description and photos.
- Regularly check competitor amenities in Los Lirios to stay competitive.
Los Lirios Airbnb Guest Demographics & Profile Analysis (2026)
Guest Profile Summary for Los Lirios
- The typical guest profile for Airbnb in Los Lirios consists of primarily domestic travelers (96%), often arriving from nearby Monterrey, typically belonging to the Post-2000s (Gen Z/Alpha) group (50%), primarily speaking Spanish or English.
- Domestic travelers account for 95.7% of guests.
- Key international markets include Mexico (95.7%) and United States (1.1%).
- Top languages spoken are Spanish (53.2%) followed by English (39.2%).
- A significant demographic segment is the Post-2000s (Gen Z/Alpha) group, representing 50% of guests.
Recommendations for Hosts
- Target domestic marketing efforts towards travelers from Monterrey and Saltillo.
- Tailor amenities and listing descriptions to appeal to the dominant Post-2000s (Gen Z/Alpha) demographic (e.g., highlight fast WiFi, smart home features, local guides).
- Highlight unique local experiences or amenities relevant to the primary guest profile.
- Consider seasonal promotions aligned with peak travel times for key origin markets.
Nearby Short-Term Rental Market Comparison
How does the Los Lirios Airbnb market stack up against its neighbors? Compare key performance metrics like average monthly revenue, ADR, and occupancy rates in surrounding areas to understand the broader regional STR landscape.
| Market | Active Properties | Monthly Revenue | Daily Rate | Avg. Occupancy |
|---|---|---|---|---|
| Bella Unión | 10 | $4,181 | $286.89 | 37% |
| El Cercado | 14 | $1,947 | $212.87 | 32% |
| Jame | 10 | $1,486 | $169.30 | 27% |
| General Zuazua | 20 | $1,472 | $277.59 | 26% |
| Mesa de tablas | 43 | $1,457 | $302.25 | 18% |
| Barrio de Huajuquito | 11 | $1,453 | $236.72 | 26% |
| Arteaga | 86 | $1,323 | $213.56 | 24% |
| San Antonio de Las Alazanas | 37 | $1,165 | $285.00 | 18% |
| Allende | 17 | $1,151 | $150.10 | 30% |
| Montemorelos | 21 | $1,148 | $183.07 | 26% |