El Diamante Airbnb Market Analysis 2026: Short Term Rental Data & Vacation Rental Statistics in Coahuila de Zaragoza, Mexico
Is Airbnb profitable in El Diamante in 2026? Explore comprehensive Airbnb analytics for El Diamante, Coahuila de Zaragoza, Mexico to uncover income potential. This 2026 STR market report for El Diamante, based on AirROI data from February 2025 to January 2026, reveals key trends in the niche market of 19 active listings.
Whether you're considering an Airbnb investment in El Diamante, optimizing your existing vacation rental, or exploring rental arbitrage opportunities, understanding the El Diamante Airbnb data is crucial. Leveraging the low regulation environment is key to maximizing your short term rental income potential. Let's dive into the specifics.
Key El Diamante Airbnb Performance Metrics Overview
Monthly Airbnb Revenue Variations & Income Potential in El Diamante (2026)
Understanding the monthly revenue variations for Airbnb listings in El Diamante is key to maximizing your short term rental income potential. Seasonality significantly impacts earnings. Our analysis, based on data from the past 12 months, shows that the peak revenue month for STRs in El Diamante is typically November, while May often presents the lowest earnings, highlighting opportunities for strategic pricing adjustments during shoulder and low seasons. Explore the typical Airbnb income in El Diamante across different performance tiers:
- Best-in-class properties (Top 10%) achieve $3,412+ monthly, often utilizing dynamic pricing and superior guest experiences.
- Strong performing properties (Top 25%) earn $2,143 or more, indicating effective management and desirable locations/amenities.
- Typical properties (Median) generate around $951 per month, representing the average market performance.
- Entry-level properties (Bottom 25%) see earnings around $375, often with potential for optimization.
Average Monthly Airbnb Earnings Trend in El Diamante
El Diamante Airbnb Occupancy Rate Trends (2026)
Maximize your bookings by understanding the El Diamante STR occupancy trends. Seasonal demand shifts significantly influence how often properties are booked. Typically, Novembersees the highest demand (peak season occupancy), while June experiences the lowest (low season). Effective strategies, like adjusting minimum stays or offering promotions, can boost occupancy during slower periods. Here's how different property tiers perform in El Diamante:
- Best-in-class properties (Top 10%) achieve 51%+ occupancy, indicating high desirability and potentially optimized availability.
- Strong performing properties (Top 25%) maintain 35% or higher occupancy, suggesting good market fit and guest satisfaction.
- Typical properties (Median) have an occupancy rate around 23%.
- Entry-level properties (Bottom 25%) average 9% occupancy, potentially facing higher vacancy.
Average Monthly Occupancy Rate Trend in El Diamante
Average Daily Rate (ADR) Airbnb Trends in El Diamante (2026)
Effective short term rental pricing strategy in El Diamante involves understanding monthly ADR fluctuations. The Average Daily Rate (ADR) for Airbnb in El Diamante typically peaks in December and dips lowest during March. Leveraging Airbnb dynamic pricing tools or strategies based on this seasonality can significantly boost revenue. Here's a look at the typical nightly rates achieved:
- Best-in-class properties (Top 10%) command rates of $287+ per night, often due to premium features or locations.
- Strong performing properties (Top 25%) achieve nightly rates of $199 or more.
- Typical properties (Median) charge around $148 per night.
- Entry-level properties (Bottom 25%) earn around $106 per night.
Average Daily Rate (ADR) Trend by Month in El Diamante
Get Live El Diamante Market Intelligence 👇

Explore Real-time Analytics
Airbnb Seasonality Analysis & Trends in El Diamante (2026)
Peak Season (November, December, January)
- Revenue averages $2,205 per month
- Occupancy rates average 36.3%
- Daily rates average $190
Shoulder Season
- Revenue averages $1,433 per month
- Occupancy maintains around 24.8%
- Daily rates hold near $177
Low Season (February, May, June)
- Revenue drops to average $958 per month
- Occupancy decreases to average 19.2%
- Daily rates adjust to average $174
Seasonality Insights for El Diamante
- The Airbnb seasonality in El Diamante shows highly seasonal trends requiring careful strategy. While the sections above show seasonal averages, it's also insightful to look at the extremes:
- During the high season, the absolute peak month showcases El Diamante's highest earning potential, with monthly revenues capable of climbing to $2,486, occupancy reaching a high of 41.1%, and ADRs peaking at $195.
- Conversely, the slowest single month of the year, typically falling within the low season, marks the market's lowest point. In this month, revenue might dip to $899, occupancy could drop to 15.2%, and ADRs may adjust down to $170.
- Understanding both the seasonal averages and these monthly peaks and troughs in revenue, occupancy, and ADR is crucial for maximizing your Airbnb profit potential in El Diamante.
Seasonal Strategies for Maximizing Profit
- Peak Season: Maximize revenue through premium pricing and potentially longer minimum stays. Ensure high availability.
- Low Season: Offer competitive pricing, special promotions (e.g., extended stay discounts), and flexible cancellation policies. Target off-season travelers like remote workers or budget-conscious guests.
- Shoulder Seasons: Implement dynamic pricing that balances peak and low rates. Target weekend travelers or specific events. Offer slightly more flexible terms than peak season.
- Regularly analyze your own performance against these El Diamante seasonality benchmarks and adjust your pricing and availability strategy accordingly.
Best Areas for Airbnb Investment in El Diamante (2026)
Exploring the top neighborhoods for short-term rentals in El Diamante? This section highlights key areas, outlining why they are attractive for hosts and guests, along with notable local attractions. Consider these locations based on your target guest profile and investment strategy.
| Neighborhood / Area | Why Host Here? (Target Guests & Appeal) | Key Attractions & Landmarks |
|---|---|---|
| Centro Histórico | The historic center of El Diamante offers cultural attractions and local markets, making it a great spot for travelers interested in history and local culture. | Museo de la Revolución, Plaza Principal, Iglesia de San Diego, Mercado Municipal |
| Parque de la Civdad | A spacious park with recreational facilities, making it ideal for families and tourists looking to enjoy outdoor activities and events. | Lakes, Walking Trails, Playgrounds, Cultural Events |
| Las Misiones | A residential area known for its tranquility and proximity to amenities, appealing to those looking for longer stays and a neighborhood feel. | Local Grocery Stores, Restaurants, Gyms, Parks |
| El Mirador | A viewpoint area that offers stunning views of the surrounding landscape, attracting nature lovers and outdoor enthusiasts. | Hiking Trails, Scenic Lookouts, Photography Spots |
| Cerro del Diablo | Known for its natural beauty and outdoor activities, it attracts adventure seekers looking for hiking and exploration. | Hiking Trails, Camping Sites, Picnic Areas |
| La Plazuela | A lively neighborhood with cafes and artisan shops; perfect for visitors wanting a taste of local life and artisanal products. | Artisan Shops, Local Cafes, Craft Markets |
| Jardines de El Diamante | A residential area characterized by its gardens and green spaces, appealing for visitors who appreciate nature and a relaxing atmosphere. | Community Parks, Botanical Gardens, Outdoor Fitness Areas |
| Venustiano Carranza | A vibrant area with restaurants and nightlife, ideal for younger travelers seeking entertainment and a lively atmosphere. | Bars and Clubs, Restaurants, Cultural Events |
Understanding Airbnb License Requirements & STR Laws in El Diamante (2026)
While El Diamante, Coahuila de Zaragoza, Mexico currently shows low STR regulations, specific Airbnb license requirements might still exist or change. Always verify the latest short term rental regulations and Airbnb license requirements directly with local government authorities for El Diamante to ensure full compliance before hosting.
(Source: AirROI data, 2026, finding no licensed listings among those analyzed)
Top Performing Airbnb Properties in El Diamante (2026)
Benchmark your potential! Explore examples of top-performing Airbnb properties in El Diamantebased on Trailing Twelve Month (TTM) revenue. Analyze their characteristics, revenue, occupancy rate, and ADR to understand what drives success in this market.
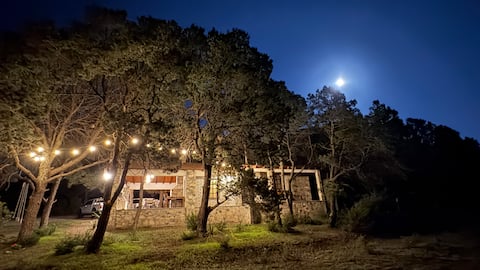
Private Cabin in Nature
Entire Place • 3 bedrooms
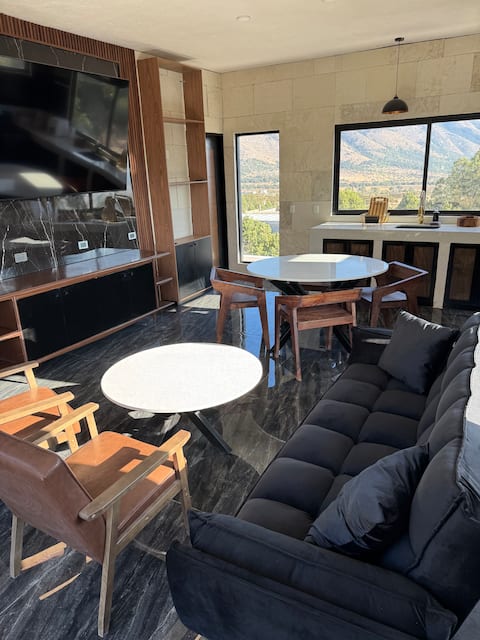
Beautiful house in Arteaga
Entire Place • 2 bedrooms
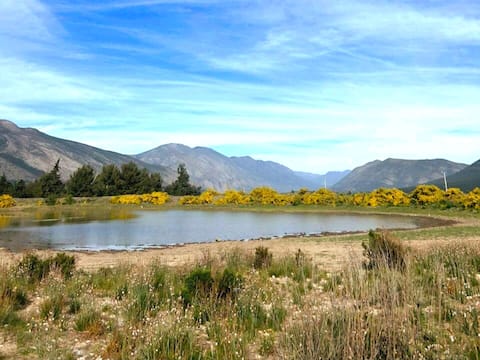
Landscapes, Luxury and Peace
Entire Place • 3 bedrooms
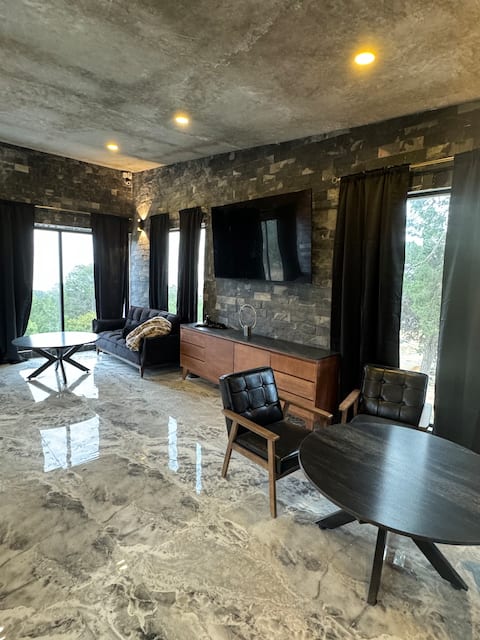
Beautiful cabins in Arteaga
Entire Place • 1 bedroom
Cozy cabin with a view of the mountains
Entire Place • 2 bedrooms

Magic cabin hidden in the woods
Entire Place • 1 bedroom
Note: Performance varies based on location, size, amenities, seasonality, and management quality. Data reflects the past 12 months.
Top Performing Airbnb Hosts in El Diamante (2026)
Learn from the best! This table showcases top-performing Airbnb hosts in El Diamante based on the number of properties managed and estimated total revenue over the past year. Analyze their scale and performance metrics.
| Host Name | Properties | Grossing Revenue | Stay Reviews | Avg Rating |
|---|---|---|---|---|
| Eugenio Carlos | 2 | $66,629 | 52 | 4.76/5.0 |
| Fernando | 1 | $41,373 | 35 | 4.77/5.0 |
| Ramsés Salomón | 1 | $37,118 | 95 | 4.71/5.0 |
| Christopher Alberto | 2 | $19,449 | 50 | 4.99/5.0 |
| Francisco | 1 | $17,956 | 43 | 4.88/5.0 |
| Juanibex | 1 | $14,083 | 47 | 5.00/5.0 |
| Francisco | 3 | $13,329 | 28 | 5.00/5.0 |
| Néstor Garanzuay E | 2 | $9,867 | 47 | 4.76/5.0 |
| Laura | 2 | $5,174 | 117 | 4.80/5.0 |
| Mauricio | 3 | $4,242 | 112 | 4.92/5.0 |
Analyzing the strategies of top hosts, such as their property selection, pricing, and guest communication, can offer valuable lessons for optimizing your own Airbnb operations in El Diamante.
Dive Deeper: Advanced El Diamante STR Market Data (2026)
Ready to unlock more insights? AirROI provides access to advanced metrics and comprehensive Airbnb data for El Diamante. Explore detailed analytics beyond this report to refine your investment strategy, optimize pricing, and maximize your vacation rental profits.
Explore Advanced MetricsEl Diamante Short-Term Rental Market Composition (2026): Property & Room Types
Room Type Distribution
Property Type Distribution
Market Composition Insights for El Diamante
- The El Diamante Airbnb market composition is heavily skewed towards Entire Home/Apt listings, which make up 100% of the 19 active rentals. This indicates strong guest preference for privacy and space.
- Looking at the property type distribution in El Diamante, Outdoor/Unique properties are the most common (84.2%), reflecting the local real estate landscape.
- Houses represent a significant 15.8% portion, catering likely to families or larger groups.
El Diamante Airbnb Room Capacity Analysis (2026): Bedroom Distribution
Distribution of Listings by Number of Bedrooms
Room Capacity Insights for El Diamante
- The dominant room capacity in El Diamante is 1 bedroom listings, making up 63.2% of the market. This suggests a strong demand for properties suitable for couples or solo travelers.
- Together, 1 bedroom and 3 bedrooms properties represent 84.3% of the active Airbnb listings in El Diamante, indicating a high concentration in these sizes.
- With over half the market (63.2%) consisting of studios or 1-bedroom units, El Diamante is particularly well-suited for individuals or couples.
- A significant 26.4% of listings offer 3+ bedrooms, catering to larger groups and families seeking more space in El Diamante.
El Diamante Vacation Rental Guest Capacity Trends (2026)
Distribution of Listings by Guest Capacity
Guest Capacity Insights for El Diamante
- The most common guest capacity trend in El Diamante vacation rentals is listings accommodating 2 guests (42.1%). This suggests the primary traveler segment is likely couples or solo travelers.
- Properties designed for 2 guests and 8+ guests dominate the El Diamante STR market, accounting for 73.7% of listings.
- A significant 42.1% of listings cater specifically to 1-2 guests, highlighting strong demand from couples and solo travelers in El Diamante.
- 42.1% of properties accommodate 6+ guests, serving the market segment for larger families or group travel in El Diamante.
- On average, properties in El Diamante are equipped to host 4.6 guests.
El Diamante Airbnb Booking Patterns (2026): Available vs. Booked Days
Available Days Distribution
Booked Days Distribution
Booking Pattern Insights for El Diamante
- The most common availability pattern in El Diamante falls within the 271-366 days range, representing 68.4% of listings. This suggests many properties have significant open periods on their calendars.
- Approximately 94.7% of listings show high availability (181+ days open annually), indicating potential for increased bookings or specific owner usage patterns.
- For booked days, the 1-30 days range is most frequent in El Diamante (47.4%), reflecting common guest stay durations or potential owner blocking patterns.
- A notable 5.3% of properties secure long booking periods (181+ days booked per year), highlighting successful long-term rental strategies or significant owner usage.
El Diamante Airbnb Minimum Stay Requirements Analysis
Distribution of Listings by Minimum Night Requirement
1 Night
18 listings
94.7% of total
30+ Nights
1 listings
5.3% of total
Key Insights
- The most prevalent minimum stay requirement in El Diamante is 1 Night, adopted by 94.7% of listings. This highlights the market's preference for shorter, flexible bookings.
- A strong majority (94.7%) of the El Diamante Airbnb data shows acceptance of very short stays (1-2 nights), indicating a dynamic, high-turnover market.
Recommendations
- Align with the market by considering a 1 Night minimum stay, as 94.7% of El Diamante hosts use this setting.
- Explore offering discounts for stays of 30+ nights to attract the 5.3% of the market seeking extended stays.
- Adjust minimum nights based on seasonality – potentially shorter during low season and longer during peak demand periods in El Diamante.
El Diamante Airbnb Cancellation Policy Trends Analysis (2026)
Flexible
7 listings
36.8% of total
Moderate
6 listings
31.6% of total
Firm
6 listings
31.6% of total
Cancellation Policy Insights for El Diamante
- The prevailing Airbnb cancellation policy trend in El Diamante is Flexible, used by 36.8% of listings.
- There's a relatively balanced mix between guest-friendly (68.4%) and stricter (31.6%) policies, offering choices for different guest needs.
Recommendations for Hosts
- Consider adopting a Flexible policy to align with the 36.8% market standard in El Diamante.
- Regularly review your cancellation policy against competitors and market demand shifts in El Diamante.
El Diamante STR Booking Lead Time Analysis (2026)
Average Booking Lead Time by Month
Booking Lead Time Insights for El Diamante
- The overall average booking lead time for vacation rentals in El Diamante is 24 days.
- Guests book furthest in advance for stays during November (average 35 days), likely coinciding with peak travel demand or local events.
- The shortest booking windows occur for stays in June (average 13 days), indicating more last-minute travel plans during this time.
- Seasonally, Fall (30 days avg.) sees the longest lead times, while Summer (15 days avg.) has the shortest, reflecting typical travel planning cycles.
Recommendations for Hosts
- Use the overall average lead time (24 days) as a baseline for your pricing and availability strategy in El Diamante.
- For November stays, consider implementing length-of-stay discounts or slightly higher rates for bookings made less than 35 days out to capitalize on advance planning.
- During June, focus on last-minute booking availability and promotions, as guests book with very short notice (13 days avg.).
- Target marketing efforts for the Fall season well in advance (at least 30 days) to capture early planners.
- Monitor your own booking lead times against these El Diamante averages to identify opportunities for dynamic pricing adjustments.
Popular & Essential Airbnb Amenities in El Diamante (2026)
Amenity Prevalence
Amenity Insights for El Diamante
- Popular amenities like Free parking on premises, Outdoor dining area, BBQ grill are common but not universal. Offering these can provide a competitive edge.
Recommendations for Hosts
- Consider adding popular differentiators like Free parking on premises or Outdoor dining area to increase appeal.
- Highlight unique or less common amenities you offer (e.g., hot tub, dedicated workspace, EV charger) in your listing description and photos.
- Regularly check competitor amenities in El Diamante to stay competitive.
El Diamante Airbnb Guest Demographics & Profile Analysis (2026)
Guest Profile Summary for El Diamante
- The typical guest profile for Airbnb in El Diamante consists of primarily domestic travelers (93%), often arriving from nearby Monterrey, typically belonging to the Post-2000s (Gen Z/Alpha) group (50%), primarily speaking Spanish or English.
- Domestic travelers account for 92.8% of guests.
- Key international markets include Mexico (92.8%) and United States (3.1%).
- Top languages spoken are Spanish (55.9%) followed by English (41.9%).
- A significant demographic segment is the Post-2000s (Gen Z/Alpha) group, representing 50% of guests.
Recommendations for Hosts
- Target domestic marketing efforts towards travelers from Monterrey and Saltillo.
- Tailor amenities and listing descriptions to appeal to the dominant Post-2000s (Gen Z/Alpha) demographic (e.g., highlight fast WiFi, smart home features, local guides).
- Highlight unique local experiences or amenities relevant to the primary guest profile.
- Consider seasonal promotions aligned with peak travel times for key origin markets.
Nearby Short-Term Rental Market Comparison
How does the El Diamante Airbnb market stack up against its neighbors? Compare key performance metrics like average monthly revenue, ADR, and occupancy rates in surrounding areas to understand the broader regional STR landscape.
| Market | Active Properties | Monthly Revenue | Daily Rate | Avg. Occupancy |
|---|---|---|---|---|
| Bella Unión | 10 | $4,181 | $286.89 | 37% |
| El Cercado | 14 | $1,947 | $212.87 | 32% |
| Jame | 10 | $1,486 | $169.30 | 27% |
| General Zuazua | 20 | $1,472 | $277.59 | 26% |
| Mesa de tablas | 43 | $1,457 | $302.25 | 18% |
| Barrio de Huajuquito | 11 | $1,453 | $236.72 | 26% |
| Arteaga | 86 | $1,323 | $213.56 | 24% |
| San Antonio de Las Alazanas | 37 | $1,165 | $285.00 | 18% |
| Allende | 17 | $1,151 | $150.10 | 30% |
| Montemorelos | 21 | $1,148 | $183.07 | 26% |