San Cristóbal Airbnb Market Analysis 2026: Short Term Rental Data & Vacation Rental Statistics in Chiapas, Mexico
Is Airbnb profitable in San Cristóbal in 2026? Explore comprehensive Airbnb analytics for San Cristóbal, Chiapas, Mexico to uncover income potential. This 2026 STR market report for San Cristóbal, based on AirROI data from February 2025 to January 2026, reveals key trends in the market of 862 active listings.
Whether you're considering an Airbnb investment in San Cristóbal, optimizing your existing vacation rental, or exploring rental arbitrage opportunities, understanding the San Cristóbal Airbnb data is crucial. Leveraging the low regulation environment is key to maximizing your short term rental income potential. Let's dive into the specifics.
Key San Cristóbal Airbnb Performance Metrics Overview
Monthly Airbnb Revenue Variations & Income Potential in San Cristóbal (2026)
Understanding the monthly revenue variations for Airbnb listings in San Cristóbal is key to maximizing your short term rental income potential. Seasonality significantly impacts earnings. Our analysis, based on data from the past 12 months, shows that the peak revenue month for STRs in San Cristóbal is typically December, while June often presents the lowest earnings, highlighting opportunities for strategic pricing adjustments during shoulder and low seasons. Explore the typical Airbnb income in San Cristóbal across different performance tiers:
- Best-in-class properties (Top 10%) achieve $1,176+ monthly, often utilizing dynamic pricing and superior guest experiences.
- Strong performing properties (Top 25%) earn $692 or more, indicating effective management and desirable locations/amenities.
- Typical properties (Median) generate around $344 per month, representing the average market performance.
- Entry-level properties (Bottom 25%) see earnings around $158, often with potential for optimization.
Average Monthly Airbnb Earnings Trend in San Cristóbal
San Cristóbal Airbnb Occupancy Rate Trends (2026)
Maximize your bookings by understanding the San Cristóbal STR occupancy trends. Seasonal demand shifts significantly influence how often properties are booked. Typically, Novembersees the highest demand (peak season occupancy), while June experiences the lowest (low season). Effective strategies, like adjusting minimum stays or offering promotions, can boost occupancy during slower periods. Here's how different property tiers perform in San Cristóbal:
- Best-in-class properties (Top 10%) achieve 70%+ occupancy, indicating high desirability and potentially optimized availability.
- Strong performing properties (Top 25%) maintain 50% or higher occupancy, suggesting good market fit and guest satisfaction.
- Typical properties (Median) have an occupancy rate around 28%.
- Entry-level properties (Bottom 25%) average 13% occupancy, potentially facing higher vacancy.
Average Monthly Occupancy Rate Trend in San Cristóbal
Average Daily Rate (ADR) Airbnb Trends in San Cristóbal (2026)
Effective short term rental pricing strategy in San Cristóbal involves understanding monthly ADR fluctuations. The Average Daily Rate (ADR) for Airbnb in San Cristóbal typically peaks in December and dips lowest during March. Leveraging Airbnb dynamic pricing tools or strategies based on this seasonality can significantly boost revenue. Here's a look at the typical nightly rates achieved:
- Best-in-class properties (Top 10%) command rates of $101+ per night, often due to premium features or locations.
- Strong performing properties (Top 25%) achieve nightly rates of $61 or more.
- Typical properties (Median) charge around $38 per night.
- Entry-level properties (Bottom 25%) earn around $25 per night.
Average Daily Rate (ADR) Trend by Month in San Cristóbal
Get Live San Cristóbal Market Intelligence 👇

Explore Real-time Analytics
Airbnb Seasonality Analysis & Trends in San Cristóbal (2026)
Peak Season (December, July, November)
- Revenue averages $649 per month
- Occupancy rates average 36.9%
- Daily rates average $57
Shoulder Season
- Revenue averages $509 per month
- Occupancy maintains around 33.2%
- Daily rates hold near $54
Low Season (March, June, September)
- Revenue drops to average $437 per month
- Occupancy decreases to average 29.7%
- Daily rates adjust to average $53
Seasonality Insights for San Cristóbal
- The Airbnb seasonality in San Cristóbal shows moderate seasonality with distinct peak and low periods. While the sections above show seasonal averages, it's also insightful to look at the extremes:
- During the high season, the absolute peak month showcases San Cristóbal's highest earning potential, with monthly revenues capable of climbing to $743, occupancy reaching a high of 37.8%, and ADRs peaking at $61.
- Conversely, the slowest single month of the year, typically falling within the low season, marks the market's lowest point. In this month, revenue might dip to $427, occupancy could drop to 26.8%, and ADRs may adjust down to $51.
- Understanding both the seasonal averages and these monthly peaks and troughs in revenue, occupancy, and ADR is crucial for maximizing your Airbnb profit potential in San Cristóbal.
Seasonal Strategies for Maximizing Profit
- Peak Season: Maximize revenue through premium pricing and potentially longer minimum stays. Ensure high availability.
- Low Season: Offer competitive pricing, special promotions (e.g., extended stay discounts), and flexible cancellation policies. Target off-season travelers like remote workers or budget-conscious guests.
- Shoulder Seasons: Implement dynamic pricing that balances peak and low rates. Target weekend travelers or specific events. Offer slightly more flexible terms than peak season.
- Regularly analyze your own performance against these San Cristóbal seasonality benchmarks and adjust your pricing and availability strategy accordingly.
Best Areas for Airbnb Investment in San Cristóbal (2026)
Exploring the top neighborhoods for short-term rentals in San Cristóbal? This section highlights key areas, outlining why they are attractive for hosts and guests, along with notable local attractions. Consider these locations based on your target guest profile and investment strategy.
| Neighborhood / Area | Why Host Here? (Target Guests & Appeal) | Key Attractions & Landmarks |
|---|---|---|
| Centro Histórico | The heart of San Cristóbal de las Casas, filled with colonial architecture, shops, and restaurants. Attracts tourists interested in history, culture, and vibrant street life. | Zocalo, Templo de Santo Domingo, Casa Na Bolom, Museo del Amber, Mercado de Dulces, Church of San Nicolás |
| El Cerrillo | A peaceful neighborhood near the city center, known for its local markets and residential feel. Great for families and those seeking a quieter stay while still being close to attractions. | Local markets, Cerro de San Gregorio, Parque de los Hombres, Templo de Santa Lucia, Museo de Trajes Típicos |
| San Juan Chamula | A nearby town known for its unique indigenous culture and traditions. Offers a rare glimpse into the Mayan way of life, attracting travelers seeking authentic experiences. | San Juan Chamula Church, Indigenous markets, Mayan rituals, Mayan cuisine, Cultural workshops |
| San Cristobalito | A higher elevation area offering stunning views of the city and surrounding landscape. Attracts nature lovers and those looking for a unique hillside retreat. | Viewpoints, Hiking trails, Nature reserves, Local handicraft shops |
| Zona Norte | An area popular with younger travelers and backpackers. Known for its hostels, budget accommodations, and social scene, ideal for those seeking interaction with fellow travelers. | Bars and clubs, Cafes, Backpacker hostels, Cultural events, Street art |
| Barrio de Mexicanos | A charming neighborhood featuring colorful colonial homes and a lively atmosphere. Provides visitors with a taste of local life and culture away from tourist hotspots. | Artisan shops, Local eateries, Historic buildings, Community events |
| Aldea de Zinacantán | Famed for its beautiful textiles and traditional Tzotzil culture. Perfect for tourists interested in handicrafts and indigenous cultural experiences. | Textile workshops, Traditional ceremonies, Local cuisine, Cultural tours |
| Chamber of Commerce Area | This area serves as a commercial hub and is close to modern amenities and business facilities. Ideal for business travelers and those attending conferences or events. | Modern coffee shops, Business centers, Shopping areas, Cultural exhibitions |
Understanding Airbnb License Requirements & STR Laws in San Cristóbal (2026)
While San Cristóbal, Chiapas, Mexico currently shows low STR regulations, specific Airbnb license requirements might still exist or change. Always verify the latest short term rental regulations and Airbnb license requirements directly with local government authorities for San Cristóbal to ensure full compliance before hosting.
(Source: AirROI data, 2026, based on 0% licensed listings)
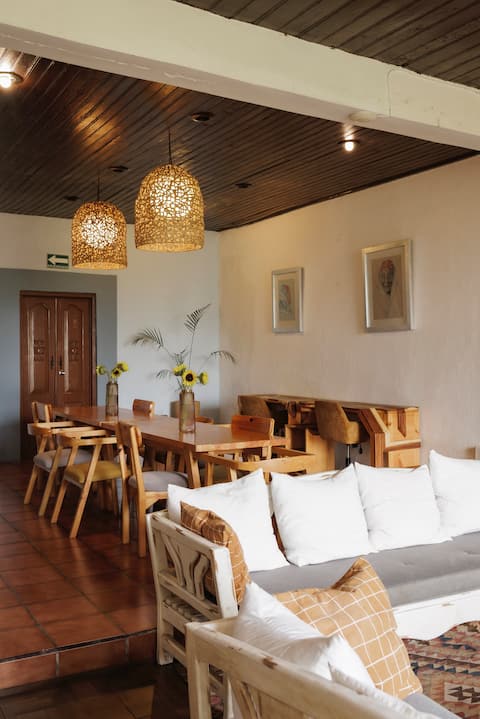
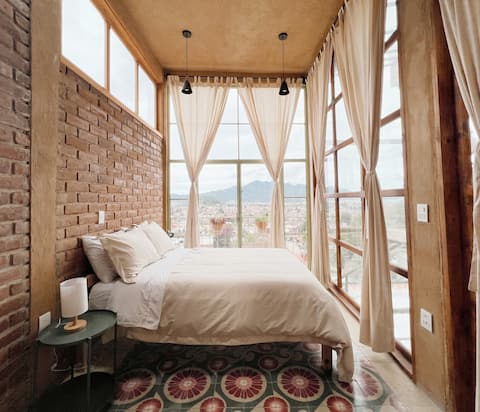
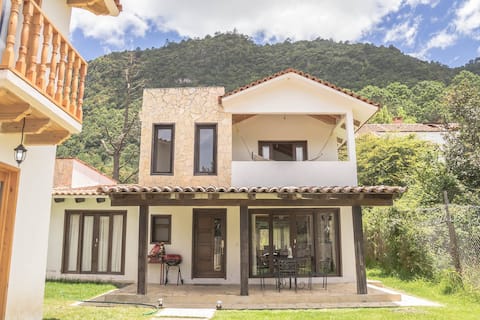
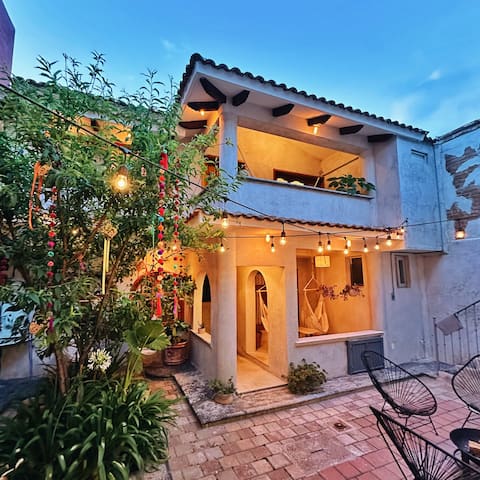
Top Performing Airbnb Properties in San Cristóbal (2026)
Benchmark your potential! Explore examples of top-performing Airbnb properties in San Cristóbalbased on Trailing Twelve Month (TTM) revenue. Analyze their characteristics, revenue, occupancy rate, and ADR to understand what drives success in this market.
Casa Centralita: views, fire pit + tree house!
Entire Place • 5 bedrooms
Casa Ocaso: downtown, terrace, amazing views!
Entire Place • 4 bedrooms
Large Families big house "La Cañada 12"
Entire Place • 7 bedrooms
Cozy home, walking distance San Cristobal
Entire Place • 7 bedrooms

House 23 San Cristóbal
Entire Place • 7 bedrooms

Unique long-term house in the center!
Entire Place • 2 bedrooms
Note: Performance varies based on location, size, amenities, seasonality, and management quality. Data reflects the past 12 months.
Top Performing Airbnb Hosts in San Cristóbal (2026)
Learn from the best! This table showcases top-performing Airbnb hosts in San Cristóbal based on the number of properties managed and estimated total revenue over the past year. Analyze their scale and performance metrics.
| Host Name | Properties | Grossing Revenue | Stay Reviews | Avg Rating |
|---|---|---|---|---|
| Daniel | 8 | $73,680 | 1112 | 4.94/5.0 |
| Grecia | 6 | $70,192 | 343 | 4.90/5.0 |
| Natalia | 7 | $63,355 | 461 | 4.91/5.0 |
| Casas | 4 | $62,516 | 100 | 4.92/5.0 |
| Gabriel | 4 | $61,289 | 1174 | 4.62/5.0 |
| Veronica | 8 | $57,033 | 293 | 4.83/5.0 |
| Dulce | 6 | $54,586 | 821 | 4.88/5.0 |
| Adriana | 5 | $51,906 | 437 | 4.89/5.0 |
| Oh | 9 | $51,285 | 641 | 4.84/5.0 |
| Ana Luisa | 9 | $51,172 | 105 | 4.92/5.0 |
Analyzing the strategies of top hosts, such as their property selection, pricing, and guest communication, can offer valuable lessons for optimizing your own Airbnb operations in San Cristóbal.
Dive Deeper: Advanced San Cristóbal STR Market Data (2026)
Ready to unlock more insights? AirROI provides access to advanced metrics and comprehensive Airbnb data for San Cristóbal. Explore detailed analytics beyond this report to refine your investment strategy, optimize pricing, and maximize your vacation rental profits.
Explore Advanced MetricsSan Cristóbal Short-Term Rental Market Composition (2026): Property & Room Types
Room Type Distribution
Property Type Distribution
Market Composition Insights for San Cristóbal
- The San Cristóbal Airbnb market composition is heavily skewed towards Entire Home/Apt listings, which make up 71% of the 862 active rentals. This indicates strong guest preference for privacy and space.
- Looking at the property type distribution in San Cristóbal, House properties are the most common (39.6%), reflecting the local real estate landscape.
- Houses represent a significant 39.6% portion, catering likely to families or larger groups.
- The presence of 13.7% Hotel/Boutique listings indicates integration with traditional hospitality.
- Smaller segments like others, unique stays (combined 3.2%) offer potential for unique stay experiences.
San Cristóbal Airbnb Room Capacity Analysis (2026): Bedroom Distribution
Distribution of Listings by Number of Bedrooms
Room Capacity Insights for San Cristóbal
- The dominant room capacity in San Cristóbal is 1 bedroom listings, making up 40.6% of the market. This suggests a strong demand for properties suitable for couples or solo travelers.
- Together, 1 bedroom and 2 bedrooms properties represent 63.5% of the active Airbnb listings in San Cristóbal, indicating a high concentration in these sizes.
San Cristóbal Vacation Rental Guest Capacity Trends (2026)
Distribution of Listings by Guest Capacity
Guest Capacity Insights for San Cristóbal
- The most common guest capacity trend in San Cristóbal vacation rentals is listings accommodating 2 guests (26.9%). This suggests the primary traveler segment is likely couples or solo travelers.
- Properties designed for 2 guests and 4 guests dominate the San Cristóbal STR market, accounting for 47.7% of listings.
- 25.0% of properties accommodate 6+ guests, serving the market segment for larger families or group travel in San Cristóbal.
- On average, properties in San Cristóbal are equipped to host 3.5 guests.
San Cristóbal Airbnb Booking Patterns (2026): Available vs. Booked Days
Available Days Distribution
Booked Days Distribution
Booking Pattern Insights for San Cristóbal
- The most common availability pattern in San Cristóbal falls within the 271-366 days range, representing 65.1% of listings. This suggests many properties have significant open periods on their calendars.
- Approximately 89.0% of listings show high availability (181+ days open annually), indicating potential for increased bookings or specific owner usage patterns.
- For booked days, the 1-30 days range is most frequent in San Cristóbal (32.6%), reflecting common guest stay durations or potential owner blocking patterns.
- A notable 11.6% of properties secure long booking periods (181+ days booked per year), highlighting successful long-term rental strategies or significant owner usage.
San Cristóbal Airbnb Minimum Stay Requirements Analysis
Distribution of Listings by Minimum Night Requirement
1 Night
464 listings
53.8% of total
2 Nights
243 listings
28.2% of total
3 Nights
40 listings
4.6% of total
4-6 Nights
12 listings
1.4% of total
7-29 Nights
13 listings
1.5% of total
30+ Nights
90 listings
10.4% of total
Key Insights
- The most prevalent minimum stay requirement in San Cristóbal is 1 Night, adopted by 53.8% of listings. This highlights the market's preference for shorter, flexible bookings.
- A strong majority (82.0%) of the San Cristóbal Airbnb data shows acceptance of very short stays (1-2 nights), indicating a dynamic, high-turnover market.
- A significant segment (10.4%) caters to monthly stays (30+ nights) in San Cristóbal, pointing to opportunities in the extended-stay market.
Recommendations
- Align with the market by considering a 1 Night minimum stay, as 53.8% of San Cristóbal hosts use this setting.
- Explore offering discounts for stays of 30+ nights to attract the 10.4% of the market seeking extended stays.
- Adjust minimum nights based on seasonality – potentially shorter during low season and longer during peak demand periods in San Cristóbal.
San Cristóbal Airbnb Cancellation Policy Trends Analysis (2026)
Limited
10 listings
1.2% of total
Flexible
318 listings
37% of total
Moderate
300 listings
34.9% of total
Firm
177 listings
20.6% of total
Strict
55 listings
6.4% of total
Cancellation Policy Insights for San Cristóbal
- The prevailing Airbnb cancellation policy trend in San Cristóbal is Flexible, used by 37% of listings.
- The market strongly favors guest-friendly terms, with 71.9% of listings offering Flexible or Moderate policies. This suggests guests in San Cristóbal may expect booking flexibility.
- Strict cancellation policies are quite rare (6.4%), potentially making listings with this policy less competitive unless justified by high demand or property type.
Recommendations for Hosts
- Consider adopting a Flexible policy to align with the 37% market standard in San Cristóbal.
- Using a Strict policy might deter some guests, as only 6.4% of listings use it. Evaluate if potential revenue protection outweighs possible lower booking rates.
- Regularly review your cancellation policy against competitors and market demand shifts in San Cristóbal.
San Cristóbal STR Booking Lead Time Analysis (2026)
Average Booking Lead Time by Month
Booking Lead Time Insights for San Cristóbal
- The overall average booking lead time for vacation rentals in San Cristóbal is 27 days.
- Guests book furthest in advance for stays during December (average 41 days), likely coinciding with peak travel demand or local events.
- The shortest booking windows occur for stays in March (average 19 days), indicating more last-minute travel plans during this time.
- Seasonally, Fall (33 days avg.) sees the longest lead times, while Summer (22 days avg.) has the shortest, reflecting typical travel planning cycles.
Recommendations for Hosts
- Use the overall average lead time (27 days) as a baseline for your pricing and availability strategy in San Cristóbal.
- For December stays, consider implementing length-of-stay discounts or slightly higher rates for bookings made less than 41 days out to capitalize on advance planning.
- Target marketing efforts for the Fall season well in advance (at least 33 days) to capture early planners.
- Monitor your own booking lead times against these San Cristóbal averages to identify opportunities for dynamic pricing adjustments.
Popular & Essential Airbnb Amenities in San Cristóbal (2026)
Amenity Prevalence
Amenity Insights for San Cristóbal
- Essential amenities in San Cristóbal that guests expect include: Wifi. Lacking these (this) could significantly impact bookings.
- Popular amenities like Hot water, Kitchen, Essentials are common but not universal. Offering these can provide a competitive edge.
Recommendations for Hosts
- Ensure your listing includes all essential amenities for San Cristóbal: Wifi.
- Prioritize adding missing essentials: Wifi.
- Consider adding popular differentiators like Hot water or Kitchen to increase appeal.
- Highlight unique or less common amenities you offer (e.g., hot tub, dedicated workspace, EV charger) in your listing description and photos.
- Regularly check competitor amenities in San Cristóbal to stay competitive.
San Cristóbal Airbnb Guest Demographics & Profile Analysis (2026)
Guest Profile Summary for San Cristóbal
- The typical guest profile for Airbnb in San Cristóbal consists of primarily domestic travelers (69%), often arriving from nearby Tuxtla Gutiérrez, typically belonging to the Post-2000s (Gen Z/Alpha) group (50%), primarily speaking Spanish or English.
- Domestic travelers account for 69.1% of guests.
- Key international markets include Mexico (69.1%) and United States (11.8%).
- Top languages spoken are Spanish (47%) followed by English (35.8%).
- A significant demographic segment is the Post-2000s (Gen Z/Alpha) group, representing 50% of guests.
Recommendations for Hosts
- Target domestic marketing efforts towards travelers from Tuxtla Gutiérrez and Mexico City.
- Tailor amenities and listing descriptions to appeal to the dominant Post-2000s (Gen Z/Alpha) demographic (e.g., highlight fast WiFi, smart home features, local guides).
- Highlight unique local experiences or amenities relevant to the primary guest profile.
- Consider seasonal promotions aligned with peak travel times for key origin markets.
Nearby Short-Term Rental Market Comparison
How does the San Cristóbal Airbnb market stack up against its neighbors? Compare key performance metrics like average monthly revenue, ADR, and occupancy rates in surrounding areas to understand the broader regional STR landscape.
| Market | Active Properties | Monthly Revenue | Daily Rate | Avg. Occupancy |
|---|---|---|---|---|
| Puerto Arista | 19 | $1,538 | $250.12 | 21% |
| Las Palmas Huitepec Tercera Sección | 11 | $398 | $73.31 | 23% |
| San Cristóbal de las Casas | 75 | $385 | $75.08 | 27% |
| Palenque | 197 | $322 | $55.38 | 27% |
| Tuxtla Gutiérrez | 387 | $291 | $44.27 | 31% |
| Boca del Cielo | 24 | $287 | $78.92 | 17% |
| Villahermosa | 288 | $272 | $44.62 | 28% |
| Chiapa de Corzo | 36 | $252 | $56.62 | 21% |
| Comitán de Domínguez | 13 | $248 | $56.85 | 23% |
| Huehuetenango | 61 | $211 | $58.24 | 23% |