Campeche City Airbnb Market Analysis 2026: Short Term Rental Data & Vacation Rental Statistics in Campeche, Mexico
Is Airbnb profitable in Campeche City in 2026? Explore comprehensive Airbnb analytics for Campeche City, Campeche, Mexico to uncover income potential. This 2026 STR market report for Campeche City, based on AirROI data from February 2025 to January 2026, reveals key trends in the market of 481 active listings.
Whether you're considering an Airbnb investment in Campeche City, optimizing your existing vacation rental, or exploring rental arbitrage opportunities, understanding the Campeche City Airbnb data is crucial. Leveraging the low regulation environment is key to maximizing your short term rental income potential. Let's dive into the specifics.
Key Campeche City Airbnb Performance Metrics Overview
Monthly Airbnb Revenue Variations & Income Potential in Campeche City (2026)
Understanding the monthly revenue variations for Airbnb listings in Campeche City is key to maximizing your short term rental income potential. Seasonality significantly impacts earnings. Our analysis, based on data from the past 12 months, shows that the peak revenue month for STRs in Campeche City is typically December, while September often presents the lowest earnings, highlighting opportunities for strategic pricing adjustments during shoulder and low seasons. Explore the typical Airbnb income in Campeche City across different performance tiers:
- Best-in-class properties (Top 10%) achieve $1,645+ monthly, often utilizing dynamic pricing and superior guest experiences.
- Strong performing properties (Top 25%) earn $868 or more, indicating effective management and desirable locations/amenities.
- Typical properties (Median) generate around $448 per month, representing the average market performance.
- Entry-level properties (Bottom 25%) see earnings around $199, often with potential for optimization.
Average Monthly Airbnb Earnings Trend in Campeche City
Campeche City Airbnb Occupancy Rate Trends (2026)
Maximize your bookings by understanding the Campeche City STR occupancy trends. Seasonal demand shifts significantly influence how often properties are booked. Typically, Februarysees the highest demand (peak season occupancy), while September experiences the lowest (low season). Effective strategies, like adjusting minimum stays or offering promotions, can boost occupancy during slower periods. Here's how different property tiers perform in Campeche City:
- Best-in-class properties (Top 10%) achieve 70%+ occupancy, indicating high desirability and potentially optimized availability.
- Strong performing properties (Top 25%) maintain 50% or higher occupancy, suggesting good market fit and guest satisfaction.
- Typical properties (Median) have an occupancy rate around 29%.
- Entry-level properties (Bottom 25%) average 13% occupancy, potentially facing higher vacancy.
Average Monthly Occupancy Rate Trend in Campeche City
Average Daily Rate (ADR) Airbnb Trends in Campeche City (2026)
Effective short term rental pricing strategy in Campeche City involves understanding monthly ADR fluctuations. The Average Daily Rate (ADR) for Airbnb in Campeche City typically peaks in December and dips lowest during April. Leveraging Airbnb dynamic pricing tools or strategies based on this seasonality can significantly boost revenue. Here's a look at the typical nightly rates achieved:
- Best-in-class properties (Top 10%) command rates of $128+ per night, often due to premium features or locations.
- Strong performing properties (Top 25%) achieve nightly rates of $74 or more.
- Typical properties (Median) charge around $47 per night.
- Entry-level properties (Bottom 25%) earn around $31 per night.
Average Daily Rate (ADR) Trend by Month in Campeche City
Get Live Campeche City Market Intelligence 👇

Explore Real-time Analytics
Airbnb Seasonality Analysis & Trends in Campeche City (2026)
Peak Season (December, July, January)
- Revenue averages $835 per month
- Occupancy rates average 35.3%
- Daily rates average $71
Shoulder Season
- Revenue averages $719 per month
- Occupancy maintains around 34.8%
- Daily rates hold near $66
Low Season (May, June, September)
- Revenue drops to average $583 per month
- Occupancy decreases to average 29.4%
- Daily rates adjust to average $66
Seasonality Insights for Campeche City
- The Airbnb seasonality in Campeche City shows moderate seasonality with distinct peak and low periods. While the sections above show seasonal averages, it's also insightful to look at the extremes:
- During the high season, the absolute peak month showcases Campeche City's highest earning potential, with monthly revenues capable of climbing to $867, occupancy reaching a high of 39.0%, and ADRs peaking at $73.
- Conversely, the slowest single month of the year, typically falling within the low season, marks the market's lowest point. In this month, revenue might dip to $540, occupancy could drop to 26.7%, and ADRs may adjust down to $62.
- Understanding both the seasonal averages and these monthly peaks and troughs in revenue, occupancy, and ADR is crucial for maximizing your Airbnb profit potential in Campeche City.
Seasonal Strategies for Maximizing Profit
- Peak Season: Maximize revenue through premium pricing and potentially longer minimum stays. Ensure high availability.
- Low Season: Offer competitive pricing, special promotions (e.g., extended stay discounts), and flexible cancellation policies. Target off-season travelers like remote workers or budget-conscious guests.
- Shoulder Seasons: Implement dynamic pricing that balances peak and low rates. Target weekend travelers or specific events. Offer slightly more flexible terms than peak season.
- Regularly analyze your own performance against these Campeche City seasonality benchmarks and adjust your pricing and availability strategy accordingly.
Best Areas for Airbnb Investment in Campeche City (2026)
Exploring the top neighborhoods for short-term rentals in Campeche City? This section highlights key areas, outlining why they are attractive for hosts and guests, along with notable local attractions. Consider these locations based on your target guest profile and investment strategy.
| Neighborhood / Area | Why Host Here? (Target Guests & Appeal) | Key Attractions & Landmarks |
|---|---|---|
| Centro Historico | The historic center of Campeche, known for its well-preserved colonial architecture and vibrant atmosphere. Ideal for tourists interested in culture, history, and local dining. | Fort San Miguel, Campeche Cathedral, Puerta de Tierra, Mayan Ruins Museum, Campeche Market, Arco de San Francisco |
| Malecón | A picturesque waterfront area perfect for those seeking relaxation and scenic views. Popular for evening strolls, dining, and enjoying the ocean breeze. | Malecón de Campeche, Teatro de la Ciudad, El Paseo de las Ruinas, Fishermen's dock, Local seafood restaurants |
| Barrio de San Francisco | A charming neighborhood known for its vibrant colors and local atmosphere, attracting visitors who want a more intimate experience away from the tourist hotspots. | San Francisco de Asis Church, Local handicraft shops, Street art, Neighborhood cafes |
| Baluarte de San Carlos | A historic bastion that offers panoramic views and is close to various cultural sites, making it a prime spot for sightseers and history enthusiasts. | Baluarte de San Carlos, Museum of the City, Nearby parks and plazas |
| Campeche Marina | An area popular with boat lovers and those enjoying water activities, perfect for families and groups looking for leisure activities. | Marina Campeche, Water sports facilities, Local eateries, Boating excursions |
| Colonia Morelos | A residential area that offers a more local feel, attracting those who want to experience life in Campeche away from typical tourist paths. | Local parks, Family-run restaurants, Markets, Cultural events |
| San Roman | Known for its archaeological sites and tranquility, appealing to tourists interested in ancient history and nature. | San Roman Archaeological Site, Nearby hiking trails, Local wildlife |
| Campeche Citadel | A fortified area rich in history and culture, great for tourists fascinated by history and military architecture. | Fortress walls, Visitor center, Cultural exhibitions |
Understanding Airbnb License Requirements & STR Laws in Campeche City (2026)
While Campeche City, Campeche, Mexico currently shows low STR regulations, specific Airbnb license requirements might still exist or change. Always verify the latest short term rental regulations and Airbnb license requirements directly with local government authorities for Campeche City to ensure full compliance before hosting.
(Source: AirROI data, 2026, finding no licensed listings among those analyzed)
Top Performing Airbnb Properties in Campeche City (2026)
Benchmark your potential! Explore examples of top-performing Airbnb properties in Campeche Citybased on Trailing Twelve Month (TTM) revenue. Analyze their characteristics, revenue, occupancy rate, and ADR to understand what drives success in this market.
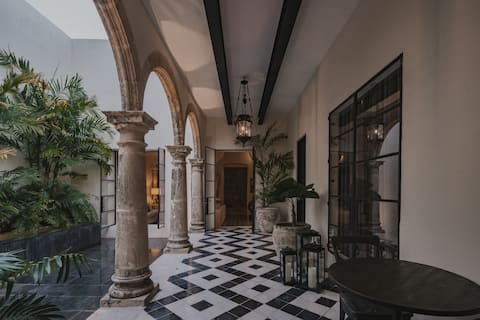
Casa Japa, Campeche-style Mansion
Entire Place • 4 bedrooms

Magical Campeche
Entire Place • 6 bedrooms

Casa San Román
Entire Place • 4 bedrooms

Casa Guadalupe
Entire Place • 3 bedrooms
Colonial Refuge in the Traditional Neighborhood of Campeche
Entire Place • 4 bedrooms

Campeche Gallery House
Entire Place • 3 bedrooms
Note: Performance varies based on location, size, amenities, seasonality, and management quality. Data reflects the past 12 months.
Top Performing Airbnb Hosts in Campeche City (2026)
Learn from the best! This table showcases top-performing Airbnb hosts in Campeche City based on the number of properties managed and estimated total revenue over the past year. Analyze their scale and performance metrics.
| Host Name | Properties | Grossing Revenue | Stay Reviews | Avg Rating |
|---|---|---|---|---|
| Alberto | 13 | $187,438 | 785 | 4.88/5.0 |
| Sebastien | 6 | $184,967 | 291 | 5.00/5.0 |
| MUR MURA Boutique Guesthouse | 10 | $94,671 | 557 | 4.87/5.0 |
| Abraham | 3 | $93,637 | 247 | 4.95/5.0 |
| Angelina | 5 | $85,111 | 138 | 4.94/5.0 |
| Carlos | 9 | $57,631 | 567 | 4.80/5.0 |
| Ursula | 5 | $57,618 | 20 | 4.96/5.0 |
| Casa Mineli | 6 | $56,965 | 869 | 4.81/5.0 |
| Luis Mauricio | 2 | $50,144 | 248 | 4.89/5.0 |
| Jose | 3 | $48,583 | 181 | 4.89/5.0 |
Analyzing the strategies of top hosts, such as their property selection, pricing, and guest communication, can offer valuable lessons for optimizing your own Airbnb operations in Campeche City.
Dive Deeper: Advanced Campeche City STR Market Data (2026)
Ready to unlock more insights? AirROI provides access to advanced metrics and comprehensive Airbnb data for Campeche City. Explore detailed analytics beyond this report to refine your investment strategy, optimize pricing, and maximize your vacation rental profits.
Explore Advanced MetricsCampeche City Short-Term Rental Market Composition (2026): Property & Room Types
Room Type Distribution
Property Type Distribution
Market Composition Insights for Campeche City
- The Campeche City Airbnb market composition is heavily skewed towards Entire Home/Apt listings, which make up 65.9% of the 481 active rentals. This indicates strong guest preference for privacy and space.
- However, a notable 33.7% share for Private Rooms suggests opportunities for budget-conscious travelers or hosts renting out spare rooms.
- Looking at the property type distribution in Campeche City, House properties are the most common (44.3%), reflecting the local real estate landscape.
- Houses represent a significant 44.3% portion, catering likely to families or larger groups.
- The presence of 13.1% Hotel/Boutique listings indicates integration with traditional hospitality.
- Smaller segments like others, outdoor/unique (combined 3.5%) offer potential for unique stay experiences.
Campeche City Airbnb Room Capacity Analysis (2026): Bedroom Distribution
Distribution of Listings by Number of Bedrooms
Room Capacity Insights for Campeche City
- The dominant room capacity in Campeche City is 1 bedroom listings, making up 48.6% of the market. This suggests a strong demand for properties suitable for couples or solo travelers.
- Together, 1 bedroom and 2 bedrooms properties represent 69.2% of the active Airbnb listings in Campeche City, indicating a high concentration in these sizes.
Campeche City Vacation Rental Guest Capacity Trends (2026)
Distribution of Listings by Guest Capacity
Guest Capacity Insights for Campeche City
- The most common guest capacity trend in Campeche City vacation rentals is listings accommodating 2 guests (26.2%). This suggests the primary traveler segment is likely couples or solo travelers.
- Properties designed for 2 guests and 4 guests dominate the Campeche City STR market, accounting for 48.7% of listings.
- 24.0% of properties accommodate 6+ guests, serving the market segment for larger families or group travel in Campeche City.
- On average, properties in Campeche City are equipped to host 3.6 guests.
Campeche City Airbnb Booking Patterns (2026): Available vs. Booked Days
Available Days Distribution
Booked Days Distribution
Booking Pattern Insights for Campeche City
- The most common availability pattern in Campeche City falls within the 271-366 days range, representing 60.7% of listings. This suggests many properties have significant open periods on their calendars.
- Approximately 88.4% of listings show high availability (181+ days open annually), indicating potential for increased bookings or specific owner usage patterns.
- For booked days, the 31-90 days range is most frequent in Campeche City (34.3%), reflecting common guest stay durations or potential owner blocking patterns.
- A notable 12.3% of properties secure long booking periods (181+ days booked per year), highlighting successful long-term rental strategies or significant owner usage.
Campeche City Airbnb Minimum Stay Requirements Analysis
Distribution of Listings by Minimum Night Requirement
1 Night
270 listings
56.1% of total
2 Nights
132 listings
27.4% of total
3 Nights
11 listings
2.3% of total
30+ Nights
68 listings
14.1% of total
Key Insights
- The most prevalent minimum stay requirement in Campeche City is 1 Night, adopted by 56.1% of listings. This highlights the market's preference for shorter, flexible bookings.
- A strong majority (83.5%) of the Campeche City Airbnb data shows acceptance of very short stays (1-2 nights), indicating a dynamic, high-turnover market.
- A significant segment (14.1%) caters to monthly stays (30+ nights) in Campeche City, pointing to opportunities in the extended-stay market.
Recommendations
- Align with the market by considering a 1 Night minimum stay, as 56.1% of Campeche City hosts use this setting.
- Explore offering discounts for stays of 30+ nights to attract the 14.1% of the market seeking extended stays.
- Adjust minimum nights based on seasonality – potentially shorter during low season and longer during peak demand periods in Campeche City.
Campeche City Airbnb Cancellation Policy Trends Analysis (2026)
Limited
17 listings
3.5% of total
Flexible
195 listings
40.7% of total
Moderate
171 listings
35.7% of total
Firm
64 listings
13.4% of total
Strict
32 listings
6.7% of total
Cancellation Policy Insights for Campeche City
- The prevailing Airbnb cancellation policy trend in Campeche City is Flexible, used by 40.7% of listings.
- The market strongly favors guest-friendly terms, with 76.4% of listings offering Flexible or Moderate policies. This suggests guests in Campeche City may expect booking flexibility.
- Strict cancellation policies are quite rare (6.7%), potentially making listings with this policy less competitive unless justified by high demand or property type.
Recommendations for Hosts
- Consider adopting a Flexible policy to align with the 40.7% market standard in Campeche City.
- Using a Strict policy might deter some guests, as only 6.7% of listings use it. Evaluate if potential revenue protection outweighs possible lower booking rates.
- Regularly review your cancellation policy against competitors and market demand shifts in Campeche City.
Campeche City STR Booking Lead Time Analysis (2026)
Average Booking Lead Time by Month
Booking Lead Time Insights for Campeche City
- The overall average booking lead time for vacation rentals in Campeche City is 25 days.
- Guests book furthest in advance for stays during July (average 44 days), likely coinciding with peak travel demand or local events.
- The shortest booking windows occur for stays in June (average 15 days), indicating more last-minute travel plans during this time.
- Seasonally, Summer (34 days avg.) sees the longest lead times, while Spring (18 days avg.) has the shortest, reflecting typical travel planning cycles.
Recommendations for Hosts
- Use the overall average lead time (25 days) as a baseline for your pricing and availability strategy in Campeche City.
- For July stays, consider implementing length-of-stay discounts or slightly higher rates for bookings made less than 44 days out to capitalize on advance planning.
- Target marketing efforts for the Summer season well in advance (at least 34 days) to capture early planners.
- Monitor your own booking lead times against these Campeche City averages to identify opportunities for dynamic pricing adjustments.
Popular & Essential Airbnb Amenities in Campeche City (2026)
Amenity Prevalence
Amenity Insights for Campeche City
- Essential amenities in Campeche City that guests expect include: Wifi, Air conditioning. Lacking these (any) could significantly impact bookings.
- Popular amenities like TV, Hot water, Essentials are common but not universal. Offering these can provide a competitive edge.
Recommendations for Hosts
- Ensure your listing includes all essential amenities for Campeche City: Wifi, Air conditioning.
- Prioritize adding missing essentials: Wifi, Air conditioning.
- Consider adding popular differentiators like TV or Hot water to increase appeal.
- Highlight unique or less common amenities you offer (e.g., hot tub, dedicated workspace, EV charger) in your listing description and photos.
- Regularly check competitor amenities in Campeche City to stay competitive.
Campeche City Airbnb Guest Demographics & Profile Analysis (2026)
Guest Profile Summary for Campeche City
- The typical guest profile for Airbnb in Campeche City consists of primarily domestic travelers (70%), often arriving from nearby Mexico City, typically belonging to the Post-2000s (Gen Z/Alpha) group (50%), primarily speaking Spanish or English.
- Domestic travelers account for 69.9% of guests.
- Key international markets include Mexico (69.9%) and United States (10.4%).
- Top languages spoken are Spanish (44.9%) followed by English (36.7%).
- A significant demographic segment is the Post-2000s (Gen Z/Alpha) group, representing 50% of guests.
Recommendations for Hosts
- Target domestic marketing efforts towards travelers from Mexico City and Mérida.
- Tailor amenities and listing descriptions to appeal to the dominant Post-2000s (Gen Z/Alpha) demographic (e.g., highlight fast WiFi, smart home features, local guides).
- Highlight unique local experiences or amenities relevant to the primary guest profile.
- Consider seasonal promotions aligned with peak travel times for key origin markets.
Nearby Short-Term Rental Market Comparison
How does the Campeche City Airbnb market stack up against its neighbors? Compare key performance metrics like average monthly revenue, ADR, and occupancy rates in surrounding areas to understand the broader regional STR landscape.
| Market | Active Properties | Monthly Revenue | Daily Rate | Avg. Occupancy |
|---|---|---|---|---|
| Mérida | 4,567 | $790 | $79.86 | 42% |
| Celestún | 63 | $695 | $108.49 | 24% |
| San Lorenzo | 17 | $679 | $142.75 | 27% |
| Lerma | 22 | $563 | $138.45 | 26% |
| Xpujil | 13 | $480 | $75.40 | 27% |
| Santa Elena | 10 | $454 | $125.79 | 21% |
| Ciudad del Carmen | 118 | $398 | $65.32 | 29% |
| Centro | 32 | $385 | $64.86 | 32% |
| Isla Aguada | 20 | $370 | $117.98 | 17% |
| Izamal | 82 | $338 | $95.05 | 19% |