Nopoló Airbnb Market Analysis 2026: Short Term Rental Data & Vacation Rental Statistics in Baja California Sur, Mexico
Is Airbnb profitable in Nopoló in 2026? Explore comprehensive Airbnb analytics for Nopoló, Baja California Sur, Mexico to uncover income potential. This 2026 STR market report for Nopoló, based on AirROI data from February 2025 to January 2026, reveals key trends in the niche market of 124 active listings.
Whether you're considering an Airbnb investment in Nopoló, optimizing your existing vacation rental, or exploring rental arbitrage opportunities, understanding the Nopoló Airbnb data is crucial. Leveraging the low regulation environment is key to maximizing your short term rental income potential. Let's dive into the specifics.
Key Nopoló Airbnb Performance Metrics Overview
Monthly Airbnb Revenue Variations & Income Potential in Nopoló (2026)
Understanding the monthly revenue variations for Airbnb listings in Nopoló is key to maximizing your short term rental income potential. Seasonality significantly impacts earnings. Our analysis, based on data from the past 12 months, shows that the peak revenue month for STRs in Nopoló is typically March, while September often presents the lowest earnings, highlighting opportunities for strategic pricing adjustments during shoulder and low seasons. Explore the typical Airbnb income in Nopoló across different performance tiers:
- Best-in-class properties (Top 10%) achieve $5,318+ monthly, often utilizing dynamic pricing and superior guest experiences.
- Strong performing properties (Top 25%) earn $3,555 or more, indicating effective management and desirable locations/amenities.
- Typical properties (Median) generate around $2,217 per month, representing the average market performance.
- Entry-level properties (Bottom 25%) see earnings around $1,137, often with potential for optimization.
Average Monthly Airbnb Earnings Trend in Nopoló
Nopoló Airbnb Occupancy Rate Trends (2026)
Maximize your bookings by understanding the Nopoló STR occupancy trends. Seasonal demand shifts significantly influence how often properties are booked. Typically, Februarysees the highest demand (peak season occupancy), while September experiences the lowest (low season). Effective strategies, like adjusting minimum stays or offering promotions, can boost occupancy during slower periods. Here's how different property tiers perform in Nopoló:
- Best-in-class properties (Top 10%) achieve 76%+ occupancy, indicating high desirability and potentially optimized availability.
- Strong performing properties (Top 25%) maintain 54% or higher occupancy, suggesting good market fit and guest satisfaction.
- Typical properties (Median) have an occupancy rate around 34%.
- Entry-level properties (Bottom 25%) average 17% occupancy, potentially facing higher vacancy.
Average Monthly Occupancy Rate Trend in Nopoló
Average Daily Rate (ADR) Airbnb Trends in Nopoló (2026)
Effective short term rental pricing strategy in Nopoló involves understanding monthly ADR fluctuations. The Average Daily Rate (ADR) for Airbnb in Nopoló typically peaks in December and dips lowest during March. Leveraging Airbnb dynamic pricing tools or strategies based on this seasonality can significantly boost revenue. Here's a look at the typical nightly rates achieved:
- Best-in-class properties (Top 10%) command rates of $411+ per night, often due to premium features or locations.
- Strong performing properties (Top 25%) achieve nightly rates of $260 or more.
- Typical properties (Median) charge around $201 per night.
- Entry-level properties (Bottom 25%) earn around $163 per night.
Average Daily Rate (ADR) Trend by Month in Nopoló
Get Live Nopoló Market Intelligence 👇

Explore Real-time Analytics
Airbnb Seasonality Analysis & Trends in Nopoló (2026)
Peak Season (March, February, April)
- Revenue averages $3,745 per month
- Occupancy rates average 53.5%
- Daily rates average $267
Shoulder Season
- Revenue averages $2,600 per month
- Occupancy maintains around 35.4%
- Daily rates hold near $298
Low Season (June, August, September)
- Revenue drops to average $1,890 per month
- Occupancy decreases to average 27.8%
- Daily rates adjust to average $290
Seasonality Insights for Nopoló
- The Airbnb seasonality in Nopoló shows highly seasonal trends requiring careful strategy. While the sections above show seasonal averages, it's also insightful to look at the extremes:
- During the high season, the absolute peak month showcases Nopoló's highest earning potential, with monthly revenues capable of climbing to $4,073, occupancy reaching a high of 60.1%, and ADRs peaking at $311.
- Conversely, the slowest single month of the year, typically falling within the low season, marks the market's lowest point. In this month, revenue might dip to $1,799, occupancy could drop to 24.4%, and ADRs may adjust down to $266.
- Understanding both the seasonal averages and these monthly peaks and troughs in revenue, occupancy, and ADR is crucial for maximizing your Airbnb profit potential in Nopoló.
Seasonal Strategies for Maximizing Profit
- Peak Season: Maximize revenue through premium pricing and potentially longer minimum stays. Ensure high availability.
- Low Season: Offer competitive pricing, special promotions (e.g., extended stay discounts), and flexible cancellation policies. Target off-season travelers like remote workers or budget-conscious guests.
- Shoulder Seasons: Implement dynamic pricing that balances peak and low rates. Target weekend travelers or specific events. Offer slightly more flexible terms than peak season.
- Regularly analyze your own performance against these Nopoló seasonality benchmarks and adjust your pricing and availability strategy accordingly.
Best Areas for Airbnb Investment in Nopoló (2026)
Exploring the top neighborhoods for short-term rentals in Nopoló? This section highlights key areas, outlining why they are attractive for hosts and guests, along with notable local attractions. Consider these locations based on your target guest profile and investment strategy.
| Neighborhood / Area | Why Host Here? (Target Guests & Appeal) | Key Attractions & Landmarks |
|---|---|---|
| Nopoló Beach | Gorgeous beach location with stunning views and access to marine activities. A favorite spot for tourists seeking relaxation and water sports in a serene environment. | Nopoló Beach, Las Cruces Beach, El Cardonal, Fishing, snorkeling, and diving tours, Luxury resorts nearby |
| Loreto Bay | A beautiful resort community offering a blend of luxury and nature. Perfect for tourists seeking outdoor activities as well as beach relaxation. | Loreto Bay National Park, Golf courses, Beachfront dining, Kayaking and paddleboarding, Local artisan markets |
| Danzante Bay | An exclusive community with stunning natural beauty, perfect for high-end travel experiences. Attracts upscale tourists focusing on wellness and relaxation. | Danzante Bay Golf Course, Wildlife viewing, Hiking trails, Private coves and beaches, Spa services |
| Loreto Town | Charming historic town with colonial architecture and local culture. Provides a taste of authentic Mexican life and accessibility to local attractions. | Mission of Our Lady of Loreto, Loreto Historical Museum, Local shops and restaurants, Water tours to nearby islands, Cultural events and festivals |
| Isla del Carmen | Peaceful island escape known for its scenic beauty and tranquility. A great spot for adventurous tourists looking to explore the surrounding marine environment. | Secluded beaches, Marine biodiversity, Kayaking, Fishing expeditions, Camping |
| San Javier Mission | Historical site showcasing colonial architecture and rich history. A unique attraction for tourists interested in culture and heritage. | San Javier Mission, Surrounding natural parks, Hiking opportunities, Cultural tours, Local food experiences |
| La Paz | Although not directly in Nopoló, La Paz is nearby and offers urban amenities and vibrant nightlife. Attracts a diverse group of tourists seeking city and beach experiences. | Malecon de La Paz, Sea of Cortez tours, Local markets, Art galleries, Beaches |
| Baja California Sur Wine Region | Emerging wine tourism spot known for its vineyards and wine tasting experiences. Attracts tourists looking for unique culinary experiences. | Local wineries, Wine tasting tours, Gourmet restaurants, Culinary festivals, Beautiful landscapes |
Understanding Airbnb License Requirements & STR Laws in Nopoló (2026)
While Nopoló, Baja California Sur, Mexico currently shows low STR regulations, specific Airbnb license requirements might still exist or change. Always verify the latest short term rental regulations and Airbnb license requirements directly with local government authorities for Nopoló to ensure full compliance before hosting.
(Source: AirROI data, 2026, finding no licensed listings among those analyzed)
Top Performing Airbnb Properties in Nopoló (2026)
Benchmark your potential! Explore examples of top-performing Airbnb properties in Nopolóbased on Trailing Twelve Month (TTM) revenue. Analyze their characteristics, revenue, occupancy rate, and ADR to understand what drives success in this market.
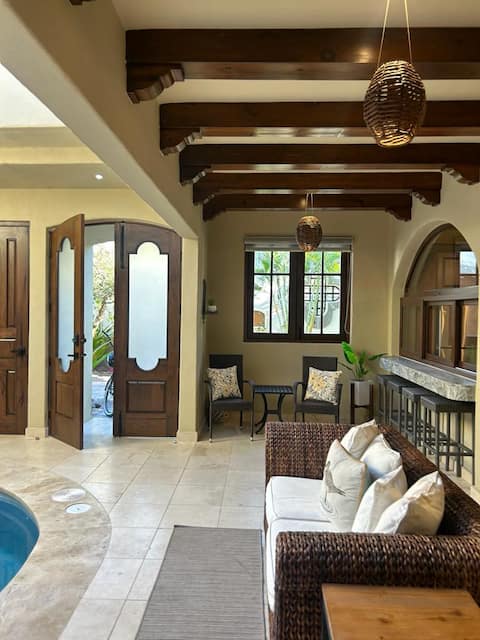
Casa Dorado: Beach, pools, family fun!
Entire Place • 5 bedrooms
Casa MIramar en Loreto Bay ,WiFi alta velocidad
Entire Place • 4 bedrooms

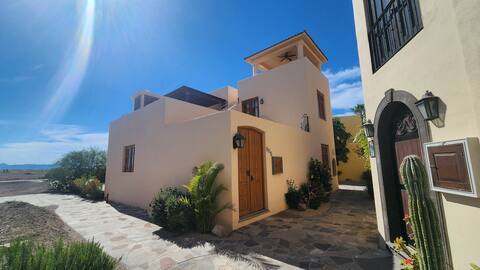
Steps from the Beach + Spectacular Mountain Views!
Entire Place • 2 bedrooms
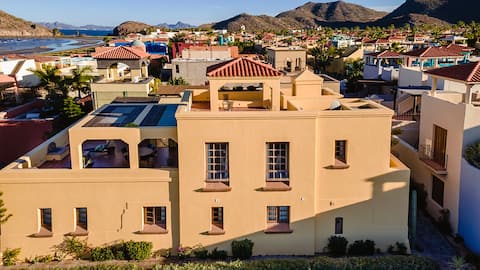
Luxury Villa w/ Breathtaking Ocean+Mountain Views!
Entire Place • 2 bedrooms
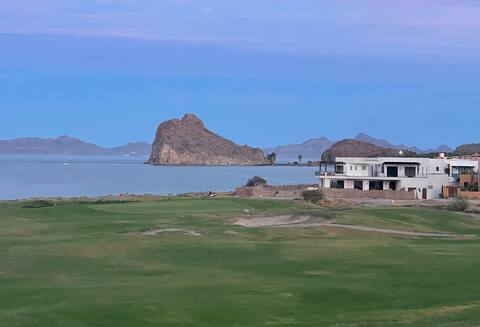
Best Views in Loreto Bay
Entire Place • 6 bedrooms
Loreto Bay Poolside Living + Steps from the Beach
Entire Place • 3 bedrooms
Note: Performance varies based on location, size, amenities, seasonality, and management quality. Data reflects the past 12 months.
Top Performing Airbnb Hosts in Nopoló (2026)
Learn from the best! This table showcases top-performing Airbnb hosts in Nopoló based on the number of properties managed and estimated total revenue over the past year. Analyze their scale and performance metrics.
| Host Name | Properties | Grossing Revenue | Stay Reviews | Avg Rating |
|---|---|---|---|---|
| Casago | 32 | $428,756 | 327 | 4.91/5.0 |
| Loreto | 15 | $312,231 | 372 | 4.82/5.0 |
| Katie | 2 | $117,652 | 400 | 4.91/5.0 |
| Zulma | 1 | $78,813 | 26 | 4.92/5.0 |
| Momentum | 6 | $59,926 | 24 | 4.68/5.0 |
| Jessica | 2 | $57,200 | 6 | 5.00/5.0 |
| Sarah | 1 | $52,467 | 2 | Not Rated |
| Elaine | 1 | $51,767 | 83 | 4.95/5.0 |
| Jessica | 1 | $50,610 | 7 | 5.00/5.0 |
| Jonathan | 1 | $48,081 | 64 | 4.97/5.0 |
Analyzing the strategies of top hosts, such as their property selection, pricing, and guest communication, can offer valuable lessons for optimizing your own Airbnb operations in Nopoló.
Dive Deeper: Advanced Nopoló STR Market Data (2026)
Ready to unlock more insights? AirROI provides access to advanced metrics and comprehensive Airbnb data for Nopoló. Explore detailed analytics beyond this report to refine your investment strategy, optimize pricing, and maximize your vacation rental profits.
Explore Advanced MetricsNopoló Short-Term Rental Market Composition (2026): Property & Room Types
Room Type Distribution
Property Type Distribution
Market Composition Insights for Nopoló
- The Nopoló Airbnb market composition is heavily skewed towards Entire Home/Apt listings, which make up 100% of the 124 active rentals. This indicates strong guest preference for privacy and space.
- Looking at the property type distribution in Nopoló, House properties are the most common (87.1%), reflecting the local real estate landscape.
- Houses represent a significant 87.1% portion, catering likely to families or larger groups.
- Smaller segments like hotel/boutique (combined 4.8%) offer potential for unique stay experiences.
Nopoló Airbnb Room Capacity Analysis (2026): Bedroom Distribution
Distribution of Listings by Number of Bedrooms
Room Capacity Insights for Nopoló
- The dominant room capacity in Nopoló is 2 bedrooms listings, making up 56.5% of the market. This suggests a strong demand for properties suitable for couples or solo travelers.
- Together, 2 bedrooms and 3 bedrooms properties represent 79.9% of the active Airbnb listings in Nopoló, indicating a high concentration in these sizes.
- A significant 32.3% of listings offer 3+ bedrooms, catering to larger groups and families seeking more space in Nopoló.
Nopoló Vacation Rental Guest Capacity Trends (2026)
Distribution of Listings by Guest Capacity
Guest Capacity Insights for Nopoló
- The most common guest capacity trend in Nopoló vacation rentals is listings accommodating 6 guests (37.9%). This suggests the primary traveler segment is likely larger groups.
- Properties designed for 6 guests and 4 guests dominate the Nopoló STR market, accounting for 70.2% of listings.
- 52.4% of properties accommodate 6+ guests, serving the market segment for larger families or group travel in Nopoló.
- On average, properties in Nopoló are equipped to host 5.2 guests.
Nopoló Airbnb Booking Patterns (2026): Available vs. Booked Days
Available Days Distribution
Booked Days Distribution
Booking Pattern Insights for Nopoló
- The most common availability pattern in Nopoló falls within the 271-366 days range, representing 63.7% of listings. This suggests many properties have significant open periods on their calendars.
- Approximately 91.1% of listings show high availability (181+ days open annually), indicating potential for increased bookings or specific owner usage patterns.
- For booked days, the 31-90 days range is most frequent in Nopoló (38.7%), reflecting common guest stay durations or potential owner blocking patterns.
- A notable 9.7% of properties secure long booking periods (181+ days booked per year), highlighting successful long-term rental strategies or significant owner usage.
Nopoló Airbnb Minimum Stay Requirements Analysis
Distribution of Listings by Minimum Night Requirement
1 Night
10 listings
8.1% of total
2 Nights
11 listings
8.9% of total
3 Nights
54 listings
43.5% of total
4-6 Nights
18 listings
14.5% of total
7-29 Nights
3 listings
2.4% of total
30+ Nights
28 listings
22.6% of total
Key Insights
- The most prevalent minimum stay requirement in Nopoló is 3 Nights, adopted by 43.5% of listings. This highlights the market's preference for longer commitments.
- Very short stays (1-2 nights) are less common (17.0%), suggesting hosts prefer slightly longer bookings to optimize turnover.
- A significant segment (22.6%) caters to monthly stays (30+ nights) in Nopoló, pointing to opportunities in the extended-stay market.
Recommendations
- Align with the market by considering a 3 Nights minimum stay, as 43.5% of Nopoló hosts use this setting.
- If feasible, allowing 1-night stays, especially midweek or during low season, could capture last-minute bookings, as only 8.1% currently do.
- Explore offering discounts for stays of 30+ nights to attract the 22.6% of the market seeking extended stays.
- Adjust minimum nights based on seasonality – potentially shorter during low season and longer during peak demand periods in Nopoló.
Nopoló Airbnb Cancellation Policy Trends Analysis (2026)
Super Strict 30 Days
5 listings
4% of total
Limited
27 listings
21.8% of total
Flexible
13 listings
10.5% of total
Moderate
15 listings
12.1% of total
Firm
47 listings
37.9% of total
Strict
17 listings
13.7% of total
Cancellation Policy Insights for Nopoló
- The prevailing Airbnb cancellation policy trend in Nopoló is Firm, used by 37.9% of listings.
- A majority (51.6%) of hosts in Nopoló utilize Firm or Strict policies, indicating a market where hosts prioritize booking security.
Recommendations for Hosts
- Consider adopting a Firm policy to align with the 37.9% market standard in Nopoló.
- Using a Strict policy might deter some guests, as only 13.7% of listings use it. Evaluate if potential revenue protection outweighs possible lower booking rates.
- Regularly review your cancellation policy against competitors and market demand shifts in Nopoló.
Nopoló STR Booking Lead Time Analysis (2026)
Average Booking Lead Time by Month
Booking Lead Time Insights for Nopoló
- The overall average booking lead time for vacation rentals in Nopoló is 74 days.
- Guests book furthest in advance for stays during January (average 111 days), likely coinciding with peak travel demand or local events.
- The shortest booking windows occur for stays in September (average 35 days), indicating more last-minute travel plans during this time.
- Seasonally, Winter (103 days avg.) sees the longest lead times, while Summer (40 days avg.) has the shortest, reflecting typical travel planning cycles.
Recommendations for Hosts
- Use the overall average lead time (74 days) as a baseline for your pricing and availability strategy in Nopoló.
- For January stays, consider implementing length-of-stay discounts or slightly higher rates for bookings made less than 111 days out to capitalize on advance planning.
- Target marketing efforts for the Winter season well in advance (at least 103 days) to capture early planners.
- Monitor your own booking lead times against these Nopoló averages to identify opportunities for dynamic pricing adjustments.
Popular & Essential Airbnb Amenities in Nopoló (2026)
Amenity Prevalence
Amenity Insights for Nopoló
- Essential amenities in Nopoló that guests expect include: Wifi, Air conditioning, Kitchen, TV, Washer. Lacking these (any) could significantly impact bookings.
- Popular amenities like Dryer, Refrigerator, Coffee maker are common but not universal. Offering these can provide a competitive edge.
Recommendations for Hosts
- Ensure your listing includes all essential amenities for Nopoló: Wifi, Air conditioning, Kitchen, TV, Washer.
- Prioritize adding missing essentials: Wifi, Air conditioning, Kitchen, TV, Washer.
- Consider adding popular differentiators like Dryer or Refrigerator to increase appeal.
- Highlight unique or less common amenities you offer (e.g., hot tub, dedicated workspace, EV charger) in your listing description and photos.
- Regularly check competitor amenities in Nopoló to stay competitive.
Nopoló Airbnb Guest Demographics & Profile Analysis (2026)
Guest Profile Summary for Nopoló
- The typical guest profile for Airbnb in Nopoló consists of predominantly international visitors (77%), with top international origins including Mexico, typically belonging to the Post-2000s (Gen Z/Alpha) group (50%), primarily speaking English or Spanish.
- Domestic travelers account for 22.9% of guests.
- Key international markets include United States (67.4%) and Mexico (22.9%).
- Top languages spoken are English (50.6%) followed by Spanish (35.2%).
- A significant demographic segment is the Post-2000s (Gen Z/Alpha) group, representing 50% of guests.
Recommendations for Hosts
- Focus marketing internationally, particularly towards travelers from Mexico.
- Tailor amenities and listing descriptions to appeal to the dominant Post-2000s (Gen Z/Alpha) demographic (e.g., highlight fast WiFi, smart home features, local guides).
- Highlight unique local experiences or amenities relevant to the primary guest profile.
- Consider seasonal promotions aligned with peak travel times for key origin markets.
Nearby Short-Term Rental Market Comparison
How does the Nopoló Airbnb market stack up against its neighbors? Compare key performance metrics like average monthly revenue, ADR, and occupancy rates in surrounding areas to understand the broader regional STR landscape.
| Market | Active Properties | Monthly Revenue | Daily Rate | Avg. Occupancy |
|---|---|---|---|---|
| Ensenada Blanca | 10 | $2,504 | $421.48 | 28% |
| La Paz | 1,901 | $1,342 | $128.14 | 43% |
| Heroica Mulegé | 49 | $1,286 | $108.34 | 45% |
| Chametla | 28 | $1,120 | $97.27 | 46% |
| Loreto | 321 | $1,039 | $136.90 | 34% |
| El Centenario | 66 | $717 | $115.65 | 32% |
| San Juanico | 23 | $661 | $148.98 | 25% |
| Puerto San Carlos | 23 | $375 | $85.15 | 23% |
| Ciudad Constitución | 14 | $194 | $48.03 | 29% |