La Paz Airbnb Market Analysis 2026: Short Term Rental Data & Vacation Rental Statistics in Baja California Sur, Mexico
Is Airbnb profitable in La Paz in 2026? Explore comprehensive Airbnb analytics for La Paz, Baja California Sur, Mexico to uncover income potential. This 2026 STR market report for La Paz, based on AirROI data from February 2025 to January 2026, reveals key trends in the bustling market of 1,901 active listings.
Whether you're considering an Airbnb investment in La Paz, optimizing your existing vacation rental, or exploring rental arbitrage opportunities, understanding the La Paz Airbnb data is crucial. Leveraging the low regulation environment is key to maximizing your short term rental income potential. Let's dive into the specifics.
Key La Paz Airbnb Performance Metrics Overview
Monthly Airbnb Revenue Variations & Income Potential in La Paz (2026)
Understanding the monthly revenue variations for Airbnb listings in La Paz is key to maximizing your short term rental income potential. Seasonality significantly impacts earnings. Our analysis, based on data from the past 12 months, shows that the peak revenue month for STRs in La Paz is typically July, while September often presents the lowest earnings, highlighting opportunities for strategic pricing adjustments during shoulder and low seasons. Explore the typical Airbnb income in La Paz across different performance tiers:
- Best-in-class properties (Top 10%) achieve $3,997+ monthly, often utilizing dynamic pricing and superior guest experiences.
- Strong performing properties (Top 25%) earn $1,919 or more, indicating effective management and desirable locations/amenities.
- Typical properties (Median) generate around $984 per month, representing the average market performance.
- Entry-level properties (Bottom 25%) see earnings around $471, often with potential for optimization.
Average Monthly Airbnb Earnings Trend in La Paz
La Paz Airbnb Occupancy Rate Trends (2026)
Maximize your bookings by understanding the La Paz STR occupancy trends. Seasonal demand shifts significantly influence how often properties are booked. Typically, Februarysees the highest demand (peak season occupancy), while January experiences the lowest (low season). Effective strategies, like adjusting minimum stays or offering promotions, can boost occupancy during slower periods. Here's how different property tiers perform in La Paz:
- Best-in-class properties (Top 10%) achieve 83%+ occupancy, indicating high desirability and potentially optimized availability.
- Strong performing properties (Top 25%) maintain 68% or higher occupancy, suggesting good market fit and guest satisfaction.
- Typical properties (Median) have an occupancy rate around 45%.
- Entry-level properties (Bottom 25%) average 23% occupancy, potentially facing higher vacancy.
Average Monthly Occupancy Rate Trend in La Paz
Average Daily Rate (ADR) Airbnb Trends in La Paz (2026)
Effective short term rental pricing strategy in La Paz involves understanding monthly ADR fluctuations. The Average Daily Rate (ADR) for Airbnb in La Paz typically peaks in December and dips lowest during March. Leveraging Airbnb dynamic pricing tools or strategies based on this seasonality can significantly boost revenue. Here's a look at the typical nightly rates achieved:
- Best-in-class properties (Top 10%) command rates of $264+ per night, often due to premium features or locations.
- Strong performing properties (Top 25%) achieve nightly rates of $134 or more.
- Typical properties (Median) charge around $75 per night.
- Entry-level properties (Bottom 25%) earn around $48 per night.
Average Daily Rate (ADR) Trend by Month in La Paz
Get Live La Paz Market Intelligence 👇

Explore Real-time Analytics
Airbnb Seasonality Analysis & Trends in La Paz (2026)
Peak Season (July, December, November)
- Revenue averages $1,990 per month
- Occupancy rates average 47.2%
- Daily rates average $137
Shoulder Season
- Revenue averages $1,772 per month
- Occupancy maintains around 48.4%
- Daily rates hold near $126
Low Season (January, May, September)
- Revenue drops to average $1,488 per month
- Occupancy decreases to average 39.3%
- Daily rates adjust to average $130
Seasonality Insights for La Paz
- The Airbnb seasonality in La Paz shows moderate seasonality with distinct peak and low periods. While the sections above show seasonal averages, it's also insightful to look at the extremes:
- During the high season, the absolute peak month showcases La Paz's highest earning potential, with monthly revenues capable of climbing to $2,049, occupancy reaching a high of 54.4%, and ADRs peaking at $144.
- Conversely, the slowest single month of the year, typically falling within the low season, marks the market's lowest point. In this month, revenue might dip to $1,395, occupancy could drop to 37.5%, and ADRs may adjust down to $122.
- Understanding both the seasonal averages and these monthly peaks and troughs in revenue, occupancy, and ADR is crucial for maximizing your Airbnb profit potential in La Paz.
Seasonal Strategies for Maximizing Profit
- Peak Season: Maximize revenue through premium pricing and potentially longer minimum stays. Ensure high availability.
- Low Season: Offer competitive pricing, special promotions (e.g., extended stay discounts), and flexible cancellation policies. Target off-season travelers like remote workers or budget-conscious guests.
- Shoulder Seasons: Implement dynamic pricing that balances peak and low rates. Target weekend travelers or specific events. Offer slightly more flexible terms than peak season.
- Regularly analyze your own performance against these La Paz seasonality benchmarks and adjust your pricing and availability strategy accordingly.
Best Areas for Airbnb Investment in La Paz (2026)
Exploring the top neighborhoods for short-term rentals in La Paz? This section highlights key areas, outlining why they are attractive for hosts and guests, along with notable local attractions. Consider these locations based on your target guest profile and investment strategy.
| Neighborhood / Area | Why Host Here? (Target Guests & Appeal) | Key Attractions & Landmarks |
|---|---|---|
| El Centro | The historic center of La Paz, featuring colonial architecture, local markets, and vibrant street life. Attracts tourists wanting to experience the cultural heart of the city. | La Paz Cathedral, Malecón, Cultural Center of La Paz, Plaza Constitución, Baja California Sur Museum |
| La Paz Malecon | A picturesque waterfront promenade lined with restaurants, shops, and art installations. Ideal for guests who enjoy seaside walks and vibrant nightlife. | Malecón Boardwalk, Monumento al Pescador, Los Cabos Sunset Views, Beachfront Restaurants, Art Installations |
| Balandra Beach | Famous for its stunning natural beauty, calm waters, and ideal for outdoor activities. Perfect for families and nature lovers looking for relaxation and adventure. | Balandra Beach, El Caimancito Beach, Snorkeling Tours, Hiking Trails, Kayaking Rentals |
| Costa Baja Resort | A luxury resort area that provides high-end accommodations and amenities. Ideal for attracting affluent travelers looking for a premium experience. | Costa Baja Marina, Beach Clubs, Golf Courses, Spa Services, Fine Dining |
| Ventana Bay | Known for its beautiful views and outdoor activities, attracting nature enthusiasts and those looking for a quieter retreat away from the city. | Ventana Bay Beach, Scuba Diving, Fishing Tours, Cabo Pulmo National Park, Hiking Trails |
| Palacio de Gobierno | Home to several cultural and historical sites, making it an appealing area for tourists interested in heritage and architecture. | Palacio de Gobierno, Cultural Events, Local Artisans, Mexican Cuisine Restaurants, Heritage Walks |
| El Tecolote | A serene beach destination along the coast, popular with visitors looking for relaxation and water sports away from crowded tourist spots. | Tecolote Beach, Water Sports Rentals, Sunset Views, Beachside Cafés, Wildlife Watching |
| Cerro de la Calavera | A hiking area with stunning views of La Paz and the sea, attracting outdoor enthusiasts and adventure seekers. | Hiking Trails, Scenic Lookouts, Wildlife Spotting, Photography Opportunities, Outdoor Fitness Activities |
Understanding Airbnb License Requirements & STR Laws in La Paz (2026)
While La Paz, Baja California Sur, Mexico currently shows low STR regulations, specific Airbnb license requirements might still exist or change. Always verify the latest short term rental regulations and Airbnb license requirements directly with local government authorities for La Paz to ensure full compliance before hosting.
(Source: AirROI data, 2026, based on 0% licensed listings)
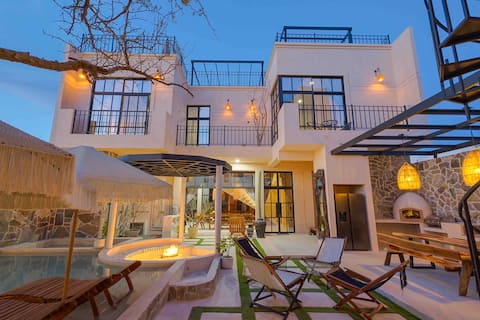
Top Performing Airbnb Properties in La Paz (2026)
Benchmark your potential! Explore examples of top-performing Airbnb properties in La Pazbased on Trailing Twelve Month (TTM) revenue. Analyze their characteristics, revenue, occupancy rate, and ADR to understand what drives success in this market.

10 Bdrm/22 guests Oceanfront Villa with pano views
Entire Place • 10 bedrooms

Villa on the Beach in La Paz
Entire Place • 8 bedrooms

Infinity Pool, Bay Views, BBQ, Walk to Beach
Entire Place • 5 bedrooms
House and apartments p18ppl jacuzzis pool steam
Entire Place • 9 bedrooms

Oceanfront Villa Nautilus with Beach Club Access
Entire Place • 3 bedrooms

Incredible Sunsets, Private Pool and Boardwalk
Entire Place • 4 bedrooms
Note: Performance varies based on location, size, amenities, seasonality, and management quality. Data reflects the past 12 months.
Top Performing Airbnb Hosts in La Paz (2026)
Learn from the best! This table showcases top-performing Airbnb hosts in La Paz based on the number of properties managed and estimated total revenue over the past year. Analyze their scale and performance metrics.
| Host Name | Properties | Grossing Revenue | Stay Reviews | Avg Rating |
|---|---|---|---|---|
| Nauté Hospitality | 28 | $2,132,282 | 1331 | 4.88/5.0 |
| La Paz | 48 | $1,603,574 | 2397 | 4.56/5.0 |
| Ibeth | 20 | $1,041,864 | 867 | 4.93/5.0 |
| Tom | 29 | $650,268 | 1951 | 4.86/5.0 |
| Armando | 33 | $505,053 | 4294 | 4.87/5.0 |
| Inmobiliaria El Cirio | 9 | $482,514 | 1535 | 4.92/5.0 |
| Yoel Leon | 6 | $470,259 | 222 | 4.92/5.0 |
| Rene | 27 | $459,036 | 1422 | 4.73/5.0 |
| Karem Hadad | 7 | $456,953 | 201 | 4.84/5.0 |
| Santa Cruz Suites Proyectos | 22 | $355,350 | 1749 | 4.75/5.0 |
Analyzing the strategies of top hosts, such as their property selection, pricing, and guest communication, can offer valuable lessons for optimizing your own Airbnb operations in La Paz.
Dive Deeper: Advanced La Paz STR Market Data (2026)
Ready to unlock more insights? AirROI provides access to advanced metrics and comprehensive Airbnb data for La Paz. Explore detailed analytics beyond this report to refine your investment strategy, optimize pricing, and maximize your vacation rental profits.
Explore Advanced MetricsLa Paz Short-Term Rental Market Composition (2026): Property & Room Types
Room Type Distribution
Property Type Distribution
Market Composition Insights for La Paz
- The La Paz Airbnb market composition is heavily skewed towards Entire Home/Apt listings, which make up 86.3% of the 1,901 active rentals. This indicates strong guest preference for privacy and space.
- Looking at the property type distribution in La Paz, Apartment/Condo properties are the most common (56.2%), reflecting the local real estate landscape.
- Houses represent a significant 32.5% portion, catering likely to families or larger groups.
- The presence of 6.2% Hotel/Boutique listings indicates integration with traditional hospitality.
- Smaller segments like others, outdoor/unique, unique stays (combined 5.1%) offer potential for unique stay experiences.
La Paz Airbnb Room Capacity Analysis (2026): Bedroom Distribution
Distribution of Listings by Number of Bedrooms
Room Capacity Insights for La Paz
- The dominant room capacity in La Paz is 1 bedroom listings, making up 41.8% of the market. This suggests a strong demand for properties suitable for couples or solo travelers.
- Together, 1 bedroom and 2 bedrooms properties represent 72.6% of the active Airbnb listings in La Paz, indicating a high concentration in these sizes.
La Paz Vacation Rental Guest Capacity Trends (2026)
Distribution of Listings by Guest Capacity
Guest Capacity Insights for La Paz
- The most common guest capacity trend in La Paz vacation rentals is listings accommodating 4 guests (24.6%). This suggests the primary traveler segment is likely small families or groups.
- Properties designed for 4 guests and 2 guests dominate the La Paz STR market, accounting for 48.6% of listings.
- 28.3% of properties accommodate 6+ guests, serving the market segment for larger families or group travel in La Paz.
- On average, properties in La Paz are equipped to host 4.0 guests.
La Paz Airbnb Booking Patterns (2026): Available vs. Booked Days
Available Days Distribution
Booked Days Distribution
Booking Pattern Insights for La Paz
- The most common availability pattern in La Paz falls within the 271-366 days range, representing 40.3% of listings. This suggests many properties have significant open periods on their calendars.
- Approximately 71.3% of listings show high availability (181+ days open annually), indicating potential for increased bookings or specific owner usage patterns.
- For booked days, the 91-180 days range is most frequent in La Paz (31.1%), reflecting common guest stay durations or potential owner blocking patterns.
- A notable 30.0% of properties secure long booking periods (181+ days booked per year), highlighting successful long-term rental strategies or significant owner usage.
La Paz Airbnb Minimum Stay Requirements Analysis
Distribution of Listings by Minimum Night Requirement
1 Night
640 listings
33.7% of total
2 Nights
605 listings
31.8% of total
3 Nights
158 listings
8.3% of total
4-6 Nights
30 listings
1.6% of total
7-29 Nights
18 listings
0.9% of total
30+ Nights
450 listings
23.7% of total
Key Insights
- The most prevalent minimum stay requirement in La Paz is 1 Night, adopted by 33.7% of listings. This highlights the market's preference for shorter, flexible bookings.
- A strong majority (65.5%) of the La Paz Airbnb data shows acceptance of very short stays (1-2 nights), indicating a dynamic, high-turnover market.
- A significant segment (23.7%) caters to monthly stays (30+ nights) in La Paz, pointing to opportunities in the extended-stay market.
Recommendations
- Align with the market by considering a 1 Night minimum stay, as 33.7% of La Paz hosts use this setting.
- Explore offering discounts for stays of 30+ nights to attract the 23.7% of the market seeking extended stays.
- Adjust minimum nights based on seasonality – potentially shorter during low season and longer during peak demand periods in La Paz.
La Paz Airbnb Cancellation Policy Trends Analysis (2026)
Limited
30 listings
1.6% of total
Super Strict 30 Days
34 listings
1.8% of total
Super Strict 60 Days
9 listings
0.5% of total
Flexible
531 listings
28% of total
Moderate
555 listings
29.2% of total
Firm
571 listings
30.1% of total
Strict
168 listings
8.9% of total
Cancellation Policy Insights for La Paz
- The prevailing Airbnb cancellation policy trend in La Paz is Firm, used by 30.1% of listings.
- There's a relatively balanced mix between guest-friendly (57.2%) and stricter (39.0%) policies, offering choices for different guest needs.
- Strict cancellation policies are quite rare (8.9%), potentially making listings with this policy less competitive unless justified by high demand or property type.
Recommendations for Hosts
- Consider adopting a Firm policy to align with the 30.1% market standard in La Paz.
- Using a Strict policy might deter some guests, as only 8.9% of listings use it. Evaluate if potential revenue protection outweighs possible lower booking rates.
- Regularly review your cancellation policy against competitors and market demand shifts in La Paz.
La Paz STR Booking Lead Time Analysis (2026)
Average Booking Lead Time by Month
Booking Lead Time Insights for La Paz
- The overall average booking lead time for vacation rentals in La Paz is 33 days.
- Guests book furthest in advance for stays during December (average 47 days), likely coinciding with peak travel demand or local events.
- The shortest booking windows occur for stays in June (average 26 days), indicating more last-minute travel plans during this time.
- Seasonally, Winter (39 days avg.) sees the longest lead times, while Summer (28 days avg.) has the shortest, reflecting typical travel planning cycles.
Recommendations for Hosts
- Use the overall average lead time (33 days) as a baseline for your pricing and availability strategy in La Paz.
- For December stays, consider implementing length-of-stay discounts or slightly higher rates for bookings made less than 47 days out to capitalize on advance planning.
- Target marketing efforts for the Winter season well in advance (at least 39 days) to capture early planners.
- Monitor your own booking lead times against these La Paz averages to identify opportunities for dynamic pricing adjustments.
Popular & Essential Airbnb Amenities in La Paz (2026)
Amenity Prevalence
Amenity Insights for La Paz
- Essential amenities in La Paz that guests expect include: Wifi, Air conditioning. Lacking these (any) could significantly impact bookings.
- Popular amenities like TV, Hot water, Kitchen are common but not universal. Offering these can provide a competitive edge.
Recommendations for Hosts
- Ensure your listing includes all essential amenities for La Paz: Wifi, Air conditioning.
- Prioritize adding missing essentials: Wifi, Air conditioning.
- Consider adding popular differentiators like TV or Hot water to increase appeal.
- Highlight unique or less common amenities you offer (e.g., hot tub, dedicated workspace, EV charger) in your listing description and photos.
- Regularly check competitor amenities in La Paz to stay competitive.
La Paz Airbnb Guest Demographics & Profile Analysis (2026)
Guest Profile Summary for La Paz
- The typical guest profile for Airbnb in La Paz consists of a mix of domestic (62%) and international guests, often arriving from nearby Mexico City, typically belonging to the Post-2000s (Gen Z/Alpha) group (50%), primarily speaking Spanish or English.
- Domestic travelers account for 62.1% of guests.
- Key international markets include Mexico (62.1%) and United States (26.4%).
- Top languages spoken are Spanish (46.2%) followed by English (40.8%).
- A significant demographic segment is the Post-2000s (Gen Z/Alpha) group, representing 50% of guests.
Recommendations for Hosts
- Target domestic marketing efforts towards travelers from Mexico City and Cabo San Lucas.
- Tailor amenities and listing descriptions to appeal to the dominant Post-2000s (Gen Z/Alpha) demographic (e.g., highlight fast WiFi, smart home features, local guides).
- Highlight unique local experiences or amenities relevant to the primary guest profile.
- Consider seasonal promotions aligned with peak travel times for key origin markets.
Nearby Short-Term Rental Market Comparison
How does the La Paz Airbnb market stack up against its neighbors? Compare key performance metrics like average monthly revenue, ADR, and occupancy rates in surrounding areas to understand the broader regional STR landscape.
| Market | Active Properties | Monthly Revenue | Daily Rate | Avg. Occupancy |
|---|---|---|---|---|
| Cabo Frailes | 13 | $3,598 | $678.93 | 30% |
| La Ribera | 37 | $3,328 | $488.20 | 33% |
| Ensenada Blanca | 10 | $2,504 | $421.48 | 28% |
| San José del Cabo | 1,249 | $2,428 | $384.50 | 34% |
| Los Cerritos | 44 | $2,061 | $277.09 | 32% |
| Todos Santos | 460 | $1,988 | $271.64 | 34% |
| Baja California Sur | 38 | $1,944 | $346.99 | 27% |
| La Palmilla | 24 | $1,910 | $362.27 | 30% |
| La Boca de la Palma | 20 | $1,731 | $240.57 | 29% |
| Los Barriles | 172 | $1,663 | $256.08 | 35% |