Chametla Airbnb Market Analysis 2026: Short Term Rental Data & Vacation Rental Statistics in Baja California Sur, Mexico
Is Airbnb profitable in Chametla in 2026? Explore comprehensive Airbnb analytics for Chametla, Baja California Sur, Mexico to uncover income potential. This 2026 STR market report for Chametla, based on AirROI data from February 2025 to January 2026, reveals key trends in the niche market of 28 active listings.
Whether you're considering an Airbnb investment in Chametla, optimizing your existing vacation rental, or exploring rental arbitrage opportunities, understanding the Chametla Airbnb data is crucial. Leveraging the low regulation environment is key to maximizing your short term rental income potential. Let's dive into the specifics.
Key Chametla Airbnb Performance Metrics Overview
Monthly Airbnb Revenue Variations & Income Potential in Chametla (2026)
Understanding the monthly revenue variations for Airbnb listings in Chametla is key to maximizing your short term rental income potential. Seasonality significantly impacts earnings. Our analysis, based on data from the past 12 months, shows that the peak revenue month for STRs in Chametla is typically July, while January often presents the lowest earnings, highlighting opportunities for strategic pricing adjustments during shoulder and low seasons. Explore the typical Airbnb income in Chametla across different performance tiers:
- Best-in-class properties (Top 10%) achieve $2,308+ monthly, often utilizing dynamic pricing and superior guest experiences.
- Strong performing properties (Top 25%) earn $1,824 or more, indicating effective management and desirable locations/amenities.
- Typical properties (Median) generate around $1,238 per month, representing the average market performance.
- Entry-level properties (Bottom 25%) see earnings around $665, often with potential for optimization.
Average Monthly Airbnb Earnings Trend in Chametla
Chametla Airbnb Occupancy Rate Trends (2026)
Maximize your bookings by understanding the Chametla STR occupancy trends. Seasonal demand shifts significantly influence how often properties are booked. Typically, Julysees the highest demand (peak season occupancy), while January experiences the lowest (low season). Effective strategies, like adjusting minimum stays or offering promotions, can boost occupancy during slower periods. Here's how different property tiers perform in Chametla:
- Best-in-class properties (Top 10%) achieve 86%+ occupancy, indicating high desirability and potentially optimized availability.
- Strong performing properties (Top 25%) maintain 69% or higher occupancy, suggesting good market fit and guest satisfaction.
- Typical properties (Median) have an occupancy rate around 45%.
- Entry-level properties (Bottom 25%) average 27% occupancy, potentially facing higher vacancy.
Average Monthly Occupancy Rate Trend in Chametla
Average Daily Rate (ADR) Airbnb Trends in Chametla (2026)
Effective short term rental pricing strategy in Chametla involves understanding monthly ADR fluctuations. The Average Daily Rate (ADR) for Airbnb in Chametla typically peaks in December and dips lowest during March. Leveraging Airbnb dynamic pricing tools or strategies based on this seasonality can significantly boost revenue. Here's a look at the typical nightly rates achieved:
- Best-in-class properties (Top 10%) command rates of $150+ per night, often due to premium features or locations.
- Strong performing properties (Top 25%) achieve nightly rates of $104 or more.
- Typical properties (Median) charge around $79 per night.
- Entry-level properties (Bottom 25%) earn around $66 per night.
Average Daily Rate (ADR) Trend by Month in Chametla
Get Live Chametla Market Intelligence 👇

Explore Real-time Analytics
Airbnb Seasonality Analysis & Trends in Chametla (2026)
Peak Season (July, June, August)
- Revenue averages $1,725 per month
- Occupancy rates average 57.0%
- Daily rates average $99
Shoulder Season
- Revenue averages $1,284 per month
- Occupancy maintains around 46.5%
- Daily rates hold near $98
Low Season (January, February, March)
- Revenue drops to average $1,115 per month
- Occupancy decreases to average 44.7%
- Daily rates adjust to average $93
Seasonality Insights for Chametla
- The Airbnb seasonality in Chametla shows moderate seasonality with distinct peak and low periods. While the sections above show seasonal averages, it's also insightful to look at the extremes:
- During the high season, the absolute peak month showcases Chametla's highest earning potential, with monthly revenues capable of climbing to $1,960, occupancy reaching a high of 61.7%, and ADRs peaking at $105.
- Conversely, the slowest single month of the year, typically falling within the low season, marks the market's lowest point. In this month, revenue might dip to $1,038, occupancy could drop to 34.0%, and ADRs may adjust down to $87.
- Understanding both the seasonal averages and these monthly peaks and troughs in revenue, occupancy, and ADR is crucial for maximizing your Airbnb profit potential in Chametla.
Seasonal Strategies for Maximizing Profit
- Peak Season: Maximize revenue through premium pricing and potentially longer minimum stays. Ensure high availability.
- Low Season: Offer competitive pricing, special promotions (e.g., extended stay discounts), and flexible cancellation policies. Target off-season travelers like remote workers or budget-conscious guests.
- Shoulder Seasons: Implement dynamic pricing that balances peak and low rates. Target weekend travelers or specific events. Offer slightly more flexible terms than peak season.
- Regularly analyze your own performance against these Chametla seasonality benchmarks and adjust your pricing and availability strategy accordingly.
Best Areas for Airbnb Investment in Chametla (2026)
Exploring the top neighborhoods for short-term rentals in Chametla? This section highlights key areas, outlining why they are attractive for hosts and guests, along with notable local attractions. Consider these locations based on your target guest profile and investment strategy.
| Neighborhood / Area | Why Host Here? (Target Guests & Appeal) | Key Attractions & Landmarks |
|---|---|---|
| Playa de Chametla | Beautiful beach area known for its tranquil waters and stunning sunsets. Ideal for families and beach lovers seeking relaxation and outdoor activities. | Chametla Beach, Water sports activities, Local seafood restaurants, Beachfront promenades, Sunset views |
| Centro de Chametla | The main urban center offering local culture, shops, and amenities. Great for travelers looking to experience authentic Baja California Sur lifestyle while being close to attractions. | Local markets, Chametla Church, Artisan shops, Cafes and eateries, Cultural festivals |
| Cabo San Lucas | Famous tourist destination known for its lively nightlife and beautiful beaches. Offers a variety of activities, from water sports to nightlife, attracting a diverse crowd. | Land's End, Cabo Marina, Medano Beach, Nightclubs and bars, Whale watching tours |
| San José del Cabo | Charming town known for its art scene and historic architecture. Perfect for those looking for a quieter experience while remaining close to Cabo San Lucas. | San José del Cabo Art Walk, Hotel Zone, Estuary and Bird Sanctuary, Botanical Garden, Historic Mission of San José |
| Todos Santos | Pueblo Mágico with a vibrant arts community and beautiful beaches. Suitable for travelers seeking culture, art, and natural beauty. | La Pastora Beach, Todos Santos Plaza, Art galleries, Surfer's paradise, Cultural events |
| La Paz | Capital of Baja California Sur, offering beautiful waterfront views and rich culture. Attracts those interested in exploring the natural wonders of the Sea of Cortez. | Malecon, Balandra Beach, Espiritu Santo Island, Cultural center of La Paz, Sea kayaking |
| Santiago | A small charming village with access to nature, hiking, and local experiences. Great for those wanting a retreat into the nature of Baja. | Cascadas de Santiago, Local farms, Hiking trails, Traditional food experiences, Community festivities |
| El Pescadero | Known for its surf spots and eco-tourism. A peaceful area that appeals to those looking for wellness retreats and surfing experiences. | La Costa Beach, Surfing spots, Organic farms, Eco-lodges, Whale watching |
Understanding Airbnb License Requirements & STR Laws in Chametla (2026)
While Chametla, Baja California Sur, Mexico currently shows low STR regulations, specific Airbnb license requirements might still exist or change. Always verify the latest short term rental regulations and Airbnb license requirements directly with local government authorities for Chametla to ensure full compliance before hosting.
(Source: AirROI data, 2026, finding no licensed listings among those analyzed)
Top Performing Airbnb Properties in Chametla (2026)
Benchmark your potential! Explore examples of top-performing Airbnb properties in Chametlabased on Trailing Twelve Month (TTM) revenue. Analyze their characteristics, revenue, occupancy rate, and ADR to understand what drives success in this market.
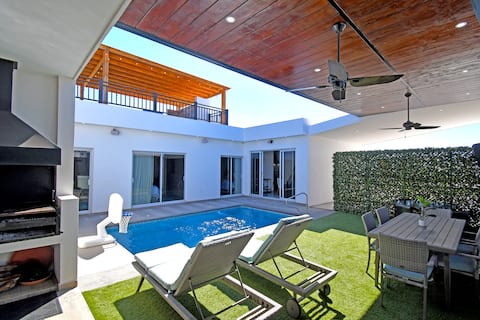
One story home w/pool, bbq &view
Entire Place • 3 bedrooms

House for rest or vacation
Entire Place • 5 bedrooms

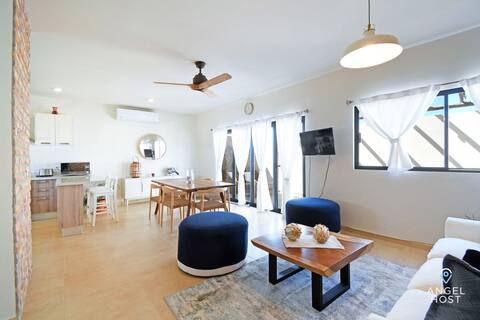
Angel´s House
Entire Place • 2 bedrooms

Welcome to Casa Luna! Home in La Paz, BCS.
Entire Place • 3 bedrooms
Stylish Townhome Private Patio Parking Pool Onsite
Entire Place • 3 bedrooms

Casa México
Entire Place • 3 bedrooms
Note: Performance varies based on location, size, amenities, seasonality, and management quality. Data reflects the past 12 months.
Top Performing Airbnb Hosts in Chametla (2026)
Learn from the best! This table showcases top-performing Airbnb hosts in Chametla based on the number of properties managed and estimated total revenue over the past year. Analyze their scale and performance metrics.
| Host Name | Properties | Grossing Revenue | Stay Reviews | Avg Rating |
|---|---|---|---|---|
| La Paz | 3 | $49,032 | 85 | 4.39/5.0 |
| La Paz Bay | 1 | $41,267 | 24 | 4.92/5.0 |
| Sandra | 1 | $21,972 | 16 | 5.00/5.0 |
| Angel Aaron | 1 | $21,521 | 84 | 4.95/5.0 |
| America | 1 | $21,238 | 22 | 4.86/5.0 |
| Yuriria | 1 | $19,310 | 80 | 4.65/5.0 |
| Andy | 1 | $19,277 | 29 | 5.00/5.0 |
| Jessica | 1 | $18,636 | 75 | 4.87/5.0 |
| Glenn | 1 | $17,745 | 37 | 4.76/5.0 |
| Luis | 1 | $17,255 | 68 | 4.78/5.0 |
Analyzing the strategies of top hosts, such as their property selection, pricing, and guest communication, can offer valuable lessons for optimizing your own Airbnb operations in Chametla.
Dive Deeper: Advanced Chametla STR Market Data (2026)
Ready to unlock more insights? AirROI provides access to advanced metrics and comprehensive Airbnb data for Chametla. Explore detailed analytics beyond this report to refine your investment strategy, optimize pricing, and maximize your vacation rental profits.
Explore Advanced MetricsChametla Short-Term Rental Market Composition (2026): Property & Room Types
Room Type Distribution
Property Type Distribution
Market Composition Insights for Chametla
- The Chametla Airbnb market composition is heavily skewed towards Entire Home/Apt listings, which make up 100% of the 28 active rentals. This indicates strong guest preference for privacy and space.
- Looking at the property type distribution in Chametla, House properties are the most common (92.9%), reflecting the local real estate landscape.
- Houses represent a significant 92.9% portion, catering likely to families or larger groups.
- Smaller segments like hotel/boutique, apartment/condo (combined 7.2%) offer potential for unique stay experiences.
Chametla Airbnb Room Capacity Analysis (2026): Bedroom Distribution
Distribution of Listings by Number of Bedrooms
Room Capacity Insights for Chametla
- The dominant room capacity in Chametla is 3 bedrooms listings, making up 57.1% of the market. This suggests a strong demand for properties suitable for families or small groups.
- Together, 3 bedrooms and 2 bedrooms properties represent 92.8% of the active Airbnb listings in Chametla, indicating a high concentration in these sizes.
- A significant 60.7% of listings offer 3+ bedrooms, catering to larger groups and families seeking more space in Chametla.
Chametla Vacation Rental Guest Capacity Trends (2026)
Distribution of Listings by Guest Capacity
Guest Capacity Insights for Chametla
- The most common guest capacity trend in Chametla vacation rentals is listings accommodating 6 guests (50%). This suggests the primary traveler segment is likely larger groups.
- Properties designed for 6 guests and 4 guests dominate the Chametla STR market, accounting for 71.4% of listings.
- 71.4% of properties accommodate 6+ guests, serving the market segment for larger families or group travel in Chametla.
- On average, properties in Chametla are equipped to host 5.8 guests.
Chametla Airbnb Booking Patterns (2026): Available vs. Booked Days
Available Days Distribution
Booked Days Distribution
Booking Pattern Insights for Chametla
- The most common availability pattern in Chametla falls within the 91-180 days range, representing 35.7% of listings. This suggests many properties have significant open periods on their calendars.
- Approximately 60.7% of listings show high availability (181+ days open annually), indicating potential for increased bookings or specific owner usage patterns.
- For booked days, the 181-270 days range is most frequent in Chametla (35.7%), reflecting common guest stay durations or potential owner blocking patterns.
- A notable 39.3% of properties secure long booking periods (181+ days booked per year), highlighting successful long-term rental strategies or significant owner usage.
Chametla Airbnb Minimum Stay Requirements Analysis
Distribution of Listings by Minimum Night Requirement
1 Night
6 listings
21.4% of total
2 Nights
12 listings
42.9% of total
3 Nights
2 listings
7.1% of total
30+ Nights
8 listings
28.6% of total
Key Insights
- The most prevalent minimum stay requirement in Chametla is 2 Nights, adopted by 42.9% of listings. This highlights the market's preference for shorter, flexible bookings.
- A strong majority (64.3%) of the Chametla Airbnb data shows acceptance of very short stays (1-2 nights), indicating a dynamic, high-turnover market.
- A significant segment (28.6%) caters to monthly stays (30+ nights) in Chametla, pointing to opportunities in the extended-stay market.
Recommendations
- Align with the market by considering a 2 Nights minimum stay, as 42.9% of Chametla hosts use this setting.
- If feasible, allowing 1-night stays, especially midweek or during low season, could capture last-minute bookings, as only 21.4% currently do.
- Explore offering discounts for stays of 30+ nights to attract the 28.6% of the market seeking extended stays.
- Adjust minimum nights based on seasonality – potentially shorter during low season and longer during peak demand periods in Chametla.
Chametla Airbnb Cancellation Policy Trends Analysis (2026)
Super Strict 30 Days
1 listings
3.6% of total
Flexible
6 listings
21.4% of total
Moderate
11 listings
39.3% of total
Firm
10 listings
35.7% of total
Cancellation Policy Insights for Chametla
- The prevailing Airbnb cancellation policy trend in Chametla is Moderate, used by 39.3% of listings.
- There's a relatively balanced mix between guest-friendly (60.7%) and stricter (35.7%) policies, offering choices for different guest needs.
Recommendations for Hosts
- Consider adopting a Moderate policy to align with the 39.3% market standard in Chametla.
- Regularly review your cancellation policy against competitors and market demand shifts in Chametla.
Chametla STR Booking Lead Time Analysis (2026)
Average Booking Lead Time by Month
Booking Lead Time Insights for Chametla
- The overall average booking lead time for vacation rentals in Chametla is 31 days.
- Guests book furthest in advance for stays during December (average 60 days), likely coinciding with peak travel demand or local events.
- The shortest booking windows occur for stays in March (average 16 days), indicating more last-minute travel plans during this time.
- Seasonally, Winter (44 days avg.) sees the longest lead times, while Spring (25 days avg.) has the shortest, reflecting typical travel planning cycles.
Recommendations for Hosts
- Use the overall average lead time (31 days) as a baseline for your pricing and availability strategy in Chametla.
- For December stays, consider implementing length-of-stay discounts or slightly higher rates for bookings made less than 60 days out to capitalize on advance planning.
- Target marketing efforts for the Winter season well in advance (at least 44 days) to capture early planners.
- Monitor your own booking lead times against these Chametla averages to identify opportunities for dynamic pricing adjustments.
Popular & Essential Airbnb Amenities in Chametla (2026)
Amenity Prevalence
Amenity Insights for Chametla
- Essential amenities in Chametla that guests expect include: Wifi, Kitchen, Air conditioning, TV, Refrigerator. Lacking these (any) could significantly impact bookings.
- Popular amenities like Free parking on premises, Hot water, Cooking basics are common but not universal. Offering these can provide a competitive edge.
Recommendations for Hosts
- Ensure your listing includes all essential amenities for Chametla: Wifi, Kitchen, Air conditioning, TV, Refrigerator.
- Prioritize adding missing essentials: Refrigerator.
- Consider adding popular differentiators like Free parking on premises or Hot water to increase appeal.
- Highlight unique or less common amenities you offer (e.g., hot tub, dedicated workspace, EV charger) in your listing description and photos.
- Regularly check competitor amenities in Chametla to stay competitive.
Chametla Airbnb Guest Demographics & Profile Analysis (2026)
Guest Profile Summary for Chametla
- The typical guest profile for Airbnb in Chametla consists of primarily domestic travelers (80%), often arriving from nearby Mexico City, typically belonging to the Post-2000s (Gen Z/Alpha) group (50%), primarily speaking Spanish or English.
- Domestic travelers account for 80.0% of guests.
- Key international markets include Mexico (80%) and United States (13.8%).
- Top languages spoken are Spanish (50.3%) followed by English (38%).
- A significant demographic segment is the Post-2000s (Gen Z/Alpha) group, representing 50% of guests.
Recommendations for Hosts
- Target domestic marketing efforts towards travelers from Mexico City and Tijuana.
- Tailor amenities and listing descriptions to appeal to the dominant Post-2000s (Gen Z/Alpha) demographic (e.g., highlight fast WiFi, smart home features, local guides).
- Highlight unique local experiences or amenities relevant to the primary guest profile.
- Consider seasonal promotions aligned with peak travel times for key origin markets.
Nearby Short-Term Rental Market Comparison
How does the Chametla Airbnb market stack up against its neighbors? Compare key performance metrics like average monthly revenue, ADR, and occupancy rates in surrounding areas to understand the broader regional STR landscape.
| Market | Active Properties | Monthly Revenue | Daily Rate | Avg. Occupancy |
|---|---|---|---|---|
| Cabo Frailes | 13 | $3,598 | $678.93 | 30% |
| La Ribera | 37 | $3,328 | $488.20 | 33% |
| Ensenada Blanca | 10 | $2,504 | $421.48 | 28% |
| San José del Cabo | 1,249 | $2,428 | $384.50 | 34% |
| Los Cerritos | 44 | $2,061 | $277.09 | 32% |
| Todos Santos | 460 | $1,988 | $271.64 | 34% |
| Baja California Sur | 38 | $1,944 | $346.99 | 27% |
| La Palmilla | 24 | $1,910 | $362.27 | 30% |
| La Boca de la Palma | 20 | $1,731 | $240.57 | 29% |
| Los Barriles | 172 | $1,663 | $256.08 | 35% |