Kōfu Airbnb Market Analysis 2026: Short Term Rental Data & Vacation Rental Statistics in Yamanashi Prefecture, Japan
Is Airbnb profitable in Kōfu in 2026? Explore comprehensive Airbnb analytics for Kōfu, Yamanashi Prefecture, Japan to uncover income potential. This 2026 STR market report for Kōfu, based on AirROI data from February 2025 to January 2026, reveals key trends in the niche market of 26 active listings.
Whether you're considering an Airbnb investment in Kōfu, optimizing your existing vacation rental, or exploring rental arbitrage opportunities, understanding the Kōfu Airbnb data is crucial. Navigating the high regulation landscape is key to maximizing your short term rental income potential. Let's dive into the specifics.
Key Kōfu Airbnb Performance Metrics Overview
Monthly Airbnb Revenue Variations & Income Potential in Kōfu (2026)
Understanding the monthly revenue variations for Airbnb listings in Kōfu is key to maximizing your short term rental income potential. Seasonality significantly impacts earnings. Our analysis, based on data from the past 12 months, shows that the peak revenue month for STRs in Kōfu is typically August, while February often presents the lowest earnings, highlighting opportunities for strategic pricing adjustments during shoulder and low seasons. Explore the typical Airbnb income in Kōfu across different performance tiers:
- Best-in-class properties (Top 10%) achieve $2,835+ monthly, often utilizing dynamic pricing and superior guest experiences.
- Strong performing properties (Top 25%) earn $1,614 or more, indicating effective management and desirable locations/amenities.
- Typical properties (Median) generate around $839 per month, representing the average market performance.
- Entry-level properties (Bottom 25%) see earnings around $437, often with potential for optimization.
Average Monthly Airbnb Earnings Trend in Kōfu
Kōfu Airbnb Occupancy Rate Trends (2026)
Maximize your bookings by understanding the Kōfu STR occupancy trends. Seasonal demand shifts significantly influence how often properties are booked. Typically, Augustsees the highest demand (peak season occupancy), while January experiences the lowest (low season). Effective strategies, like adjusting minimum stays or offering promotions, can boost occupancy during slower periods. Here's how different property tiers perform in Kōfu:
- Best-in-class properties (Top 10%) achieve 79%+ occupancy, indicating high desirability and potentially optimized availability.
- Strong performing properties (Top 25%) maintain 57% or higher occupancy, suggesting good market fit and guest satisfaction.
- Typical properties (Median) have an occupancy rate around 43%.
- Entry-level properties (Bottom 25%) average 22% occupancy, potentially facing higher vacancy.
Average Monthly Occupancy Rate Trend in Kōfu
Average Daily Rate (ADR) Airbnb Trends in Kōfu (2026)
Effective short term rental pricing strategy in Kōfu involves understanding monthly ADR fluctuations. The Average Daily Rate (ADR) for Airbnb in Kōfu typically peaks in January and dips lowest during February. Leveraging Airbnb dynamic pricing tools or strategies based on this seasonality can significantly boost revenue. Here's a look at the typical nightly rates achieved:
- Best-in-class properties (Top 10%) command rates of $159+ per night, often due to premium features or locations.
- Strong performing properties (Top 25%) achieve nightly rates of $111 or more.
- Typical properties (Median) charge around $60 per night.
- Entry-level properties (Bottom 25%) earn around $43 per night.
Average Daily Rate (ADR) Trend by Month in Kōfu
Get Live Kōfu Market Intelligence 👇

Explore Real-time Analytics
Airbnb Seasonality Analysis & Trends in Kōfu (2026)
Peak Season (August, October, September)
- Revenue averages $1,616 per month
- Occupancy rates average 51.6%
- Daily rates average $84
Shoulder Season
- Revenue averages $1,180 per month
- Occupancy maintains around 44.5%
- Daily rates hold near $80
Low Season (January, February, December)
- Revenue drops to average $897 per month
- Occupancy decreases to average 31.7%
- Daily rates adjust to average $82
Seasonality Insights for Kōfu
- The Airbnb seasonality in Kōfu shows highly seasonal trends requiring careful strategy. While the sections above show seasonal averages, it's also insightful to look at the extremes:
- During the high season, the absolute peak month showcases Kōfu's highest earning potential, with monthly revenues capable of climbing to $1,895, occupancy reaching a high of 64.7%, and ADRs peaking at $87.
- Conversely, the slowest single month of the year, typically falling within the low season, marks the market's lowest point. In this month, revenue might dip to $813, occupancy could drop to 28.2%, and ADRs may adjust down to $74.
- Understanding both the seasonal averages and these monthly peaks and troughs in revenue, occupancy, and ADR is crucial for maximizing your Airbnb profit potential in Kōfu.
Seasonal Strategies for Maximizing Profit
- Peak Season: Maximize revenue through premium pricing and potentially longer minimum stays. Ensure high availability.
- Low Season: Offer competitive pricing, special promotions (e.g., extended stay discounts), and flexible cancellation policies. Target off-season travelers like remote workers or budget-conscious guests.
- Shoulder Seasons: Implement dynamic pricing that balances peak and low rates. Target weekend travelers or specific events. Offer slightly more flexible terms than peak season.
- Regularly analyze your own performance against these Kōfu seasonality benchmarks and adjust your pricing and availability strategy accordingly.
Best Areas for Airbnb Investment in Kōfu (2026)
Exploring the top neighborhoods for short-term rentals in Kōfu? This section highlights key areas, outlining why they are attractive for hosts and guests, along with notable local attractions. Consider these locations based on your target guest profile and investment strategy.
| Neighborhood / Area | Why Host Here? (Target Guests & Appeal) | Key Attractions & Landmarks |
|---|---|---|
| Kōfu City Center | The vibrant heart of Kōfu, with shopping, dining, and cultural attractions. Ideal for travelers looking to explore the local culture and convenience. | Kōfu Castle, Yamanashi Prefectural Museum of Art, Kōfu Kizuna Park, Buddhist Temple Zensho-ji, Amidaji Temple |
| Isawa Onsen | Famous hot spring area that offers relaxation and wellness opportunities, attracting tourists looking for a getaway experience. | Isawa Onsen hot springs, Mizuki Park, Yamanashi Prefectural Museum, Hōun-jinja Shrine, Local sake breweries |
| Shosenkyo Gorge | A stunning natural landscape that attracts outdoor enthusiasts and tourists looking to experience nature and scenic views. | Shosenkyo Gorge, Shosenkyo Ropeway, Bunji Bridge, Hiking trails, Rock climbing spots |
| Tenjozan Park | A beautiful park with panoramic views of Kōfu and surrounding mountains, popular for sightseeing and picnics. | Tenjozan Park, Views of Kōfu and Mt. Fuji, Hiking trails, Scenic viewpoints, Historical markers |
| Yamanashi Wine Region (Kōfu Area) | Known for Wineries and vineyards, attracts wine enthusiasts looking to explore local wine culture and tastings. | Château Mercian winery, Sadoya Winery, Katsunuma Winery, Wine tasting tours, Local wine festivals |
| Tachikawa Park | A family-friendly area with recreational facilities, perfect for families and tourists looking for outdoor activities. | Tachikawa Park, Playgrounds, Picnic areas, Walking paths, Sports facilities |
| Nakagomi Fruit Orchard | A popular spot for fruit picking, especially in the summer and fall seasons, attracting families and tourists. | Fruit picking activities, Scenic orchards, Local fruit markets, Workshops on fruit cultivation |
| KōfuNight Market | A lively market area that comes alive in the evenings with food stalls and local crafts, ideal for a unique cultural experience. | Local food stands, Craft vendors, Cultural performances, Nightlife atmosphere, Artisan showcases |
Understanding Airbnb License Requirements & STR Laws in Kōfu (2026)
Yes, Kōfu, Yamanashi Prefecture, Japan enforces high STR regulations. Obtaining a license and ensuring compliance is almost certainly required according to current 2026 STR laws. Always verify the latest short term rental regulations and Airbnb license requirements directly with local government authorities for Kōfu to ensure full compliance before hosting.
(Source: AirROI data, 2026, based on 100% licensed listings)
Top Performing Airbnb Properties in Kōfu (2026)
Benchmark your potential! Explore examples of top-performing Airbnb properties in Kōfubased on Trailing Twelve Month (TTM) revenue. Analyze their characteristics, revenue, occupancy rate, and ADR to understand what drives success in this market.
![Kofu city. Ebisuya [Whole house]](https://a0.muscache.com/im/pictures/hosting/Hosting-39953607/original/fee2ffed-b7fd-4617-820f-c563946e431a.jpeg?im_w=480&im_format=avif)
Kofu city. Ebisuya [Whole house]
Entire Place • 2 bedrooms

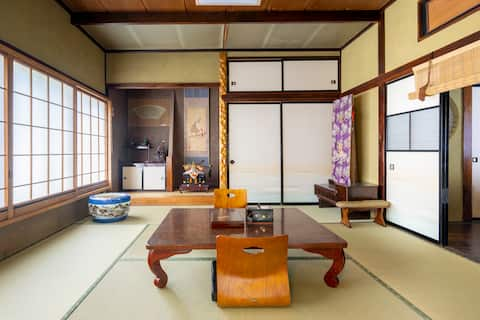
畳の居間に寝転んでくつろぐ。110㎡貸切一軒家*おばあちゃん家のような懐かしさ*8人+添い寝OK
Entire Place • 3 bedrooms
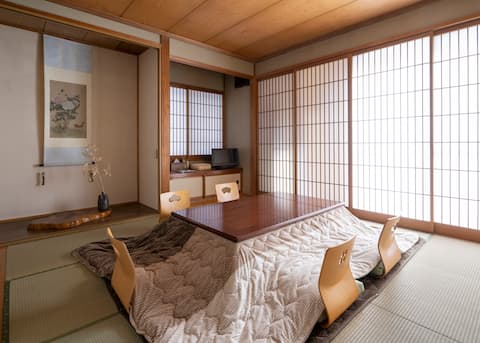
"Takara-no-Kosuku" is a traditional Japanese house built 60 years ago, where you can also have a far
Entire Place • 3 bedrooms
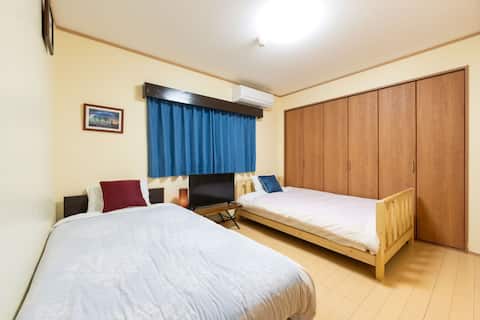
10-minute walk from JR Kofu Station, Convenient for transportation, 72 ㎡, private, max 10 people
Entire Place • 1 bedroom
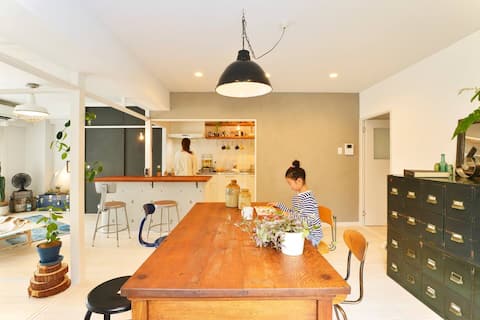
Kamishitada-no-Ouchi is a Japanese-style house that is a great value for consecutive nights and offe
Entire Place • 2 bedrooms
Condominium 201 /Kofu
Entire Place • 1 bedroom
Note: Performance varies based on location, size, amenities, seasonality, and management quality. Data reflects the past 12 months.
Top Performing Airbnb Hosts in Kōfu (2026)
Learn from the best! This table showcases top-performing Airbnb hosts in Kōfu based on the number of properties managed and estimated total revenue over the past year. Analyze their scale and performance metrics.
| Host Name | Properties | Grossing Revenue | Stay Reviews | Avg Rating |
|---|---|---|---|---|
| VivitBase | 3 | $59,088 | 170 | 4.74/5.0 |
| Takashi | 2 | $56,477 | 125 | 4.88/5.0 |
| 甲府 | 2 | $46,602 | 23 | 4.67/5.0 |
| Tomomi | 2 | $39,281 | 162 | 4.92/5.0 |
| Junko | 1 | $34,876 | 57 | 4.98/5.0 |
| 舞 | 1 | $20,318 | 71 | 4.86/5.0 |
| Nap | 2 | $18,894 | 353 | 4.83/5.0 |
| Mika | 3 | $16,612 | 116 | 4.51/5.0 |
| 渡辺 | 2 | $13,990 | 240 | 4.80/5.0 |
| Haruhi | 1 | $13,406 | 402 | 4.85/5.0 |
Analyzing the strategies of top hosts, such as their property selection, pricing, and guest communication, can offer valuable lessons for optimizing your own Airbnb operations in Kōfu.
Dive Deeper: Advanced Kōfu STR Market Data (2026)
Ready to unlock more insights? AirROI provides access to advanced metrics and comprehensive Airbnb data for Kōfu. Explore detailed analytics beyond this report to refine your investment strategy, optimize pricing, and maximize your vacation rental profits.
Explore Advanced MetricsKōfu Short-Term Rental Market Composition (2026): Property & Room Types
Room Type Distribution
Property Type Distribution
Market Composition Insights for Kōfu
- The Kōfu Airbnb market composition is heavily skewed towards Private Room listings, which make up 57.7% of the 26 active rentals. This indicates strong guest preference for privacy and space.
- Looking at the property type distribution in Kōfu, House properties are the most common (57.7%), reflecting the local real estate landscape.
- Houses represent a significant 57.7% portion, catering likely to families or larger groups.
- The presence of 15.4% Hotel/Boutique listings indicates integration with traditional hospitality.
- Smaller segments like others (combined 3.8%) offer potential for unique stay experiences.
Kōfu Airbnb Room Capacity Analysis (2026): Bedroom Distribution
Distribution of Listings by Number of Bedrooms
Room Capacity Insights for Kōfu
- The dominant room capacity in Kōfu is 1 bedroom listings, making up 38.5% of the market. This suggests a strong demand for properties suitable for couples or solo travelers.
- Together, 1 bedroom and 2 bedrooms properties represent 61.6% of the active Airbnb listings in Kōfu, indicating a high concentration in these sizes.
- Listings with 3+ bedrooms (7.7%) represent a smaller niche, potentially indicating an underserved market for larger group accommodations in Kōfu.
Kōfu Vacation Rental Guest Capacity Trends (2026)
Distribution of Listings by Guest Capacity
Guest Capacity Insights for Kōfu
- The most common guest capacity trend in Kōfu vacation rentals is listings accommodating 8+ guests (15.4%). This suggests the primary traveler segment is likely larger groups.
- Properties designed for 8+ guests and 2 guests dominate the Kōfu STR market, accounting for 26.9% of listings.
- 26.9% of properties accommodate 6+ guests, serving the market segment for larger families or group travel in Kōfu.
- On average, properties in Kōfu are equipped to host 3.1 guests.
Kōfu Airbnb Booking Patterns (2026): Available vs. Booked Days
Available Days Distribution
Booked Days Distribution
Booking Pattern Insights for Kōfu
- The most common availability pattern in Kōfu falls within the 181-270 days range, representing 34.6% of listings. This suggests many properties have significant open periods on their calendars.
- Approximately 69.2% of listings show high availability (181+ days open annually), indicating potential for increased bookings or specific owner usage patterns.
- For booked days, the 91-180 days range is most frequent in Kōfu (38.5%), reflecting common guest stay durations or potential owner blocking patterns.
- A notable 30.8% of properties secure long booking periods (181+ days booked per year), highlighting successful long-term rental strategies or significant owner usage.
Kōfu Airbnb Minimum Stay Requirements Analysis
Distribution of Listings by Minimum Night Requirement
1 Night
25 listings
96.2% of total
30+ Nights
1 listings
3.8% of total
Key Insights
- The most prevalent minimum stay requirement in Kōfu is 1 Night, adopted by 96.2% of listings. This highlights the market's preference for shorter, flexible bookings.
- A strong majority (96.2%) of the Kōfu Airbnb data shows acceptance of very short stays (1-2 nights), indicating a dynamic, high-turnover market.
Recommendations
- Align with the market by considering a 1 Night minimum stay, as 96.2% of Kōfu hosts use this setting.
- Adjust minimum nights based on seasonality – potentially shorter during low season and longer during peak demand periods in Kōfu.
Kōfu Airbnb Cancellation Policy Trends Analysis (2026)
Flexible
4 listings
15.4% of total
Moderate
17 listings
65.4% of total
Firm
3 listings
11.5% of total
Strict
2 listings
7.7% of total
Cancellation Policy Insights for Kōfu
- The prevailing Airbnb cancellation policy trend in Kōfu is Moderate, used by 65.4% of listings.
- The market strongly favors guest-friendly terms, with 80.8% of listings offering Flexible or Moderate policies. This suggests guests in Kōfu may expect booking flexibility.
- Strict cancellation policies are quite rare (7.7%), potentially making listings with this policy less competitive unless justified by high demand or property type.
Recommendations for Hosts
- Consider adopting a Moderate policy to align with the 65.4% market standard in Kōfu.
- Using a Strict policy might deter some guests, as only 7.7% of listings use it. Evaluate if potential revenue protection outweighs possible lower booking rates.
- Regularly review your cancellation policy against competitors and market demand shifts in Kōfu.
Kōfu STR Booking Lead Time Analysis (2026)
Average Booking Lead Time by Month
Booking Lead Time Insights for Kōfu
- The overall average booking lead time for vacation rentals in Kōfu is 41 days.
- Guests book furthest in advance for stays during December (average 55 days), likely coinciding with peak travel demand or local events.
- The shortest booking windows occur for stays in February (average 21 days), indicating more last-minute travel plans during this time.
- Seasonally, Fall (44 days avg.) sees the longest lead times, while Winter (38 days avg.) has the shortest, reflecting typical travel planning cycles.
Recommendations for Hosts
- Use the overall average lead time (41 days) as a baseline for your pricing and availability strategy in Kōfu.
- For December stays, consider implementing length-of-stay discounts or slightly higher rates for bookings made less than 55 days out to capitalize on advance planning.
- Target marketing efforts for the Fall season well in advance (at least 44 days) to capture early planners.
- Monitor your own booking lead times against these Kōfu averages to identify opportunities for dynamic pricing adjustments.
Popular & Essential Airbnb Amenities in Kōfu (2026)
Amenity Prevalence
Amenity Insights for Kōfu
- Essential amenities in Kōfu that guests expect include: Hangers, Shampoo, Wifi, Smoke alarm, Hair dryer, Air conditioning. Lacking these (any) could significantly impact bookings.
- Popular amenities like Heating, Essentials, Hot water are common but not universal. Offering these can provide a competitive edge.
Recommendations for Hosts
- Ensure your listing includes all essential amenities for Kōfu: Hangers, Shampoo, Wifi, Smoke alarm, Hair dryer, Air conditioning.
- Prioritize adding missing essentials: Hair dryer, Air conditioning.
- Consider adding popular differentiators like Heating or Essentials to increase appeal.
- Highlight unique or less common amenities you offer (e.g., hot tub, dedicated workspace, EV charger) in your listing description and photos.
- Regularly check competitor amenities in Kōfu to stay competitive.
Kōfu Airbnb Guest Demographics & Profile Analysis (2026)
Guest Profile Summary for Kōfu
- The typical guest profile for Airbnb in Kōfu consists of predominantly international visitors (66%), with top international origins including United States, typically belonging to the Post-2000s (Gen Z/Alpha) group (50%), primarily speaking English or Japanese.
- Domestic travelers account for 34.5% of guests.
- Key international markets include Japan (34.5%) and United States (11.7%).
- Top languages spoken are English (41.9%) followed by Japanese (24.8%).
- A significant demographic segment is the Post-2000s (Gen Z/Alpha) group, representing 50% of guests.
Recommendations for Hosts
- Focus marketing internationally, particularly towards travelers from United States.
- Tailor amenities and listing descriptions to appeal to the dominant Post-2000s (Gen Z/Alpha) demographic (e.g., highlight fast WiFi, smart home features, local guides).
- Highlight unique local experiences or amenities relevant to the primary guest profile.
- Consider seasonal promotions aligned with peak travel times for key origin markets.
Nearby Short-Term Rental Market Comparison
How does the Kōfu Airbnb market stack up against its neighbors? Compare key performance metrics like average monthly revenue, ADR, and occupancy rates in surrounding areas to understand the broader regional STR landscape.
| Market | Active Properties | Monthly Revenue | Daily Rate | Avg. Occupancy |
|---|---|---|---|---|
| Shinagawa City | 50 | $7,769 | $428.93 | 62% |
| Futtsu | 31 | $5,187 | $369.80 | 44% |
| Kyonan | 15 | $5,099 | $419.89 | 42% |
| Adachi City | 47 | $4,752 | $301.69 | 50% |
| Kita | 15 | $4,563 | $305.24 | 57% |
| Nagatoro | 10 | $4,035 | $249.70 | 52% |
| Hakone | 335 | $3,905 | $289.84 | 48% |
| Karuizawa | 121 | $3,852 | $396.31 | 39% |
| Minato City | 99 | $3,809 | $311.75 | 53% |
| Miyota | 41 | $3,773 | $284.31 | 43% |