Tanabe Airbnb Market Analysis 2026: Short Term Rental Data & Vacation Rental Statistics in Wakayama Prefecture, Japan
Is Airbnb profitable in Tanabe in 2026? Explore comprehensive Airbnb analytics for Tanabe, Wakayama Prefecture, Japan to uncover income potential. This 2026 STR market report for Tanabe, based on AirROI data from February 2025 to January 2026, reveals key trends in the niche market of 78 active listings.
Whether you're considering an Airbnb investment in Tanabe, optimizing your existing vacation rental, or exploring rental arbitrage opportunities, understanding the Tanabe Airbnb data is crucial. Navigating the high regulation landscape is key to maximizing your short term rental income potential. Let's dive into the specifics.
Key Tanabe Airbnb Performance Metrics Overview
Monthly Airbnb Revenue Variations & Income Potential in Tanabe (2026)
Understanding the monthly revenue variations for Airbnb listings in Tanabe is key to maximizing your short term rental income potential. Seasonality significantly impacts earnings. Our analysis, based on data from the past 12 months, shows that the peak revenue month for STRs in Tanabe is typically April, while January often presents the lowest earnings, highlighting opportunities for strategic pricing adjustments during shoulder and low seasons. Explore the typical Airbnb income in Tanabe across different performance tiers:
- Best-in-class properties (Top 10%) achieve $3,396+ monthly, often utilizing dynamic pricing and superior guest experiences.
- Strong performing properties (Top 25%) earn $2,028 or more, indicating effective management and desirable locations/amenities.
- Typical properties (Median) generate around $851 per month, representing the average market performance.
- Entry-level properties (Bottom 25%) see earnings around $382, often with potential for optimization.
Average Monthly Airbnb Earnings Trend in Tanabe
Tanabe Airbnb Occupancy Rate Trends (2026)
Maximize your bookings by understanding the Tanabe STR occupancy trends. Seasonal demand shifts significantly influence how often properties are booked. Typically, Aprilsees the highest demand (peak season occupancy), while January experiences the lowest (low season). Effective strategies, like adjusting minimum stays or offering promotions, can boost occupancy during slower periods. Here's how different property tiers perform in Tanabe:
- Best-in-class properties (Top 10%) achieve 84%+ occupancy, indicating high desirability and potentially optimized availability.
- Strong performing properties (Top 25%) maintain 69% or higher occupancy, suggesting good market fit and guest satisfaction.
- Typical properties (Median) have an occupancy rate around 46%.
- Entry-level properties (Bottom 25%) average 21% occupancy, potentially facing higher vacancy.
Average Monthly Occupancy Rate Trend in Tanabe
Average Daily Rate (ADR) Airbnb Trends in Tanabe (2026)
Effective short term rental pricing strategy in Tanabe involves understanding monthly ADR fluctuations. The Average Daily Rate (ADR) for Airbnb in Tanabe typically peaks in August and dips lowest during January. Leveraging Airbnb dynamic pricing tools or strategies based on this seasonality can significantly boost revenue. Here's a look at the typical nightly rates achieved:
- Best-in-class properties (Top 10%) command rates of $224+ per night, often due to premium features or locations.
- Strong performing properties (Top 25%) achieve nightly rates of $108 or more.
- Typical properties (Median) charge around $59 per night.
- Entry-level properties (Bottom 25%) earn around $35 per night.
Average Daily Rate (ADR) Trend by Month in Tanabe
Get Live Tanabe Market Intelligence 👇

Explore Real-time Analytics
Airbnb Seasonality Analysis & Trends in Tanabe (2026)
Peak Season (April, October, November)
- Revenue averages $1,889 per month
- Occupancy rates average 59.5%
- Daily rates average $96
Shoulder Season
- Revenue averages $1,464 per month
- Occupancy maintains around 45.2%
- Daily rates hold near $98
Low Season (January, February, June)
- Revenue drops to average $998 per month
- Occupancy decreases to average 34.2%
- Daily rates adjust to average $95
Seasonality Insights for Tanabe
- The Airbnb seasonality in Tanabe shows highly seasonal trends requiring careful strategy. While the sections above show seasonal averages, it's also insightful to look at the extremes:
- During the high season, the absolute peak month showcases Tanabe's highest earning potential, with monthly revenues capable of climbing to $1,966, occupancy reaching a high of 62.8%, and ADRs peaking at $102.
- Conversely, the slowest single month of the year, typically falling within the low season, marks the market's lowest point. In this month, revenue might dip to $903, occupancy could drop to 26.8%, and ADRs may adjust down to $92.
- Understanding both the seasonal averages and these monthly peaks and troughs in revenue, occupancy, and ADR is crucial for maximizing your Airbnb profit potential in Tanabe.
Seasonal Strategies for Maximizing Profit
- Peak Season: Maximize revenue through premium pricing and potentially longer minimum stays. Ensure high availability.
- Low Season: Offer competitive pricing, special promotions (e.g., extended stay discounts), and flexible cancellation policies. Target off-season travelers like remote workers or budget-conscious guests.
- Shoulder Seasons: Implement dynamic pricing that balances peak and low rates. Target weekend travelers or specific events. Offer slightly more flexible terms than peak season.
- Regularly analyze your own performance against these Tanabe seasonality benchmarks and adjust your pricing and availability strategy accordingly.
Best Areas for Airbnb Investment in Tanabe (2026)
Exploring the top neighborhoods for short-term rentals in Tanabe? This section highlights key areas, outlining why they are attractive for hosts and guests, along with notable local attractions. Consider these locations based on your target guest profile and investment strategy.
| Neighborhood / Area | Why Host Here? (Target Guests & Appeal) | Key Attractions & Landmarks |
|---|---|---|
| Nachi-Katsuura | Famous for its picturesque coastline and the Nachi Falls, attracting tourists who appreciate nature and traditional culture. Ideal for guests looking for serene marine experiences and temple visits. | Nachi Falls, Kumano Nachi Taisha, Katsuura Underwater Park, Nachi-Katsuura Onsen, Hirou Shrine |
| Kumano City | A historic town at the intersection of the Kumano Kodo pilgrimage routes, rich in cultural heritage and natural beauty. Perfect for travelers interested in history, hiking, and spiritual journeys. | Kumano Hongu Taisha, Kumano Kodo, Oyunohara, Shingu Castle Ruins, Yunomine Onsen |
| Shirahama | A popular seaside resort town known for its beautiful beaches and onsen. Attracts families and beachgoers looking for relaxation and fun water activities. | Shirahama Beach, Adventure World, Engetsu Island, Shirahama Onsen, Senjojiki |
| Taiji | Famous for whale watching and the traditional dolphin hunting culture, appealing to eco-tourists and marine life enthusiasts. Offers unique experiences related to sea life. | Taiji Whale Museum, Whale watching tours, Mikazuki Park, Oshino Hot Springs |
| Wakayama City | The capital of Wakayama Prefecture with historical sites, shopping, and vibrant food culture. Great for travelers looking for urban experiences combined with cultural sightseeing. | Wakayama Castle, Kimiiji Temple, Shukubo Yoshinoya, Kushimoto Marine Park, Wakayamashi City Museum |
| Katsuura | Known for its fishing port and fresh seafood, as well as scenic coastal routes. Attracts food lovers and those interested in local Japanese culture and cuisine. | Katsuura Tuna Market, Katsuura Onsen, Ubara Beach, Katsuura Fishing Port, Tateshina Shrine |
| Shin-Okubo | A lively area known for its Korean influence and vibrant nightlife. Perfect for younger travelers and those interested in diverse cultural experiences and entertainment. | Korean Town, Shin-Okubo Station, K-Pop themed cafes, Cultural festivals |
| Kushimoto | A scenic coastal area with beautiful landscapes and opportunities for outdoor activities such as diving. Ideal for nature lovers and adventure seekers. | Kushimoto Marine Park, Hashigui-iwa Rocks, Kushimoto Coral Reef, Kushimoto Underwater Seamount |
Understanding Airbnb License Requirements & STR Laws in Tanabe (2026)
Yes, Tanabe, Wakayama Prefecture, Japan enforces high STR regulations. Obtaining a license and ensuring compliance is almost certainly required according to current 2026 STR laws. Always verify the latest short term rental regulations and Airbnb license requirements directly with local government authorities for Tanabe to ensure full compliance before hosting.
(Source: AirROI data, 2026, based on 100% licensed listings)
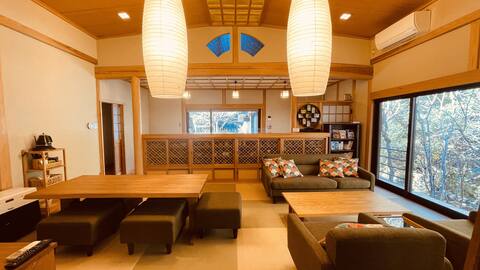
Top Performing Airbnb Properties in Tanabe (2026)
Benchmark your potential! Explore examples of top-performing Airbnb properties in Tanabebased on Trailing Twelve Month (TTM) revenue. Analyze their characteristics, revenue, occupancy rate, and ADR to understand what drives success in this market.

Ryunohara Hatago
Entire Place • 2 bedrooms

Japanese-Style Villa for Groups / Near Kumano Kodo
Entire Place • 4 bedrooms

Quiet Riverside Mountain Villa — Doratei
Entire Place • 2 bedrooms
Discount for junior high school and high school students / Summer vacation for adults / Easy BBQ / P
Entire Place • 2 bedrooms
![[One-family house FUKUYA Villa, up to 11 people] 800m from Kii Tanabe Station, supermarket nearby, c](https://a0.muscache.com/im/pictures/hosting/Hosting-1092986174339304880/original/01d38a51-06c2-4c5b-b14d-1edcc7b5a1cc.jpeg?im_w=480&im_format=avif)
[One-family house FUKUYA Villa, up to 11 people] 800m from Kii Tanabe Station, supermarket nearby, c
Entire Place • 4 bedrooms

Limited to one group per day, Guest House Agai is convenient for walking the Kumano Kodo and playing
Entire Place • 2 bedrooms
Note: Performance varies based on location, size, amenities, seasonality, and management quality. Data reflects the past 12 months.
Top Performing Airbnb Hosts in Tanabe (2026)
Learn from the best! This table showcases top-performing Airbnb hosts in Tanabe based on the number of properties managed and estimated total revenue over the past year. Analyze their scale and performance metrics.
| Host Name | Properties | Grossing Revenue | Stay Reviews | Avg Rating |
|---|---|---|---|---|
| 熊野古道古民家宿 | 8 | $147,646 | 224 | 4.55/5.0 |
| Lee | 2 | $122,399 | 127 | 4.99/5.0 |
| Shino | 3 | $80,227 | 73 | 4.76/5.0 |
| 熊野 | 1 | $72,678 | 32 | 4.72/5.0 |
| Jun | 2 | $62,312 | 407 | 4.97/5.0 |
| 峯園 | 4 | $57,248 | 137 | 4.84/5.0 |
| Masako | 5 | $56,887 | 78 | 4.88/5.0 |
| 哲弘 | 7 | $49,612 | 86 | 4.79/5.0 |
| Miko | 1 | $45,357 | 22 | 5.00/5.0 |
| Risa | 2 | $42,266 | 68 | 4.97/5.0 |
Analyzing the strategies of top hosts, such as their property selection, pricing, and guest communication, can offer valuable lessons for optimizing your own Airbnb operations in Tanabe.
Dive Deeper: Advanced Tanabe STR Market Data (2026)
Ready to unlock more insights? AirROI provides access to advanced metrics and comprehensive Airbnb data for Tanabe. Explore detailed analytics beyond this report to refine your investment strategy, optimize pricing, and maximize your vacation rental profits.
Explore Advanced MetricsTanabe Short-Term Rental Market Composition (2026): Property & Room Types
Room Type Distribution
Property Type Distribution
Market Composition Insights for Tanabe
- The Tanabe Airbnb market composition is heavily skewed towards Private Room listings, which make up 66.7% of the 78 active rentals. This indicates strong guest preference for privacy and space.
- Looking at the property type distribution in Tanabe, House properties are the most common (75.6%), reflecting the local real estate landscape.
- Houses represent a significant 75.6% portion, catering likely to families or larger groups.
- The presence of 9% Hotel/Boutique listings indicates integration with traditional hospitality.
- Smaller segments like unique stays, apartment/condo (combined 5.1%) offer potential for unique stay experiences.
Tanabe Airbnb Room Capacity Analysis (2026): Bedroom Distribution
Distribution of Listings by Number of Bedrooms
Room Capacity Insights for Tanabe
- The dominant room capacity in Tanabe is 1 bedroom listings, making up 25.6% of the market. This suggests a strong demand for properties suitable for couples or solo travelers.
- Together, 1 bedroom and 2 bedrooms properties represent 47.4% of the active Airbnb listings in Tanabe, indicating a high concentration in these sizes.
Tanabe Vacation Rental Guest Capacity Trends (2026)
Distribution of Listings by Guest Capacity
Guest Capacity Insights for Tanabe
- The most common guest capacity trend in Tanabe vacation rentals is listings accommodating 4 guests (14.1%). This suggests the primary traveler segment is likely small families or groups.
- Properties designed for 4 guests and 8+ guests dominate the Tanabe STR market, accounting for 25.6% of listings.
- 19.2% of properties accommodate 6+ guests, serving the market segment for larger families or group travel in Tanabe.
- On average, properties in Tanabe are equipped to host 2.4 guests.
Tanabe Airbnb Booking Patterns (2026): Available vs. Booked Days
Available Days Distribution
Booked Days Distribution
Booking Pattern Insights for Tanabe
- The most common availability pattern in Tanabe falls within the 271-366 days range, representing 37.2% of listings. This suggests many properties have significant open periods on their calendars.
- Approximately 62.8% of listings show high availability (181+ days open annually), indicating potential for increased bookings or specific owner usage patterns.
- For booked days, the 31-90 days range is most frequent in Tanabe (29.5%), reflecting common guest stay durations or potential owner blocking patterns.
- A notable 38.5% of properties secure long booking periods (181+ days booked per year), highlighting successful long-term rental strategies or significant owner usage.
Tanabe Airbnb Minimum Stay Requirements Analysis
Distribution of Listings by Minimum Night Requirement
1 Night
74 listings
94.9% of total
4-6 Nights
2 listings
2.6% of total
30+ Nights
2 listings
2.6% of total
Key Insights
- The most prevalent minimum stay requirement in Tanabe is 1 Night, adopted by 94.9% of listings. This highlights the market's preference for shorter, flexible bookings.
- A strong majority (94.9%) of the Tanabe Airbnb data shows acceptance of very short stays (1-2 nights), indicating a dynamic, high-turnover market.
- Dedicated monthly rentals (30+ nights) represent a small niche (2.6%), possibly an untapped area for hosts.
Recommendations
- Align with the market by considering a 1 Night minimum stay, as 94.9% of Tanabe hosts use this setting.
- Adjust minimum nights based on seasonality – potentially shorter during low season and longer during peak demand periods in Tanabe.
Tanabe Airbnb Cancellation Policy Trends Analysis (2026)
Flexible
23 listings
29.5% of total
Moderate
35 listings
44.9% of total
Firm
20 listings
25.6% of total
Cancellation Policy Insights for Tanabe
- The prevailing Airbnb cancellation policy trend in Tanabe is Moderate, used by 44.9% of listings.
- The market strongly favors guest-friendly terms, with 74.4% of listings offering Flexible or Moderate policies. This suggests guests in Tanabe may expect booking flexibility.
Recommendations for Hosts
- Consider adopting a Moderate policy to align with the 44.9% market standard in Tanabe.
- Regularly review your cancellation policy against competitors and market demand shifts in Tanabe.
Tanabe STR Booking Lead Time Analysis (2026)
Average Booking Lead Time by Month
Booking Lead Time Insights for Tanabe
- The overall average booking lead time for vacation rentals in Tanabe is 59 days.
- Guests book furthest in advance for stays during October (average 76 days), likely coinciding with peak travel demand or local events.
- The shortest booking windows occur for stays in June (average 43 days), indicating more last-minute travel plans during this time.
- Seasonally, Fall (72 days avg.) sees the longest lead times, while Winter (47 days avg.) has the shortest, reflecting typical travel planning cycles.
Recommendations for Hosts
- Use the overall average lead time (59 days) as a baseline for your pricing and availability strategy in Tanabe.
- For October stays, consider implementing length-of-stay discounts or slightly higher rates for bookings made less than 76 days out to capitalize on advance planning.
- Target marketing efforts for the Fall season well in advance (at least 72 days) to capture early planners.
- Monitor your own booking lead times against these Tanabe averages to identify opportunities for dynamic pricing adjustments.
Popular & Essential Airbnb Amenities in Tanabe (2026)
Amenity Prevalence
Amenity Insights for Tanabe
- Popular amenities like Air conditioning, Shampoo, Wifi are common but not universal. Offering these can provide a competitive edge.
- Warning: Wifi is not universally provided but is considered essential globally. Ensure reliable Wifi is offered.
Recommendations for Hosts
- Consider adding popular differentiators like Air conditioning or Shampoo to increase appeal.
- Highlight unique or less common amenities you offer (e.g., hot tub, dedicated workspace, EV charger) in your listing description and photos.
- Regularly check competitor amenities in Tanabe to stay competitive.
Tanabe Airbnb Guest Demographics & Profile Analysis (2026)
Guest Profile Summary for Tanabe
- The typical guest profile for Airbnb in Tanabe consists of predominantly international visitors (96%), with top international origins including China, typically belonging to the Post-2000s (Gen Z/Alpha) group (50%), primarily speaking English or Chinese.
- Domestic travelers account for 3.9% of guests.
- Key international markets include United States (16.3%) and China (13.4%).
- Top languages spoken are English (41.2%) followed by Chinese (13.1%).
- A significant demographic segment is the Post-2000s (Gen Z/Alpha) group, representing 50% of guests.
Recommendations for Hosts
- Focus marketing internationally, particularly towards travelers from China.
- Tailor amenities and listing descriptions to appeal to the dominant Post-2000s (Gen Z/Alpha) demographic (e.g., highlight fast WiFi, smart home features, local guides).
- Highlight unique local experiences or amenities relevant to the primary guest profile.
- Consider seasonal promotions aligned with peak travel times for key origin markets.
Nearby Short-Term Rental Market Comparison
How does the Tanabe Airbnb market stack up against its neighbors? Compare key performance metrics like average monthly revenue, ADR, and occupancy rates in surrounding areas to understand the broader regional STR landscape.
| Market | Active Properties | Monthly Revenue | Daily Rate | Avg. Occupancy |
|---|---|---|---|---|
| Minamiawaji | 41 | $4,120 | $363.92 | 40% |
| Shima | 40 | $3,717 | $295.59 | 40% |
| Toba | 12 | $3,477 | $332.20 | 31% |
| Shimogyo Ward | 34 | $3,396 | $279.96 | 49% |
| Awaji | 106 | $3,260 | $271.78 | 41% |
| Minami Ward | 28 | $2,977 | $202.49 | 59% |
| Fushimi Ward | 12 | $2,704 | $194.55 | 53% |
| Tonosho | 59 | $2,640 | $169.56 | 51% |
| Shodoshima | 29 | $2,301 | $167.15 | 47% |
| Higashiyama Ward | 36 | $2,209 | $161.63 | 48% |